1. Introduction
The relationship between urban spatial structure and commuting behavior has long been a topic of interest in urban planning. Changes in urban space influence workers’ commuting behavior, contributing to urban challenges such as congestion, energy consumption, carbon emissions, and air pollution [
1,
2]. The polycentric urban structure, resulting from employment decentralization, has recently emerged as a prevalent model for explaining the spatial organization of metropolitan areas [
3,
4,
5]. Its impact on commuting behavior has been widely debated [
6,
7,
8]. Employment decentralization and the formation of subcenters may reshape the spatial relationship between jobs and housing, potentially affecting commuting behaviors. Consequently, a central debate concerns whether polycentric structures decrease workers’ commuting times and distances [
9,
10].
Theoretically, proponents of polycentric structures draw upon co-location theory, which posits that workers choose residential locations near employment centers, fostering job–housing proximity. Empirical studies support this theory, demonstrating that employment decentralization can reduce commuting times and distances [
11,
12]. However, there are also conclusions that polycentric structures do not reduce workers’ commuting distance [
13,
14]. These conclusions are mainly based on the lag in housing supply compared to the decentralization of employment, which prevents co-location. In light of this, further research continues to be needed to clarify commuting dynamics in polycentric structures. The complexity of the relationship between urban spatial structure and commuting behavior demands comprehensive analyses that account for multiple factors [
2]. Notably, the socioeconomic characteristics of workers and the heterogeneous attributes of employment centers must be considered. Employment centers vary in industrial composition and geographical location, which influence commuting behavior differently [
15,
16,
17]. Moreover, socio-demographic characteristics of workers interacting with these factors contribute to variations in commuting behavior across employment centers [
18,
19].
For instance, the industrial composition of employment centers relates to workers’ occupations and income levels, which shape residential location choices and mobility patterns, leading to variations in commuting behavior [
20]. Furthermore, high housing prices in urban centers often push affordable housing to suburban areas, forcing workers employed in central locations to commute long distances. This suggests that job proximity is significantly influenced by neighborhood housing prices, which are, in turn, determined by the geographical attributes of the employment centers. A sophisticated understanding of commuting behavior in polycentric structures requires integrating socioeconomic factors with the characteristics of each employment center. However, previous studies analyzing workers’ commuting behavior in polycentric structures have generally used polycentricity and commuting distance (time) measured at the aggregated metropolitan level. In addition, few studies have analyzed the effects of employment center characteristics, such as industrial composition and nearby housing prices, on commuting behavior in the context of East Asian cities.
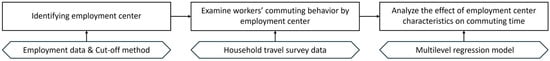
Addressing this gap, our study investigates the differences in commuting behavior among workers in each employment center and examines the influence of employment center characteristics on commuting times. Commuting time is an important commuting behavior that is associated with stress, poor health, and lower productivity among workers. Using the Seoul Metropolitan Area (SMA) as a case study, we identify employment centers and analyze workers’ commuting behavior using household travel survey (HTS) data. We apply a multilevel regression model to assess the impact of employment center characteristics, including industry composition and housing prices, on commuting times (
Figure 1). The findings reveal notable differences in workers’ commuting behavior across employment centers and demonstrate that employment center characteristics can shape commuting dynamics in diverse ways.
The remainder of this paper is structured as follows:
Section 2 reviews the literature on the identification of employment centers, their heterogeneous characteristics, and their association with commuting behavior.
Section 3 describes the context of the SMA, along with the data and methodology.
Section 4 presents the results and
Section 5 discusses the findings and their implications, while
Section 6 concludes by presenting the contributions and limitations of this study.
2. Literature Review
In metropolitan areas, employment is not confined to a single location, and it has undergone significant suburbanization and decentralization as cities expand. This has sparked ongoing debate about whether these processes lead to employment dispersion or subcenter formation. Some studies have reported a general trend of employment dispersion in US metropolitan areas [
21,
22], while others support the idea of sub-centering employment and the development of polycentric urban structures. This is empirically evident not only in US metropolitan areas [
3,
23,
24] but also in East Asian metropolitan areas [
4,
16], including the SMA. Jun [
2] found that the number of employment centers in SMAs increased from four to seven between 2000 and 2015, and Kwon [
5] found that the employment share of subcenters within the SMA increased during the same period. These trends suggest that the SMA is becoming increasingly polycentric.
The identification of employment centers is influenced by the methodological approach, and numerous methods have been proposed for this purpose. These include cutoff methods [
23], parametric and non-parametric estimation methods [
24,
25], and spatial clustering methods [
26]. The cutoff method identifies centers by setting a threshold for employment density or total employment. On the other hand, parametric and non-parametric estimation methods use statistical tests that estimate the employment density gradient. The main difference between the two methods is that parametric estimation methods require the employment density function to be determined in advance [
27]. Spatial clustering methods define centers by identifying spatial clusters based on metrics such as employment density and traffic flow. Each method has strengths and weaknesses, which may result in overestimating or underestimating the number of employment centers [
15]. For example, cutoff methods have been widely utilized owing to their relative simplicity [
28], but prior knowledge of the study area is required to establish thresholds. Conversely, parametric and non-parametric methods can minimize subjective bias by utilizing statistical techniques [
27], but their computational complexity often results in unrealistic center identification [
29,
30]. Therefore, it is important to recognize the advantages and disadvantages of each method and apply them to study areas and objectives.
Employment centers are focal points for commuting flows shaping regional commuting patterns [
15]. Numerous studies have investigated how workers’ commuting patterns are influenced by polycentric structures with multiple subcenters. Some researchers believe that decentralization and sub-centralization of employment contribute to more sustainable travel patterns [
1,
8,
31,
32]. They argue that the polycentric distribution of employment leads to the co-location of workplaces and residences, thereby reducing commuting times and distances. However, other studies present contradictory findings, such as longer commuting times for subcenter workers in the San Francisco Bay Area and longer commuting times and distances in the Netherlands for polycentric cities compared to monocentric cities [
13,
14].
These conflicting conclusions demonstrate that the relationship between employment centers and commuting behavior is highly complex and greatly influenced by the local context. It also suggests that there is a need to accumulate discussions from different study areas and consider the potential factors that influence the relationship between employment centers and commuting behavior. In particular, commuting behavior is closely related to the characteristics of the urban environment and the socioeconomic characteristics of workers, such as age and income level [
10,
33]. Each worker comes from a different socioeconomic background and, therefore, has heterogeneous characteristics that can directly or indirectly affect commuting behavior. Nevertheless, Jun [
2] noted that many studies have analyzed the relationship between average commuting time and distance in metropolitan areas and polycentricity levels without considering factors that may affect workers’ individual characteristics. Therefore, it is fundamental to consider workers’ socioeconomic characteristics when analyzing the relationship between employment centers and commuting behavior.
Furthermore, the characteristics of the various employment subcenters are partly different, which, combined with the socioeconomic characteristics of workers, can have a compounding effect on commuting behavior. Specifically, the industrial composition of employment centers can be related to the occupation and income level of workers, which can lead to different commuting behaviors. Within metropolitan areas, employment centers differ in terms of specialized industry composition and types, amongst others [
34,
35]. For example, manufacturing tends to be land-intensive and is therefore concentrated in smaller, lower-density centers, whereas financial and knowledge-intensive services tend to be concentrated in or near metropolitan centers in agglomeration economies [
34,
36]. The industrial composition of employment centers is closely related to the occupation of workers, and differences in occupation can lead to variations in commuting behavior [
37]. Industrial composition can also be related to workers’ income levels [
15], which affects commuting costs and residential location choices. Consequently, the heterogeneous industrial composition of employment centers, coupled with the socioeconomic characteristics of workers, may influence commuting behavior.
Furthermore, housing prices near employment centers also affect the spatial proximity of job-housing [
38]. The lack of affordable housing in metropolitan areas increases the physical distance between the workplace and residence, which naturally leads to longer commuting times and distances [
39,
40]. Living near employment centers means paying higher housing prices, and workers who cannot afford them are forced to commute longer distances. However, the suburbs of metropolitan areas have relatively low housing prices, implying that workers in suburban centers may be able to commute relatively short distances. This suggests that the geographic location of employment centers may be associated with housing price levels, which may lead to differences in commuting times. The SMA, in particular, might be a good place to analyze whether this trend is observed, as it has experienced steady suburbanization of both housing and employment.
The literature review results suggest that it is necessary to consider both the socioeconomic characteristics of workers and the characteristics of employment centers to understand commuting dynamics in polycentric structures. These two factors may influence workers’ commuting behavior through complex relationships. Nevertheless, there is a lack of research that considers this in the context of East Asian cities and analyses its impact on workers’ commuting times. In particular, the SMA, one of the densest urban areas in the world, has experienced steady population and employment growth and suburbanization, making it a suitable study area to analyze the relationship between employment decentralization and commuting patterns [
2]. By analyzing the heterogeneous commuting behavior of workers by employment center and the effect of employment center characteristics on commuting times, our study provides a concrete understanding of the relationship between employment centers and commuting behavior in a polycentric structure.
3. Data and Methods
3.1. Study Area
The SMA is the capital region of South Korea, encompassing approximately 11,800 km
2 and including the metropolitan cities of Seoul and Incheon, as well as Gyeonggi Province (
Figure 2). As of 2021, the SMA had a population of approximately 26 million and a workforce of approximately 12.9 million [
41]. This densely urbanized region hosts more than half of South Korea’s population and employment. Suburbanization in the SMA has been shaped by both public policies and market forces, influencing its urban spatial structure.
The South Korean government initiated new town development projects in suburban areas to address housing shortages and counter housing market speculation [
42]. Housing price volatility and high costs in Seoul have been persistent challenges for the region [
43,
44]. The first phase of new town development in the 1990s resulted in five new towns located 2–30 km from Seoul’s central business district (CBD). The second phase in the 2000s added 10 new towns within a 4–50 km radius of the CBD [
2] (
Figure 2). Together, these initiatives added approximately 900,000 housing units to the suburbs, dispersing the population across the SMA.
Employment decentralization also occurred during this period, driven by large-scale industrial complex development in Incheon and Gyeonggi Province during the 1980s. This relocation of employment functions from Seoul to the suburbs has resulted in rapid employment growth in these regions, especially near new towns [
5]. A notable characteristic of the SMA is its high reliance on public transportation (PT); as of 2021, PT accounted for approximately 63% of trips within Seoul [
45]. This reflects a well-integrated PT network and a preference for PT to avoid congestion.
3.2. Data
This study utilized two primary datasets from 2021: employment data from Eup-myeon-dong (the basic administrative unit in South Korea) and household travel survey (HTS) data. Employment data, derived from the National Business Survey, included the total number of employees in each Eup-myeon-dong, disaggregated by industry according to the Korean Standard Industrial Classification (KSIC).
HTS data were utilized to extract a commuting sample. The data provided information on travel patterns and household characteristics. They included variables such as household size, income, housing type, car ownership, and individual socioeconomic details like gender and age. Travel-related data, including purpose, mode of transportation, and travel time, were also included. Specifically, the HTS contains the travel origin type and destination type (e.g., home, workplace, school), and the geographic location of the origin and destination is recorded in Eup-myeon-dong units. Understandably, the spatial unit of analysis in this study is the Eup-myeon-dong. Eup-myeon-dong is the lowest level of administrative division in South Korea and has been widely used as the spatial unit of analysis in many studies. Therefore, we believe it is an appropriate spatial unit to describe the environment near the workplace. From the HTS data, we extracted travels with travel purpose stated as trip-to-work, travel origin stated as home, and travel destination stated as workplace and used these in our analysis. For this study, only travels originating from homes and terminating at workplaces within the SMA were considered.
3.3. Identifying Employment Center
We employed the cutoff method to identify employment centers, a widely used approach due to its simplicity [
23,
27,
46]. Employment centers were defined based on thresholds for employment density and total employment. Specifically, centers were identified as areas with at least 30,000 employees per km
2 (20,000 employees for Gyeonggi Province) or a total employment of at least 0.5% of the SMA’s workforce (approximately 64,700 employees). Jun and Ha [
47] set thresholds of 20,000 employees per km
2 and 50,000 total employees for Seoul. However, considering the employment growth since that study, our thresholds were set higher for Seoul and Incheon. This threshold is based on recent research [
2] on the SMA. This study [
2] applied a two-stage approach to identify spatial structure changes in the SMA. In the first stage, applying the cutoff method, thresholds of 30,000 employment density in Seoul and 20,000 for outer cities were applied. As we will explain in the results section, the employment centers identified by our threshold are similar to many previous studies, so we believe our thresholds are reasonable.
For suburban areas like Gyeonggi, we adopted lower thresholds to account for their unique contexts, consistent with the existing literature [
4,
23,
48]. This two-tiered threshold approach enabled us to capture diverse employment centers, including manufacturing-oriented industrial complexes with relatively low density but high total employment.
3.4. Multilevel Regression Model
A three-level multilevel regression model was applied to analyze the effect of employment center characteristics on commuting time.
Table 1 lists the model variables. The dependent variable was commuting time (measured in minutes). Control variables included individual socioeconomic characteristics, such as gender, age, household size, housing type, income level category, car ownership, and commuting mode. Income level categories were divided into six ranges, as listed in the HTS. The extremely high income category is utilized as a reference group. Non-motorized commuting (e.g., walking, cycling) served as the reference group for commuting mode.
Key explanatory variables included PT density, industry composition, and housing price. PT accessibility in employment centers is known to be associated with commuting behavior [
49,
50] and is particularly important for workers’ mode choice, which can affect commuting time. As mentioned above, the modal share of PTs in the SMA is very high, so PT accessibility can be used as a proxy for transportation accessibility to the center. While good PT accessibility is important in that it can contribute to reducing the environmental impact of commuting by encouraging PT use, it can also encourage longer commutes. Therefore, we constructed a variable to understand how PT access in employment centers affects workers’ commuting time. Buses and subways are commonly used PT in the SMA, and we estimated the density of PT in the area by the total number of bus stops and subway stations per km
2 in each Eup-myeon-dong.
Industrial composition variables included the number of workers in manufacturing, basic services (e.g., retail, accommodation), finance, insurance, and real estate (FIRE), and knowledge-intensive service (KIS) industries based on KSIC classifications. We define basic services as wholesale and retail trade and accommodation and food service activities; FIRE industries as financial and insurance activities and real estate activities; and KIS industries as information and communication and professional, scientific, and technical activities. These are the major industries of employment centers in the SMA. We hypothesized that industrial composition would have different effects on commuting behavior due to a combination of the geographic location of the center and the socioeconomic factors of workers. For example, centers located downtown and centers located in the suburbs have different industrial compositions, suggesting that the geographic location of the center might be linked to industrial composition and affect commuting behavior. In addition, workers in specific industries may earn relatively higher incomes and, therefore, have a better ability to choose their residential location. Therefore, we constructed industrial composition variables to explore this.
Finally, we constructed an average housing price variable, assuming that housing prices near employment centers may significantly impact workers’ ability to achieve job–housing proximity. Cervero and Wu [
3] found that high housing prices in or near employment centers induce long-distance commuting. Seoul, the central city of the SMA, is a city with high housing prices, making it a proper case for understanding the relationship between housing prices and commuting behavior. The housing price variable was constructed as the average transaction price using real estate transaction data as of 2021. Unlike the other two variables, it was constructed at the Si-gun-gu level. Si-gun-gu is an administrative unit in South Korea that is one level higher than Eup-myeon-dong. The reason for using a differential hierarchy for the variable is that the absolute number of housing units in Eup-myeon-dong identified as employment centers may be small, and workers typically consider not only the area where they work but also the surrounding area as their residential location.
The explanatory variables constructed are multilevel data, consisting of socioeconomic characteristics at the individual commuter level (1-level) and employment center characteristics at the Eup-myeon-dong (2-level) and Si-gun-gu (3-level) levels. If a general regression analysis is performed by treating the multilevel data as single-level data, there is a possibility that the model estimation results may be erroneous. Multilevel models are designed to uncover structural relationships in which individual characteristics at lower levels vary as a function of higher-level group characteristics [
51]. In a model, an error term that reflects within-group variance is set aside in the regression equation, along with an error term that reflects between-group variance, and these are estimated separately [
52]. This allows for more accurate estimates that consider both the group (higher level) characteristics and the individual (lower level) characteristics.
4. Results
4.1. Employment Centers in SMA
Figure 3 illustrates the spatial distribution of the identified employment centers. A total of 40 areas (Eup-myeon-dong) out of the 1137 areas in the SMA were identified as employment centers using the minimum threshold criteria. The identified areas can be clustered into 12 employment centers based on geographic proximity and industry type. Clustering was performed primarily to facilitate an understanding of commuting behavior differences across employment centers. However, the clusters were not used as the unit of analysis in the multilevel regression model. Most employment centers are located within Seoul, with two within a radius of 15–30 km from Seoul and two outside of a 30 km radius. The identification results of our study are broadly similar to those of previous studies that identified employment centers in the SMA [
2,
5].
Table 2 illustrates the total employment and major industrial sectors of each center. The total employment in the identified employment centers is approximately 2.62 million, or approximately 20% of total employment in the SMA. Most employment centers have a high concentration of commercial functions alongside office functions and are generally dominated by wholesale and retail trade (WR). Excluding WR, the traditional CBDs in Seoul’s Jongno and Jung-gu districts are dominated by financial and insurance activities (FI) and professional, scientific, and technical activities (PS), whereas the GBDs with the largest employment are dominated by PS and communication (IC). The YBD is a financial center with specialized FIs. Guro-gasan was originally an industrial complex area centered on manufacturing, but through changes in land use regulations, it has been transformed into a concentration of ICT industries with a large share of IC [
36]. Songpa has a high concentration of construction (CO) and ICs, whereas Magok is a relatively new center for R&D functions with a high proportion of PSs. Seongsu was once a representative industrial area in Seoul, but it has recently been transformed into a center for venture startups, concentrating on manufacturing (MF) and PS. Hongdae is a representative commercial area that has recently seen an increase in the share of ICs, with many startups linked to nearby universities [
5].
Bundang and Anyang, which are centers identified in suburban Gyeonggi Province, are centers of concentrated employment linked to new town development projects. Bundang has a very high share of ICs because of its location in the Pangyo Techno Valley, where ICT-based ventures are concentrated. Anyang has a high proportion of MF and PS owing to a mix of industrial and business functions. Ansan and Namdong, which are located on the southwestern coast of the SMA, are industrial areas designated as national industrial complexes. Unlike Seoul and nearby Bundang and Anyang, which specialize in KIS industries such as IC and PS, the two areas have very different characteristics, with over 70% of employment concentrated in MF.
4.2. Differences in Commuting Behavior by Employment Center
A total of 5574 commute samples were extracted by combining the HTS data with the results of employment center identification.
Figure 4 illustrates the commuting time (in minutes) and mode share by each employment center. When looking at the average commuting time for each employment center, as illustrated in
Table 3, GBD has the longest average commuting time of 58.7 min, followed by Songpa at 56.6 min and CBD at 55.6 min, with the average commuting time for centers in Seoul exceeding 50 min. In comparison, suburban centers have relatively shorter commuting times, with average commuting times of Bundang 48.8 min, Anyang 47.6 min, Ansan 41.6 min, and Namdong 37.9 min. We conducted ANOVA and post-hoc analyses to determine the statistical significance of these differences. We found that, in general, there was a significant difference in commuting time between Seoul and the suburban centers (
Appendix A). The difference in average commuting time suggests a difference in the job–housing proximity of workers by center, and it can be speculated that workers in suburban centers have relatively high levels of job–housing proximity and, therefore, commute shorter distances.
Differences in commuting times by center can also be attributed to differences in commuting modes. Generally, workers in Seoul are more likely to use PT. In most of Seoul’s centers, more than half of the commutes are made by PT, with the subway being the most common. This demonstrates that, owing to the congestion of road traffic in the city center, the subway is the preferred mode of commuting due to its punctuality and other advantages. It is believed that workers in Seoul have to commute for a long time, not only because of the long distance between their residences and workplaces but also because they use PT as a mode of commuting. However, in suburban centers such as Bundang, Anyang, Ansan, and Namdong, the use of PT is much lower. In these areas, the use of cars for commuting is the most common, with proportions exceeding 50% in Bundang and Anyang and 70% in Ansan and Namdong. This aligns with previous studies that found that suburban workers are more likely to use cars [
53]. This difference can be explained by the fact that suburban areas are less densely served by PT systems than Seoul, and workers are more likely to actively use their cars because of the lower congestion.
4.3. Result of Multilevel Regression Model
Next, the effect of employment center characteristics on commuting time was analyzed using a multilevel regression model.
Table 4 presents the descriptive statistics of the variables used in the multilevel regression model. The total number of commuters in the sample was 5574. As mentioned earlier, there are 40 Eup-myeon-dong identified as employment centers, which are the spatial units for the second-level variables. The third-level variable, housing price, is constructed at the Si-gun-gu level, which includes the Eup-myeon-dong of employment centers, with a total of 15. The dependent variable, commuting time, had a mean of 54.30 min and a standard deviation of 24.85 min.
Table 5 presents the results of multilevel regression models. The inter-class correlation coefficient (ICC) indicates how much of the variation in the dependent variable is explained by higher-level variables. The analysis demonstrated that the ICC of the second and third levels were approximately 0.5% and 4.6%, respectively. This means that approximately 5% of the total variation in commuting time is explained by the characteristics of employment centers. These results align with previous studies that metropolitan structures have a large impact on commuting behavior but account for a small proportion of the variation in commuting behavior [
2,
14].
Based on Model 3, in which all variables are included and fixed effects are estimated, the results demonstrate that all socioeconomic variables are significant, except for age. Men had longer commuting times than women, and workers with more household members and those living in apartments had longer commuting times. This finding supports those of several previous studies [
54,
55,
56,
57]. Regarding income, we find that lower income levels are associated with longer commutes than the reference group (i.e., extremely high-income workers). This is likely because higher-income workers can afford to live in housing near employment centers, resulting in shorter commutes. The results are not significant for extremely low-income workers, likely due to this group’s small sample of commuters.
Workers who owned cars tended to commute longer than those who did not. In terms of commute mode, car and PT commuters had longer commuting times than the reference group (i.e., non-motorized) commuters. PT commuters also tended to commute longer than car commuters. This reflects variations in commute mode share and average commuting times across employment centers. Similarly, a higher PT density in employment centers was associated with longer commuting times for workers, suggesting that better PT accessibility in employment centers encourages PT commuting, leading to longer commuting times. The results of the socioeconomic variables directly reflect the commuting patterns of SMAs, in which workers with relatively low incomes live on the outskirts or in the suburbs of Seoul and commute via PT.
The industry composition of employment centers had different effects on commuting times. First, centers with larger manufacturing industries tend to have shorter commuting times for workers. This reiterates the finding that workers in suburban areas, such as Ansan and Namdong, which are manufacturing centers, have shorter commuting times than workers in other centers. Although both basic services and FIRE industries are classified as tertiary industries, their sizes affect commuting time differently. The larger the size of the basic service industry, the longer the commute, whereas centers with larger FIRE industries had shorter commutes for workers. Given that industry composition is related to workers’ occupations, we speculate that this is a consequence of the general income level of workers in each industry. Thus, this result suggests that workers in relatively high-income industries (e.g., FIRE industries) can afford to live near the center, whereas workers in relatively low-income industries (e.g., basic services) cannot, which leads to longer commutes. The relatively shorter average commuting time in the YBD, which has a high proportion of FIs compared with other centers in Seoul, may reflect this relationship. However, the effect of the KIS industry size on commuting time was not significant.
The housing price variable indicates the housing prices in the vicinity of the employment center. The results demonstrate that lower housing prices near employment centers are associated with shorter commuting times for workers, meaning that lower housing prices near centers may be associated with higher levels of job–housing proximity. In metropolitan areas, including the SMA, housing prices near suburban centers tend to be relatively low. This is a major reason for the relatively short commute times in Bundang, Anyang, Ansan, and Namdong. These results, therefore, suggest that the geographical location of employment centers and their different housing price levels are key determinants of workers’ job–housing proximity.
5. Discussion
Our findings demonstrated that the SMA’s employment centers exist in various geographical locations and vary in industrial composition. Most of the centers located in Seoul are mainly composed of KIS industries, while suburban centers have a higher proportion of manufacturing industries. When examining commuting behavior across employment centers, distinct differences were evident. Workers commuting to centers within Seoul experienced relatively longer average commuting times, whereas those commuting to suburban centers farther from Seoul had shorter average commuting times. This finding supports the hypothesis that employment decentralization and subcenter formation can reduce commuting times. Additionally, differences in commuting modes were identified: commuters in central Seoul were more likely to use PT, whereas those in suburban centers predominantly drove to work. These patterns suggest that central city commuters rely on PT to avoid congestion, while suburban commuters favor driving due to lower PT accessibility.
The analysis of the effects of employment center characteristics on commuting times revealed several key insights. First, while good PT accessibility in employment centers theoretically encourages PT use [
58], our analysis indicated that PT users in the SMA often endure long commuting distances. Due to the high housing prices in Seoul, many workers live on the outskirts and in nearby suburbs of the city, but due to the SMA’s well-developed PT (especially subway) system, workers tend to live on the outskirts of Seoul and commute long distances by PT. The well-developed PT system facilitates access for workers from the outskirts and suburbs, but this accessibility may inadvertently encourage long commutes. Long commutes can lead to problems such as stress, health, and reduced productivity for workers, highlighting the need to consider potential negative consequences such as stress, health problems, and reduced productivity when designing PT policies. In addition, a high-speed commuter train called the Great Train eXpress (GTX) is under construction in the SMA to reduce commute times for workers using PT. The train will connect densely populated areas on the outskirts and in the suburbs of Seoul with employment centers. It will be interesting to observe whether these new PT policies can significantly reduce worker commute times.
The industrial composition of employment centers also significantly influenced commuting times, albeit differently for various industries. Centers dominated by manufacturing industries, typically located in suburban areas, were associated with shorter commutes. This trend was exemplified by the relatively short commuting times observed in Ansan and Namdong. Conversely, centers with significant concentrations of FIRE industries, predominantly located in Seoul, exhibited shorter commuting times, likely due to the higher income levels and occupational characteristics of workers in these industries. Our analysis of income levels demonstrates that higher-income workers have relatively short commutes. These results highlight the complex interplay between industrial composition, geographical location, and worker income in shaping commuting dynamics.
Finally, our findings also underscore the critical role of affordable housing near employment centers. Workers commuting to Seoul faced longer average commutes than those commuting to suburban centers, a disparity primarily attributed to the lack of affordable housing in Seoul. By contrast, the relative affordability of housing near suburban centers allowed workers to achieve greater job–housing proximity. From a policy perspective, adjusting the industrial composition or geographic location of employment centers or uniformly raising worker incomes to reduce commuting times is challenging. Instead, an adequate supply of affordable housing near employment centers presents a practical and effective solution. Public policies aimed at promoting job–housing proximity should be prioritized, particularly in central cities in metropolitan areas, where high real estate prices limit market-driven solutions. Notably, many studies conducted in other metropolitan areas have also highlighted that having affordable housing near the workplace significantly impacts commuting behavior [
40,
59]. Therefore, such policies are not just applicable in the context of East Asian cities but could be a comprehensive solution for metropolitan areas worldwide that are struggling with a lack of affordable housing.
6. Conclusions
The debate on whether polycentric urban structures reduce workers’ commuting time remains unresolved and inconclusive. This underscores the need to accumulate empirical findings across diverse regions and to conduct comprehensive discussions that account for various influencing factors. Consequently, this study aimed to analyze differences in commuting behavior by employment center and to examine the impact of employment center characteristics on commuting time, using the SMA as a case study.
Previous studies have mainly discussed the relationship between polycentric structure and commuting behavior based on polycentricity measured at the aggregated metropolitan level. In contrast, our study contributes to the literature by demonstrating that in the broader context of East Asian cities, the heterogeneous characteristics of employment centers influence overall commuting behavior and exert compounding effects on commuting times. This is significant, as it offers concrete insights into the relationship between employment centers and commuting behavior within polycentric urban structures.
However, this study has limitations. The HTS data used were derived from a relatively small sample size. Advances in big data, such as mobile phone data, now enable the collection of larger travel samples with higher spatial and temporal resolutions. Future research should leverage these data to conduct more detailed analyses. Furthermore, analyses of commuting distances not considered in this study and using long-term data to track changes in the relationship between employment center characteristics and commuting behavior are needed. The relationship formed between urban spatial structure and commuting behavior is a gradual and long-term process. This study is limited by its use of data from a single point in time in 2021. Further studies using data from multiple time periods are needed for a more comprehensive analysis.