The prediction of stock market prices has been a long-standing challenge for financial analysts and investors. The intrinsic volatility and complexity of financial markets make it difficult to accurately forecast future trends. Traditional models such as linear regression and time-series models such as ARIMA are often limited in their ability to capture non-linear and sequential dependencies within the data [
1]. This has led to the growing use of machine learning (ML) and deep learning (DL) techniques for stock market forecasting. The NGX All-Share Index, a key indicator of stock market performance in Nigeria, provides a robust dataset for evaluating the effectiveness of different forecasting models. In this study, we compare three models: Support Vector Regression (SVR), Recurrent Neural Networks (RNN), and Long Short-Term Memory (LSTM), to identify the most effective model for predicting market prices. Each model is uniquely suited to different types of data and prediction tasks, and understanding these differences is crucial for financial time-series forecasting. SVR is known for its robustness in small datasets and simple tasks, while RNN and LSTM excel in handling sequential data due to their inherent architecture. SVR operates by mapping input features into two-dimensional spaces using kernel functions, allowing it to capture market relationships. However, it can struggle with time-series data where past information strongly influences future trends. RNN is a type of deep learning model that is designed to capture sequential data, but it suffers from the vanishing gradient problem, which limits its ability to retain long-term dependencies. LSTM, an extension of RNN, solves this issue by introducing memory cells that store relevant information over longer periods [
2]. This makes it ideal for time-series forecasting.
According to Fama’s Efficient Market Hypothesis (EMH), asset prices completely represent all available information at any given time in financial markets, which are said to be informationally efficient [
3]. This paradigm suggests that price changes follow a “random walk”, which implies that utilising historical data to predict future prices is virtually futile. The market’s capacity to swiftly respond to new data negates any advantage obtained from analysing previous patterns since new information is absorbed into pricing fast and unpredictably. The EMH would posit for this study that using historical data to predict future stock prices with advanced algorithms such as Support Vector Regression (SVR), Recurrent Neural Networks (RNN), or Long Short-Term Memory (LSTM) would ultimately be unsuccessful. This theoretical stance poses significant challenges for time-series forecasting in financial markets. However, the aim of this study was not to challenge the validity of EMH but rather to examine how these artificial intelligence models perform in real-world scenarios, particularly in the context of recent financial theories such as the Adaptive Markets Hypothesis. The conventional theory of markets as perfectly efficient is challenged by Andrew Lo’s Adaptive Markets Hypothesis (AMH), which presents a more dynamic viewpoint in which market efficiency fluctuates over time [
4]. AMH claims that rather than being constantly totally efficient, markets adjust and evolve as a result of investors’ reactions to the assimilation of new information. This could be perceived as a blend of principles from classical economics (recognition of market efficiency most of the time) and behavioural finance that recognise the irrational acts of humans. This framework recognises the possibility of using historical patterns, such as trends and anomalies, for short periods of time, especially when there are market inefficiencies. AMH suggests that market participant’s behaviour can change depending on a variety of circumstances, including experience, the state of the market, and the availability of information. Therefore, machine learning approaches such as SVR, RNN, or LSTM that are included in price prediction models may be able to capture these inefficiencies at certain times. As a result, AMH offers a theoretical justification for this study methodology. This implies that, while financial markets are generally efficient, there are instances in which prediction models outperform others, most especially during market transitions or when specific market inefficiencies emerge. This is essential for understanding why artificial intelligence models succeed in forecasting prices under certain conditions, such as volatile markets or during periods of economic uncertainty as seen in this study. The behaviour of market participants deviates from rational expectations, which creates opportunities for artificial intelligence algorithms to capture patterns that would otherwise be hidden in more stable, efficient markets. The outperformance of LSTM, compared to SVR and RNN, in its ability to capture long-term dependencies and market complexities may be particularly useful during periods of market adaptation. This superior performance of LSTM suggests that the model is more adept at identifying and leveraging market inefficiencies, especially when compared to SVR or RNN, which may not handle temporal dependencies or complex patterns as effectively. The positioning of this study within the AMH framework shows the relevance and applicability of these models in real-world financial forecasting.
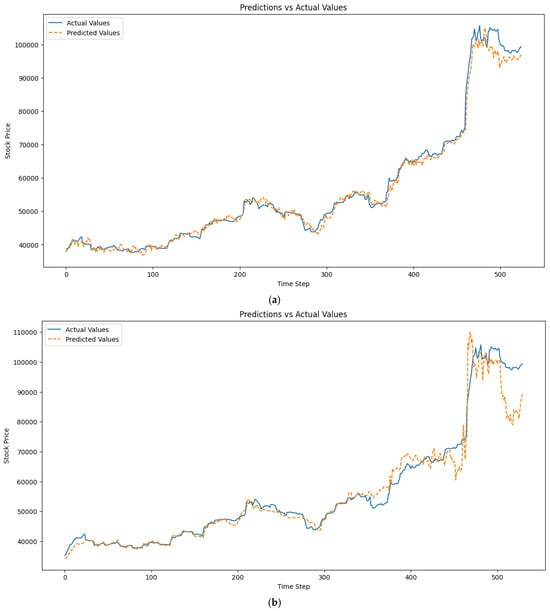
In this research, we used the NGX dataset, which contains historical price data along with technical indicators such as moving averages and On-Balance Volume. These indicators are essential in understanding market behaviour and enhancing predictive accuracy. Additionally, the performance of these models was evaluated using a variety of error metrics, including Mean Absolute Error (MAE), Mean Squared Error (MSE), Root Mean Squared Error (RMSE), Mean Percentage Error (MPE), and R-squared. Among these, R-squared is a crucial metric as it measures how well a model explains the variance in the data, providing an overall indication of each model’s performance. In this study, we employed Optuna, an optimisation framework, to fine-tune the hyperparameters of the models for better accuracy. The training process involved time-series cross-validation, which ensures that models are trained and tested on temporally consistent data. This respects the chronological order of the data and prevents data leakage between training and testing sets. Python and its libraries were used for implementing and training the models. This provided flexibility and efficiency in managing the computational requirements. The results reveal that LSTM outperforms SVR and RNN in both 30-day and 60-day time windows, particularly when exogenous factors such as On-Balance Volume are included. The 60-day LSTM model achieved the best R-squared value of 0.993, indicating its superior ability to predict future stock prices. Despite RNN’s good performance, the vanishing gradient issue limited its effectiveness for longer time windows. SVR delivers good results for smaller datasets but showed sudden drops in performance in the second fold during cross-validation. This highlights SVR’s limitation in handling larger and more complex datasets.
1.2. Significance of the Study
The practical significance of this study is evident in its
- –
Improved Financial Forecasting: This study’s identification of LSTM as the most effective model for the time-series forecasting of stock prices enables traders and investors to make more informed decisions about buying or selling stocks, and other financial assets.
- –
Enhanced Algorithmic Trading Strategies: The findings support the use of LSTM models in algorithmic trading, where predictive models are used to automate trades based on real-time data. This can lead to more profitable trading strategies, allowing algorithms to respond to market movements faster and more accurately.
- –
Risk Management and Financial Planning: This study contributes to better risk management as financial institutions can use the findings to develop more accurate models that anticipate market downturns or periods of high volatility.
- –
Application of Technical Indicators: The incorporation of technical indicators such as On-Balance Volume (OBV) in machine learning models provides traders and analysts with a competitive edge in identifying market opportunities.
- –
Supporting Quantitative Finance and Machine Learning in Finance: The findings of this study provide a valuable benchmark for model selection in financial forecasting and have practical significance for quantitative finance professionals who develop machine learning models to predict market trends.
- –
Educational Value for Financial Data Science: This research provides a clear and practical example of how machine learning models can be applied to real-world financial data and offers educational value for students, researchers, and professionals learning about financial data science and its practical applications. It also contributes to the growing body of knowledge on applying machine learning to financial markets, thereby providing a case study that can be expanded upon by future researchers or practitioners.
This could lead to better tools and methods for predictive analytics in financial institutions, improving the overall accuracy of forecasting systems used in asset management, risk assessment, and trading.
Risk management and quantitative finance. By demonstrating the effectiveness of LSTM models and optimising predictive models with technical indicators and hyperparameter tuning, this research equips financial professionals with tools to improve their forecasting accuracy, automate trading strategies, and manage risk more effectively. These insights are highly valuable to both academic researchers and industry practitioners, offering real-life benefits in the field of finance.
To provide a clearer understanding of the current research and position of this study within the academic field, a detailed Literature Review Table (
Table 1) was created. This table presents the various data analysis techniques previously used in stock price prediction research, highlighting their pros and cons. Furthermore, the performance of the three models will be compared with these established methods, showing their ability to capture market trends effectively and improve prediction accuracy.
Several studies have compared the effectiveness of SVR, RNN, and LSTM for time-series forecasting. The authors in [
5] investigated the application of Long Short-Term Memory (LSTM) and Support Vector Regression (SVR) models in time-series forecasting. Their study focused on comparing the effectiveness of both models, using error metrics such as MSE, RMSE, and MAE. They found that the LSTM model consistently outperformed SVR with lower error rates, making it more suitable for capturing complex patterns in stock data [
2]. The study was limited by its scope, comparing only two models without including RNN. However, the findings were significant in highlighting LSTM’s strength in handling time-series forecasting when dealing with large datasets. Zulfike, MS et al., extended this comparison to include Vector Autoregression (VAR) in predicting stock prices but did not include RNN and technical indicators such as moving averages or volatility measures as model input features, which are key variables in our study. By comparing these models, they found that LSTM achieved better prediction accuracy and a higher R-squared score than SVR. However, the study primarily relied on statistical models such as VAR, which are based on linear assumptions, and limited the assessment of advanced AI models that could better capture non-linear relationships. Our study addresses this by including a wider range of variables as model input features and showing that LSTM performs better in capturing non-linear relationships in stock data than SVR and VAR. Lakshminarayanan, JP et al. [
6] conducted a comparative study between Support Vector Machine (SVM) and LSTM models for stock price prediction. They demonstrated that LSTM consistently outperformed SVM in terms of the Mean Absolute Percentage Error (MAPE) and R-squared scores and in handling continuous prediction tasks better than SVM. However, their work did not include technical indicators as variables, which our study does, further supporting LSTM’s advantages in stock forecasting. Pashankar, SS. et al. [
7] focused on evaluating the effectiveness of linear regression, Random Forest, and Support Vector Regression (SVR) for predicting stock prices. While their findings indicated that SVR performed well for short-term predictions, SVR struggled with long-term dependencies. Our research builds on this by demonstrating that LSTM achieves better long-term prediction accuracy, especially with larger datasets and more complex technical indicators. Chhajer P, et al. [
8] explored LSTM, ARIMA, SVR, and GRU models. The study revealed that LSTM significantly outperformed ARIMA, GRU, and SVR in long-term predictions. However, the research was limited by its focus on long-term trends, with ARIMA struggling to manage non-linear tasks [
9]. Our study proved the effectiveness of LSTM superiority by capturing both long-term trends and non-linear relationships, outperforming other models in these aspects.
There is evidence of a gap in the literature regarding the superiority of the approach, particularly when considering the variables used in this study. While previous studies have compared SVR and LSTM, there is still a gap when it comes to the inclusion of multiple technical indicators as model input features, as used in this study, especially when comparing these models on non-linear, complex financial data. LSTM’s advantage over both SVR and RNN should be emphasised in handling large datasets with long-term dependencies. Many studies have highlighted RNN’s ability to handle sequential data better than SVR, but RNN still falls short compared to LSTM. This is because RNN struggles with long-term dependencies, while LSTM, with its internal gating mechanisms, can manage long-term temporal dependencies far more effectively. Furthermore, no study has thoroughly examined the use of LSTM, RNN, and SVR combined with historical price data, return, price, and volume technical indicators as input features, which makes this study a novel contribution to the field.
Source link
Olamilekan Shobayo www.mdpi.com