2.7.2. Part 2
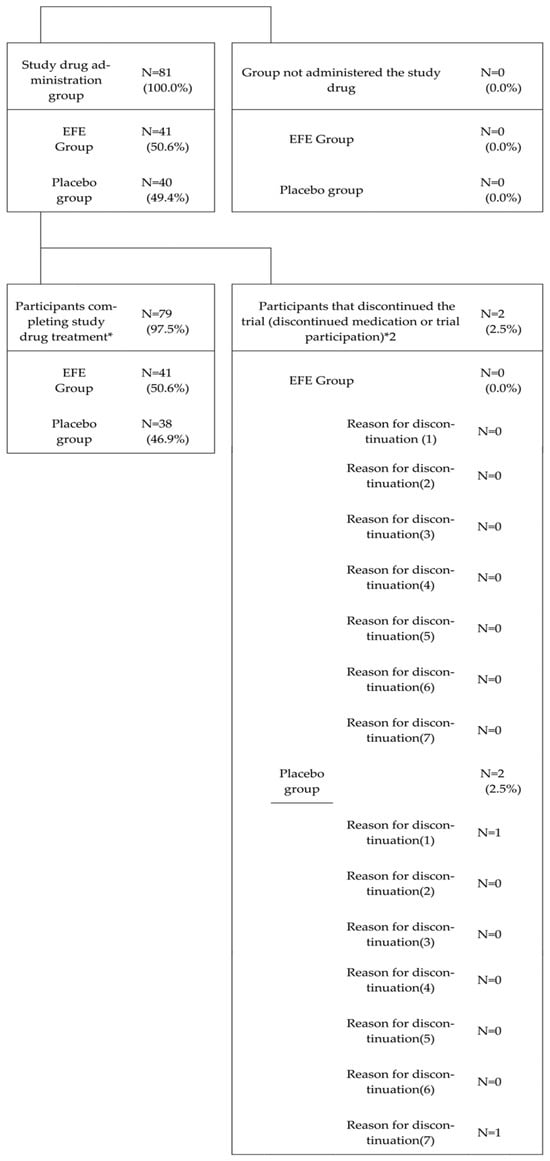
For safety analysis, we considered the population of patients who received the study drug at least once and were observed during the study.
Regarding the primary efficacy endpoint analysis, we evaluated the number and proportion of patients who did not progress to severe illness by Day 15 (non-aggravation rate) and their 95% CIs within each treatment group using the mITT population. We performed between-group comparisons of the non-aggravation rates using the chi-square test. The same analyses were conducted for the PPS population.
Regarding the frequency of use of symptomatic relief medication, the number of patients who used symptomatic relief medication during the trial, their proportions, and the 95% CIs were calculated for each treatment group, with between-group comparisons using a chi-squared test. Furthermore, the summary statistics of the total number of uses of symptomatic relief medication during the trial period were calculated for each treatment group, with between-group comparisons analyzed using the Wilcoxon rank-sum test.
Regarding the number of days until the body temperature was below 37.0 °C for two consecutive times (defined as an “event”), between-group comparisons of the time until this event were performed using the Log-rank test. Additionally, using the Kaplan–Meier method, the cumulative incidence rates of events at each time point along with their 95% CIs were calculated for each group. Kaplan–Meier plots of the cumulative incidence rates were also generated for each group.
Regarding the improvement in FS score related to symptoms/pain symptoms, the summary statistics of FS observed daily from Day 1 to Day 15 were calculated for each group. At each time point, the summary statistics of the change in the FS score from Day 1 were also calculated for each group. Between-group comparisons were conducted using the Wilcoxon rank-sum test. For the number of days until the FS score for symptoms/pain symptoms improved to 0 or 1, each symptom/pain symptom was considered an “event” when the FS score reached 0 or 1. The time until this event was confirmed, with between-group comparisons using the Log-rank test. Furthermore, using the Kaplan–Meier method, the cumulative incidence rates of events at each time point and their 95% CIs were calculated for each group. Kaplan–Meier plots of the cumulative incidence rates were also generated.
For the non-aggravation rate by Day 21, the number of patients who did not show severe progression by Day 21, their proportions (non-aggravation rate), and 95% CIs were calculated for each treatment group. These non-aggravation rates were compared between the treatment groups using a chi-squared test.
Regarding the proportion of patients who did not develop severe symptoms by Day 15 and Day 21, the number of patients who remained non-severe by each observation day, their proportions, and 95% CIs were calculated for each treatment group. Between-group comparisons of these proportions were performed using a chi-squared test.
For the disease status score based on the six-point ordinal scale at Day 7, Day 15/at discontinuation, and Day 21/1 week post-discontinuation, the number of patients and their proportions for each severity score at each time point were calculated for each treatment group. Group comparisons were conducted using the Wilcoxon rank-sum test. Additionally, analyses were performed when combining data from upon discontinuation and Day 15, as well as when combining data from 1-week post-discontinuation and Day 21.
During efficacy analysis, if concomitant prohibited medications were used during the trial period, efficacy assessment data measured after the start date of concomitant use were not included in the analysis.
For adverse events and side effects, the number of occurrences, the number of cases, the incidence rate, and their 95% CIs were calculated. The Clopper–Pearson method was used to calculate the CIs. Similar analyses were conducted based on the severity and seriousness of the events. For clinical laboratory results and vital signs, the summary statistics of the measurements were calculated for each time point. Additionally, the summary statistics of the changes from baseline were calculated for each time point after the start of administration.
When testing, the significance level is set at 5% two-sided.
Source link
Hiroshi Odaguchi www.mdpi.com