1. Introduction
α-Tocopherol and other vitamin E vitamers containing a chromanol ring structure with a saturated or unsaturated side chain are lipid-soluble antioxidants that prevent the oxidation of unsaturated fatty acids by reactive oxygen species (ROS) [
1].
In the last decade, research on vitamin E metabolism fostered the understanding of molecular structures and biological functions of its metabolites. Besides the urinary metabolite α-carboxy-ethyl-hydroxychromanol (α-CEHC) that has been suggested as a marker of an adequate vitamin E uptake [
2], long-chain metabolites (LCMs) of α-tocopherol, 13′-hydroxy- and 13′-carboxychromanol (α-13′-OH and α-13′-COOH), have been detected in human feces and human plasma at nanomolar concentrations [
3,
4,
5,
6,
7,
8]. LCMs have shown anti-inflammatory, anti-proliferative, and lipid regulatory properties [
3,
5,
9]. Furthermore, long-chain metabolites were found to induce accelerated wound healing and diminish inflammation in a mouse model of atopic dermatitis [
10,
11]. As a possible target in the inflammatory network, Pein et al. found the α-tocopherol metabolite α-13′-COOH a highly effective endogenous inhibitor of 5-lipoxygenase (5-LO) [
12]. The concentration of LCMs seems dependent on the circulating amount of tocopherol in the plasma. A supplementation of 800 IU/d
RRR-α-tocopherol for 1 week resulted in a 10–15-fold increase in LCMs [
8].
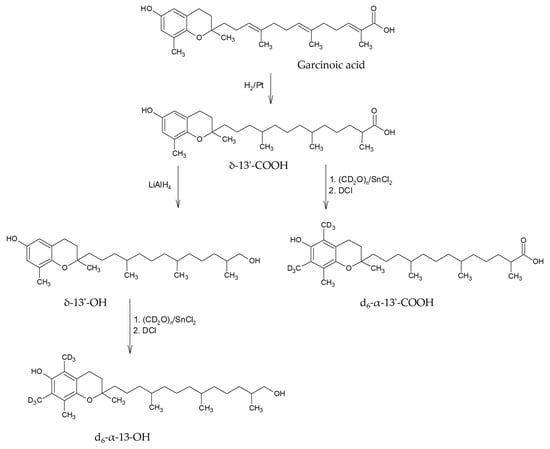
Vitamin E metabolite research has been accelerated by the ease of metabolite synthesis based on the isolation of garcinoic acid from the African bitter nut
Garcinia cola. A simple, three-step synthesis starting from garcinoic acid (δ-13′-COOH-tocotrienolic acid) resulted in reasonable yields of α-13′-hydroxychromanol (α-13′-OH) and α-13′-carboxychromanol (α-13′-COOH), respectively. As a result, partially deuterated metabolites were synthesized to serve as internal isotope labeled standards (ILSs) in LC-MS-based isotope dilution analyses [
6]. Today, most of the recent studies have used UHPLC-MS/MS or -HRMS-based detection methods for the determination of serum metabolites. Zhao et al. used LC-ESI-MS analyses for the detection of vitamin E metabolites in mouse and human urine and plasma, respectively. In the past, pre-analytics consisted of enzymatic degradation of phase II conjugates by glucuronidase and sulfatase followed by a liquid–liquid extraction either by ethyl acetate or a mixture of hexane/tert-butylmethylether. Since the serum and plasma concentration of α-tocopherol and its metabolites vary between two to three orders of magnitude (µM vs. nM), chromatographic conditions and MS-detection setups were conducted in laborious separate workflows [
6,
7,
8]. Here, we present a stable isotope dilution method using deuterated α-tocopherol and deuterated long-chain metabolites for the simultaneous detection and quantification via LC-MS/MS. A new solid-phase extraction procedure was applied to reduce background signals and improve sensitivity. Using a pentafluorophenyl(PF-5)-based core-shell chromatographic column, we were able to separate and quantify LCMs 13′-COOH, 13′-OH and tocopherol within the same run.
3. Discussion
The present work describes a new method for the simultaneous analysis of α-tocopherol and its metabolites, namely α-13′COOH and α-13′-OH using stable isotope-labeled internal standards. The focus is on the synthesis, characterization and suitability of stable isotope-labeled standards. Previous studies on the analysis of vitamin E metabolites using LC-MS-based methods determine tocopherol and the metabolites in separate workflows. To the best of our knowledge, this is the first time that we have demonstrated a method to quantify the metabolites in the trace range (nmol/L) and simultaneously α-TOH in the µmol/L range.
The simple synthesis and availability of deuterated α-tocopherol and its metabolites, d6-α-13′-COOH and d6-α-13′-OH, is a crucial step to ensure accurate quantification. The use of garcinoic acid as a precursor for the synthesis of δ-13′-COOH and δ-13′-OH metabolites and the use of δ-TOH as a precursor of deuterated α-TOH represents a straightforward approach to generate these standards. However, the different yields of the synthesized compounds underline the need for optimization of the synthesis procedures.
Another feature of the method presented here is the sample preparation by solid phase extraction (SPE) instead of conventional liquid–liquid extraction methods. After enzymatic digestion of the sample using sulphatase and β-glucuronidase, phase II-conjugated metabolites are cleaved, released and added directly to a HybridSPE
® column. The use of HybridSPE
® offers two major advantages over liquid–liquid extraction. Firstly, proteins can be precipitated directly onto the solid phase column (not applied in this study) and through the interaction with the zirconium-coated silica material, phospholipids are retained, resulting in an improved background signal. The workload is optimized, and the samples can be concentrated before analysis. The use of a pentafluorophenyl-based core-shell chromatography column has proven successful for the separation of tocopherols, and we were able to show that the metabolites could also be baseline-separated and measured at acceptable times [
15].
The deuterated standards show almost identical retention times to the analytes. This property characterizes a good ILS. In addition, there should be no isobaric overlaps in the mass spectra of analytes and ILS. Due to a mass difference of ∆
m/
z = 6, this could be guaranteed by our labeled standards. It has been shown that isotopically labeled standards are particularly well suited for UHPLC-MS/MS measurements when high-resolution mass spectrometers are not available [
16].
The concentration of α-TOH in human plasma typically ranges between 12 and 30 µmol/L and, thus, is about three magnitudes higher than that of the metabolites, which are in the nmol/L range. This fact leads to an analytical dilemma, as the concentration of the SPE can enrich the metabolites of the tocopherols but at the same time lead to a concentration of the tocopherol. This causes a saturation of the α-TOH signal at the detector, which can result in an underestimation of the α-TOH concentration. For this reason, α-TOH and its metabolites were quantified separately in the past, which prolonged the workflow [
6,
7,
8].
Quantification by MS
2 or MS
3 transition signals also failed since the signals are subject to strong fluctuations due to matrix effects and ion suppression [
17,
18,
19]. In this study, we were able to show that by using d
6-α-TOH, fluctuations due to matrix effects or ion suppression in the MS
3 transitions could be almost eliminated [
13]. This study demonstrates the ability of the LC-MS/MS system to accurately differentiate and quantify these compounds within a single chromatographic run, which is critical for comprehensive metabolic profiling and could significantly reduce the workload for studies with larger numbers of subjects.
The introduction of a stable isotope dilution method using these deuterated standards in LC-MS/MS analyses represents a sophisticated strategy to achieve high accuracy and precision in the quantification of α-tocopherol and its metabolites in human serum. The calibration curves, recovery rates, limits of detection (LOD) and limits of quantification (LOQ) determined with this method correspond to those found in the literature [
6,
7,
8].
Table 2 summarizes the concentration values of the metabolites from human serum and the validation parameters from previous studies. In the context of measurement accuracy, we found similar values for α-13′-COOH and α-TOH but not for α-13′-OH. The values determined for the hydroxy-metabolite are 5–7 higher than those found by Giusepponi et al. [
6]. One explanation for this difference is the carrier effect of stable isotope standards, which allow a higher recovery of analytes [
19]. In contrast to the study by Giusepponi et al., we were able to use a deuterium-labeled α-13′-OH standard, which explains the carrier effect and, thus, the higher amounts of the analyte.
Several studies report isomeric forms of α-13′-COOH (namely M1, M2) and α-13′-OH (M3), which differ only by a shift in retention time but not in the mass spectra [
6,
7,
8]. Interestingly, M1 exceeds the amount of 13′-COOH by 10-fold. The nature of the metabolites M1-M3 is unknown so far and needs to be structurally elucidated in the future. Speculating on the nature of these metabolites leads to structural isomers in which the functional groups -COOH or -OH are not located at position 13′ but within the side chain. As an example, hydroxylated metabolites (12′-OH and 11′-OH) were found in the feces of mice [
20], and sargachromenols, a class of meroditerpenes from brown algae, are carboxylated at position 15′ [
21]. These isomeric compounds would give the same mass spectra but differ in retention times. In the present study, we could not find these isomeric forms of the metabolites. We assume that the hypothetical structural isomers that could be separated by the C18 column used in the studies by the group of Galli et al. are not separated on our PF-5 Phase. In the direct study comparison, the plasma values of the metabolites are given as sum parameters (α-13′-COOH + M1 + M2 or α-13′-OH + M3) (see
Table 2). We found a reduced amount of α-13′-COOH for the endogenous and the supplemented plasma samples. Only 25% of α-13′-COOH from the endogenous plasma and 67% of α-13′-COOH from supplemented plasma could be found. A reduced recovery rate or prolonged storage time (2017 vs. 2021 at −80 °C) could be a reason for the reduced values. However, our data are in good agreement with the plasma α-TOH values from the study by Giusepponi et al. [
6].
4. Materials and Methods
4.1. Chemicals and Reagents
All chemicals were used as received from the supplier. Lyophilized β-glucuronidase (
Escherichia coli Typ IX-A, 1–5 Mio. units/g), sulfatase (
Helix Pomatia Typ H-1, ≥10.000 units/g), SnCl2, DCl (35 wt.% in D
2O, ≥99 Atom% D), paraformaldehyde-d
2 (98 Atom% D), (+)-δ-Tocopherol (~90%), formic acid (FA) (MS grade), and HybridSPE-Phospholipid Ultra Cartridges (bed wt. 30 mg, volume 1 mL) were received from Sigma Aldrich, Taufkirchen, Germany. LC-MS-grade water and acetonitrile (both LiChrosolv), ascorbic acid (AA), and
all-rac-α-tocopherol (95%) were obtained from Merck KGaA, Darmstadt, Germany, methanol (HiPerSolv) was obtained from VWR Chemicals, Darmstadt, Germany, and deuteriumoxide (≥99.8 Atom% D) was obtained from Carl Roth, Karlsruhe, Germany. Isolation and purification of garcinoic acid (GA) and synthesis of δ-13′-COOH and δ-13′-OH were performed as described earlier [
22,
23].
4.2. Synthesis and Purification of Deuterated Standards
Deuteromethylation of δ-tocopherol, δ-13′-COOH and δ-13′-OH was done according to known literature procedures [
23,
24]. In brief, δ-tocopherol was treated with deutero-paraformaldehyde (CD
2O)
n and SnCl
2 and quenched with DCl/D
2O to yield d
6-α-TOH. After purification on silica gel with hexane/ethyl acetate (5:1
v/
v), we obtained d
6-α-TOH in 36% yield and 99.0% purity. D
6-α-13′-COOH (d
6-α-13′-carboxychromanol,(13-((2R)-6-hydroxy-2,5,7,8-tetramethylchroman-2-yl)-2,6,10-tri-methyltridecanoic acid) and d
6-α-13′-OH (d
6-α-13′-hydroxychromanol, (13-((2R)-6-hydroxy-2,5,7,8-tetramethylchroman-2-yl)-2,6,10-trimethyltridecanol) were prepared in the same manner from δ-13′-COOH and δ-13′-OH, respectively. After purification on silica gel with hexane/ethyl acetate (3:1
v/
v), we obtained d
6-α-13′-COOH in 48% yield and 95.9% purity and d
6-α-13′-OH in 8% yield and 99.8% purity. The synthesized standards were assessed for their purity using LC-MS, with particular focus on the purity concerning foreign substances, such as the used starting materials and purification impurities, as well as the absence of the corresponding non-labeled compounds (see
Figures S1–S3 in
Supplementary Material). This ensured that the labeled standard substances were present exclusively in the desired isotopic composition.
4.3. Quantification of Stable Isotope Labeled Standard Stock Solutions
Calibration curves of unlabeled standards of α-TOH, α-13′-COOH, and α-13′-OH were used to determine the concentration of ILS stock solutions. All quantifications were performed with HPLC-FD at λEx = 296 nm and λEm = 325 nm. The concentration of the stock solutions of d6-α-TOH, d6-α-13′-COOH, and d6-α-13′-OH were 36.42 mg/L, 57.83 mg/L, and 54.07 mg/L, respectively. Aliquots at 1 mg/L in 70% methanol (MeOH/H2O 70/30 (v/v), 1 mg/mL AA and 0.1% FA) were stored under argon at −20 °C.
4.4. Plasma Sample Preparation and Isotope Dilution Method
Blood sampling and supplementation have been described in detail [
6]. In fact, we used the exact same blood samples of subject 1 in the study of Giuseppino et al. In brief, the volunteer was supplemented with 1000 IU RRR-α-TOH per day for one week using a soft gel capsule formulation of 671 mg RRR-α-TOH in soy oil and sorbitol (Optovits, Hermes Arzneimittel, Germany). Blood sampling was carried out on fasted volunteers. Samples were prepared using serum Monovettes (Sarstedt, Nümbrecht, Germany) by centrifugation (2000×
g) of blood for 10 min at 20 °C. Samples were then maintained at −80 °C until analysis. The study was approved by the local Ethics committee, “Comitato Universitario di Bioetica dell’Università degli Studi di Perugia” (prot.N.2015-008).
A total of 700 µL of serum was used to determine α-TOH and its long-chain metabolite concentration in triplicate. The sample was treated with 42 µL of ascorbic acid (250 mg/mL) and spiked with 175 µL of a stock solution of three internal standards (ILSs) containing 2 µmol/L d6-α-13′COOH and d6-α-13′OH, respectively, and 46 µmol/L d6-α-TOH. A total of 262 µL of the sample mixture were transferred in a 2 mL tube and incubated with 200 µL of a mixture of sulfatase (50 U/mL) and β-glucuronidase (5.100 U/mL) in ammonia bicarbonate (5 mM, pH 6.8) for 2 h at 37 °C. After enzymatic hydrolysis, 1390 µL of acetonitrile (1% formic acid) was added to precipitate the protein, vortexed and centrifuged (5 min, 13,200 rpm, 20 °C). The supernatant was applied directly onto a HybridSPE® column that has been pre-conditioned with acetonitrile and 1% formic acid (FA). The eluted solution was evaporated via SpeedVac at 45 °C, and the residue dissolved in 200 µL 70% methanol (MeOH/H2O 70/30 (v/v), 1 mg/mL AA and 0.1% FA). The quantification (via LC-MS/MS) was achieved using calibration curves of both LCMs from 0.1 to 35 µg/L and 0.1 to 35 mg/L α-TOH prepared in the same solvent.
4.5. Liquid Chromatography with Fluorescence Detection
The chromatography (LC-4000-System, FD (FP-1520), JASCO, Pfungstadt, Germany) utilized a Kinetex F5 column (2.1 × 100 mm, 2.6 μm, 100 Å) (Phenomenex, Aschaffenburg, Germany) connected to a SecurityGuard ULTRA cartridge (Phenomenex). The solvent system consisted of methanol/formic acid (1000:1 v/v, A) and H2O/formic acid (1000:1 v/v, B). The separation was performed with a multi-step gradient scheme as follows: 0 min, 70% B; 3 min, 70% B; 4 min, 80% B; 10 min, 80% B; 12 min, 90% B; 18 min, 90% B; 18.5 min, 90% B (flow rate 0.25 mL/min) and monitored by fluorescence detection at λEx = 296 nm and λEm = 325 nm. The column oven temperature was set to 45 °C.
4.6. Liquid Chromatography with Mass Spectroscopy
The LC-MS/MS system consisted of a Dionex UltiMate 3000 UHPLC system equipped with a Kinetex F5 column, coupled to a Bruker AmaZon SL ion trap mass spectrometer with an electrospray ionization (ESI) source (Bruker, Karlsruhe, Germany). For the LC-MS method, a different column format with a smaller particle size of 1.7 µm (2.1 × 100 mm, 1.7 µm, 100 Å) (Phenomenex, Aschaffenburg, Germany) was used. The same LC solvent system was used as described above. Precursor ions were analyzed using base peak monitoring in positive polarity ESI mode (dry gas temperature: 280 °C, flow rate: 8.0 L/min; nebulizer pressure: 2.8 bar; capillary voltage: 4100 V; end plate offset: 500 V) with Bruker Compass Data Analysis software version 4.2. To enhance ionization efficiency, a flow-splitter was employed to reduce the flow rate into the mass spectrometer to 100 µL/min. To further increase sensitivity and improve peak definition, the smartMRM acquisition mode was employed for MSn measurements.
4.7. Method Validation
In general, multiple reaction monitoring (MRM) transitions (quantifiers) were used for the acquisition of response linearities to establish the limit of detection (LOD), the limit of quantification (LOQ), and the recovery rate of the metabolites (
Table 1). The retention time and the relative ion ratio (qualifiers) were used to identify the metabolites. LOD and LOQ were estimated both by evaluating the signal-to-noise ratio (S/N) of the peaks in the chromatograms of real samples and by calculating from standards curves (instrumental LOD/LOQ) according to Giusepponi et al. [
6]. Response linearity was investigated by injecting standard solutions in methanol/water 75/25
v/v in an equidistance concentration range of 2.17–54 nmol/L for both long-chain metabolites and 2.32–58 µmol/L for α-TOH. Since no certified reference materials are commercially available, the accuracy and relative recovery, respectively, were determined based on the added labeled standards. The accuracy of the method was calculated from the day-to-day precision data. The mean relative recoveries are given after subtraction of any blank values.