1. Introduction
Visible light communication (VLC) is a wireless method for transmitting data via the modulation of visible light intensity. VLC offers several advantages over traditional radio frequency (RF) wireless technologies [
1]. One of its primary benefits is the substantial bandwidth available within the visible portion of the electromagnetic spectrum. VLC is also a cost-effective wireless solution for two main reasons: first, the electronic components utilized for VLC are simpler and less expensive compared to the specialized circuits required for RF modulation’ second, VLC can be implemented using commercial light-emitting diodes (LEDs) already deployed in lighting systems, obviating the need to develop new optical antenna devices. Additionally, VLC is immune to electromagnetic interference (EMI), as the visible spectrum is not impacted by such interference. Therefore, VLC can be effectively utilized in environments such as hospitals, where where RF technologies are restricted due to the potential for EMI to interfere with and disrupt monitoring instruments. The IEEE 802.15.7 standard [
2] was introduced with the objective of standardizing the various schemes for communication with visible light and defining the modulation techniques. This standard presents three IM/DD modulation schemes: on–off keying (OOK), variable pulse position modulation (VPPM), and color shift keying (CSK). It should be noted that there are other techniques not presented in this document, including metameric modulation and orthogonal frequency division multiplexing (OFDM).
CSK employs three or more distinct wavelengths for data transmission, effectively leveraging spectral diversity to encode information. This modulation technique utilizes WDM alongside a constellation of symbols to represent bits of information [
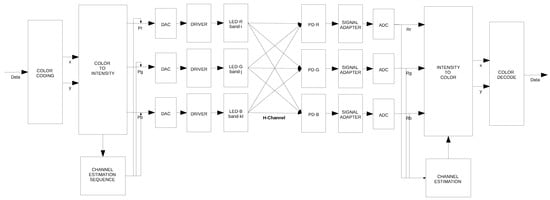
3]. The block diagram in
Figure 1 illustrates a CSK modulator based on three LEDs and three photodetectors. The digital-to-analog converter (DAC), driver, and LEDs constitute the analog front-end on the transmitter side, while the photodetectors (PD), signal adapter, and analog-to-digital converter (ADC) form the analog front-end on the receiver side. Additionally, the color coding, color-to-intensity conversion, and channel estimation sequence represent the logical components required to implement the CSK modulation scheme. The channel depicted in this diagram highlights the potential interference that may arise among the three color bands.
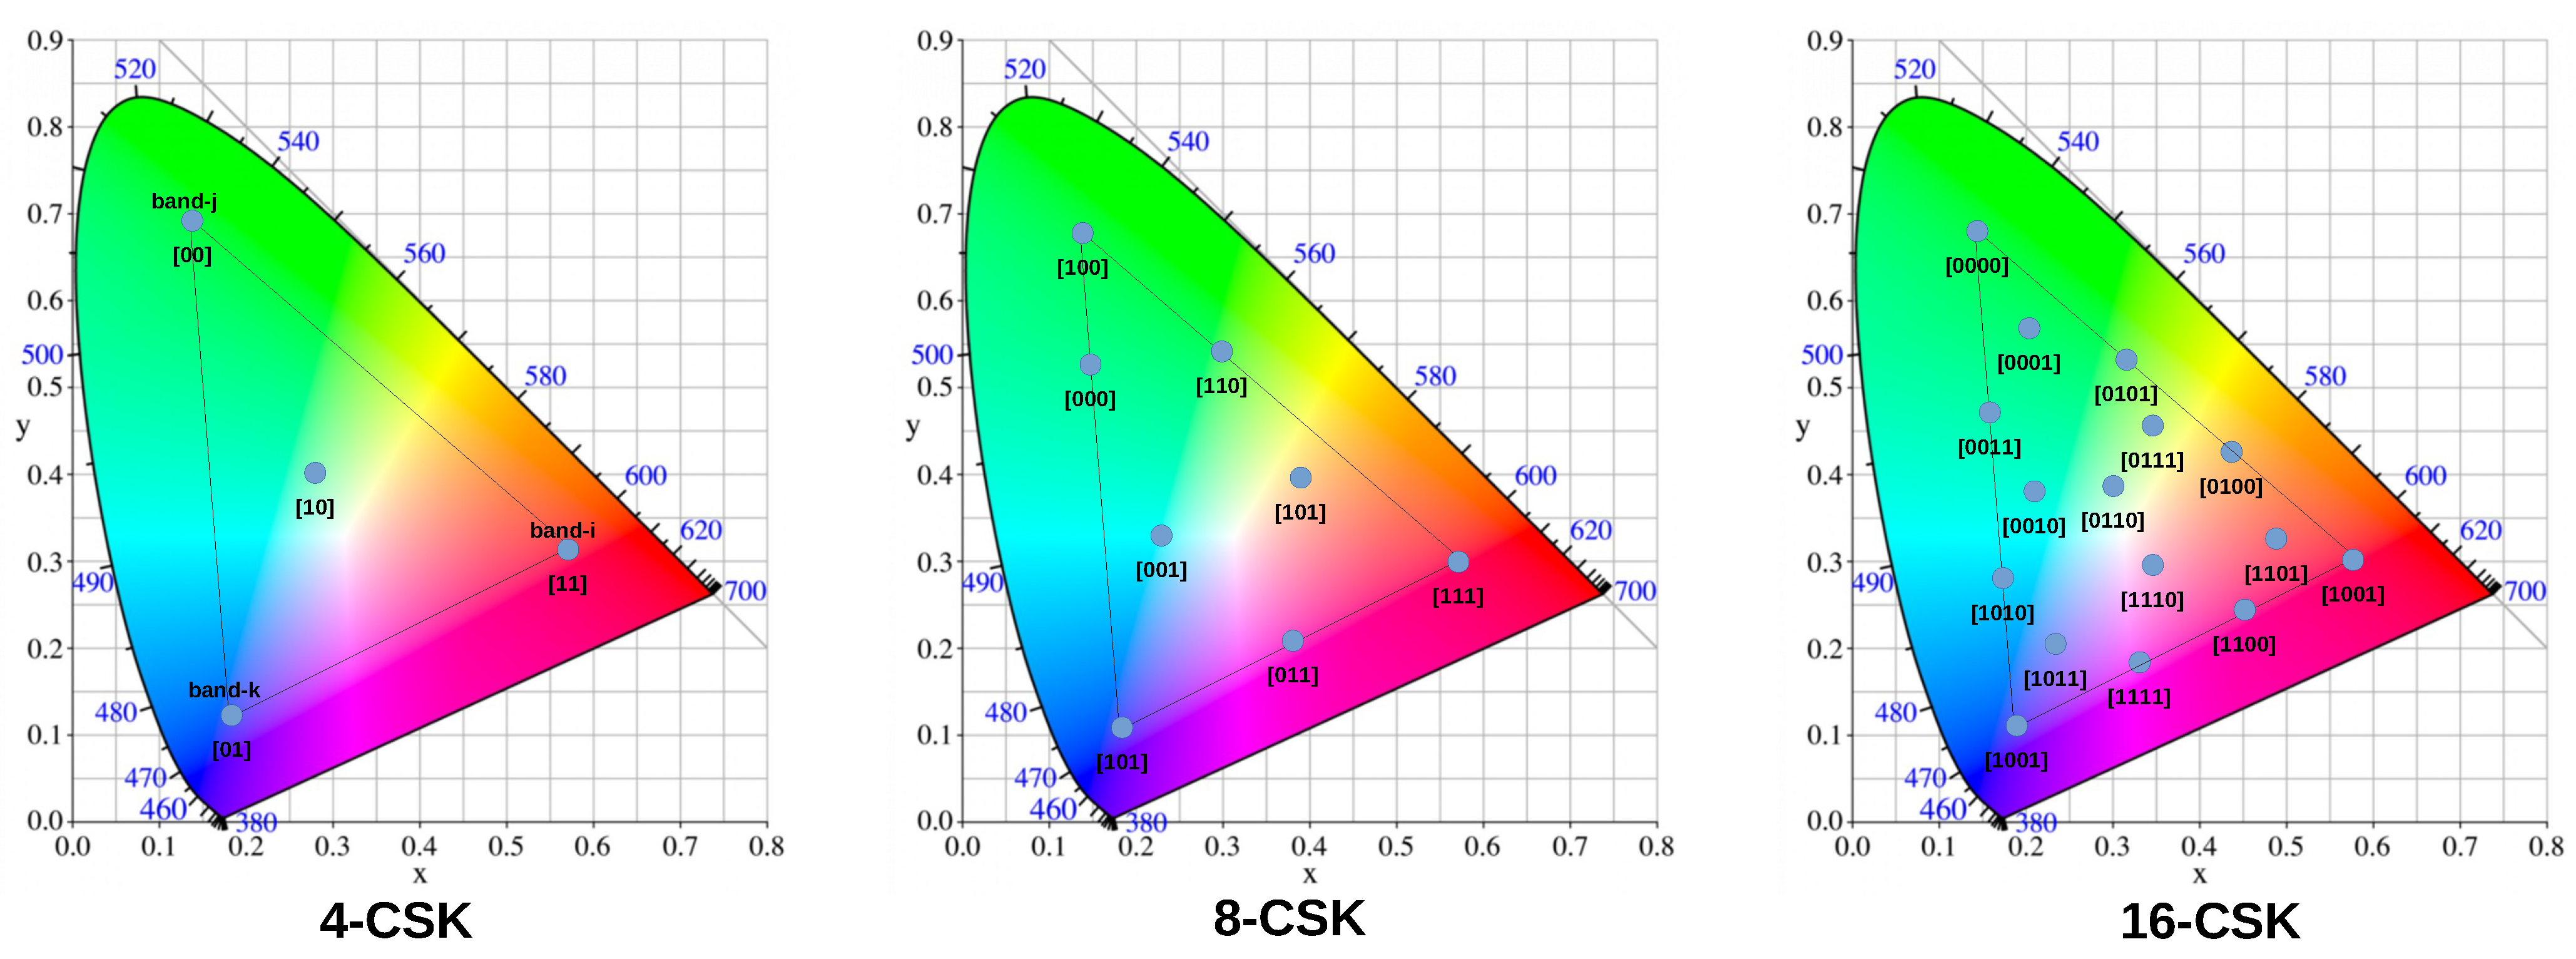
The modulation process of CSK is carried out as follows. First, a bit stream at the input of the color coding block is mapped to a specific point in the CIE 1931 color space. In the CIE 1931 color space, a set of points represents symbols of the constellation, such as M -QAM or M-PSK. Each color point represents a combination of bits. This means that it is necessary to use four symbols to encode two bits for each symbol, eight symbols to encode three bits, sixteen symbols to encode four bits, and so on.
Figure 2 shows the CSK format for 4, 8, and 16 color points and their corresponding mapping rules according to the IEEE 802.15.7 standard [
2]. As shown in the 4-CSK mapping image, the vertices of the triangle are the intrinsic color points of each band, that is, the intrinsic color point of each RGB-LED. The output of the color coding is the
coordinate of the corresponding color that is mapped, which forms the input for the color-to-intensity coder block. Because the color point must be generated with a specific combination of the three
-bands, this block encodes each
value to the corresponding
values, where
represents the optical power of band i (red LED) to generate the
d-color point,
represents the optical power of band j (green LED), and
represents the optical power of band k (blue LED). The relationship between the color coordinates and optical power values is expressed as follows:
where are the intrinsic color coordinates of band i, are the intrinsic color coordinates of band j and are the intrinsic color coordinates of band k. Based on this linear relation, the color-to-intensity encoder computes the optical power in each band to generate a specific color by including a constraint of constant total optical power, which can be expressed as
CSK is a promising modulation scheme within the realm of VLC, primarily due to its ability to enhance spectral efficiency by utilizing wavelength division multiplexing. This enables the transmission of more data within a given bandwidth, resulting in higher data rates, making CSK suitable for applications requiring substantial data throughput [
4]. Regarding lighting performance, one of its key strengths lies in its capacity to modulate information by varying the intensity of multiple colored LEDs, typically red, green, and blue, without altering the overall luminous flux. This ensures non-flickering light, providing a seamless user experience for illumination while facilitating efficient data transmission. A distinct feature of CSK is its ability to deliver tunable perceived color by modifying the constellation design, which allows for adjustment of the light’s color temperature to meet various aesthetic or functional requirements in indoor environments. This flexibility in color tuning makes CSK particularly well suited for smart indoor lighting systems, where both communication and lighting quality are paramount. Furthermore, CSK schemes can achieve a color rendering index (CRI) greater than 80 [
5], ensuring that the lighting accurately represents the colors of objects within the space. This is a critical factor in environments where high-quality lighting is essential, such as retail spaces, healthcare facilities, and art galleries.
Figure 1.
Functional block diagram of the CSK modulation format.
Figure 1.
Functional block diagram of the CSK modulation format.
Figure 2.
Color point mapping for 4-CSK, 8-CSK, and 16-CSK.
Figure 2.
Color point mapping for 4-CSK, 8-CSK, and 16-CSK.
For indoor VLC applications, the power received by the photodetector depends on both line-of-sight (LoS) and non-line-of-sight (NLoS) components. The spectral power distribution (SPD) of the NLoS component is modified according to the spectral reflectance of the objects and walls inside the indoor space. Due to the wide spectral emission of LEDs and the wide spectral response photodetectors, the power radiated by an LED at a central wavelength is detected by the photodetectors at different wavelengths. This effect is known as inter-channel interference, or cross-talk [
6]. According to [
2], the inter-channel interference in CSK can be modeled as a gain matrix, and determines the communication performance of the communication system; on the other hand, VLC systems for indoor applications must fulfill lighting quality requirements such as illumination level, color temperature, and color quality. These parameters also depend on the SPD of the light received from LoS and NLoS. Therefore, an adequate analytical estimation of cross-talk and lighting parameters for indoor CSK systems must consider both LoS and NLoS components.
Different channel models are widely used for indoor applications. More specialized channel models can compute the channel impulse response (CIR) function, which completely characterizes the channel performance. These models consider realistic geometries such as walls, objects, people, and furniture [
7,
8,
9,
10]. Simpler models only calculate some characteristics for empty rooms with rectangular, cylindrical, or spherical shapes [
11,
12,
13,
14,
15,
16]. Concerning the models used to study the CSK performance, several limitations of CSK channel models have been identified: (i) the models do not consider the spectral response of emitters, detectors, and walls when computing the received power; (ii) the models do not compute the photometric and colorimetric characteristics of the illumination; and (iii) there are no open-source computational tools to simulate these kinds of indoor WDM-VLC systems. To address these limitations, we implement a simple indoor channel model considering multi-wavelength propagation. This model was designed as a Python package and is available at PyPI. Using the recursive algorithm presented in [
17], the steady-state gain for each color channel and the normalized interference gain matrix were computed for a rectangular empty room. The same model was used to compute the illuminance, correlated color temperature, and color rendering index at the receiver position. The model includes a module for estimating the symbol error rate based on the interference gain matrix and the dark current of the photodetector.
The following section defines the model of the transmitter, receiver, and light propagation, while
Section 4 describes the implementation of the model in Python,
Section 5 presents the simulation results and model validation, and
Section 6 presents a discussion of the results.
2. Recursive Channel Model
The comprehension of the diverse behaviors of light is derived from two fundamental principles: the manner in which light waves propagate through space, and the manner in which these waves interact with matter [
18]. The geometric optic is a simplified model for the propagation of light. It is employed to describe the reflection and refraction of light by objects, mirrors, and lenses, assuming that the wavelength of light is much smaller than the scale of the objects with which light interacts. This model forms the foundation of the ray-tracing technique, which we employ to model indoor optical channels. The recursive channel model is founded upon the principles of geometric optics and offers a valuable methodology for simulating the propagation of light in indoor settings, including empty rectangular rooms. This method can help to simulate the effects of light transmission and reflection within the space, providing a framework for analyzing communication systems such as VLC.
The model presented in this work extends the original model introduced in [
17], incorporating several key features essential for the analysis of CSK modulation. First, it estimates the power received by the detector across multiple central wavelengths. Second, the model simplifies the computation of received power at each wavelength, allowing for calculations up to ten orders of reflections. Third, based on the received power at each wavelength, the model estimates the spectrum received by the photodetector. Fourth, it evaluates inter-channel interference by analyzing the received spectrum and the spectral responsivity of the photodetectors. Fifth, photometric and colorimetric metrics such as the illuminance, colorimetric coordinates, correlated color temperature, and color rendering index are derived from the spectrum estimation. Sixth, the model accommodates custom CSK constellation designs to calculate the received spectrum and associated photometric and colorimetric metrics. Finally, the model estimates the symbol error rate as a function of the source luminous flux. These advancements represent the primary contributions of the current model compared to the original work.
The following section presents the underlying logic of the recursive model. The recursive model accounts for two types of responses when calculating the power received by the photodetector: the line-of-sight components between the light source and the photodetector (
), and the non-line-of-sight components (
). In
Figure 3, the direct ray from the light source over a distance
represents the LOS component. A ray emitted by the light source and reflected by a single reflective element before reaching the photodetector (with distances
and
) is classified as a first-order NLOS component. If the ray reflects off two surfaces before reaching the photodetector, it becomes a second-order NLOS component. Thus, the CIR can be expressed as the superposition of the LoS and the infinity reflections:
where is the CIR of the components undergoing exactly k reflections, is the LoS response, and the sub-index n indicates that the CIR is computed for multiple wavelengths; thus, represents the CIR at the n-th central wavelength and the symbol t represents the variable representing time. is the following set of transmitter parameters:
: Light source position vector
: Normal vector tx position
m: Mode number Lambertian emission
: Luminous flux emitted by the light LED
: Central wavelengths of LEDs
: Full width at half-maximum
and is the set of receiver parameters:
: Photodetector position vector
: Normal vector receiver position
: Sensitive area
: Field of View
: Spectral responsivity.
Figure 3 shows the geometry notation. The LoS and NLoS expressions are raised from this notation.
2.1. LED Source Model
VLC uses LEDs as the light source. The spatial distribution of the radiation intensity of the LED is modeled using the generalized Lambertian radiant intensity, defined as follows:
where m is Lambert’s mode number defining the directivity of the source. The order of the Lambertian emission m is related to the LED semi-angle at half-power :
2.2. Receiver Model
The receiver is modeled as an active area that collects optical radiation in incident angles smaller than the detector’s field-of-view (FOV).
2.3. LoS Propagation Model
The power received at the photodetector directly from the LED is
, which is calculated according to Equation (
7):
where represents the distance between the transmitter and the receiver. This equation assumes that the irradiance over the detector’s active area is constant, as is large compared to the detector’s size. The CRI of the LoS is an impulse function with time shifting and modified amplitude. The LoS response is equal for n wavelengths, as the right part of this equation does not depend on n.
2.4. NLoS Propagation Model
This recursive model computes the NLoS components by dividing the walls into smaller areas or cells
, assuming a Lambertian scattering in each cell. Each of these smaller areas plays the role of an elemental receiver (
) and an elemental source (
). It is crucial that these smaller areas be sufficiently small to ensure optimal model accuracy, although this refinement increases computational time. This method serves as an approximation of the actual propagation process, which involves an infinite number of rays traversing the space. One of these smaller areas is designated the LED source and another is designated as the photodetector, while the remaining segments represent reflective elements on each of the six walls.
Figure 3 identifies the areas corresponding to the light source, photodetector, and reflective elements in yellow, blue, and gray, respectively. The channel impulse response for the reflection
k can be calculated as
where is the number of cells and ∗ is the convolution operation. The convolution can be computed as a scalar multiplication, as and are impulse functions. The term can be replaced for the LED model as follows:
In accordance with [
19], this definition can be expressed as follows:
where represents the reflectance factor at wavelength n of cell j () and its value. With as the total number of cells and k reflections, the number of elementary computations performed to calculate the CIR is equal to .
6. Discussion
According to
Table 2, the received power calculated by our Python recursive algorithm presented a relative error of less than 3% for the four indoor configurations for the reference model presented in [
17]. Based on these results, the recursive algorithm’s performance is considered to be validated. Additionally, the Python algorithm computed the received power with more than three reflection orders due to the reduced memory compared to [
17]. The simulation with ten reflection orders for Configurations A and B revealed additional information and features that could not be elucidated in the simulation with three orders of reflection. In the case of environments with high-reflectance walls, such as Configuration A, the received power at the detector position increased by approximately 22% of the received power computed with three reflection orders. In Configuration B, however, there was an increase of only 2%. It is essential to consider high-order reflection (>3) for high-reflectance indoor environments, as the communication and illumination characteristics are strongly dependent on high-order NLoS components.
Concerning the characterization of cross-talk in the indoor Configuration A,
Table 4 shows the numerical variation of the normalized cross-talk matrix when the photodetector position changes. If the cross-talk is compared between positions P1 and P3, the index
changes by roughly 30% and the index
changes by roughly 13%. The other photodetector positions also show that
and
increase if the detector is closer to the walls. Because the walls are more reflective at larger wavelengths and the received power from NLoS is greater near the walls, the photodetected current of the red and green channels increases in comparison with the blue channel. The index
is always the greater value of the cross-talk matrix, as the radiometric power emitted by the blue color LED is the greatest. This occurs because one restriction of CSK modulation is that all transmitted symbols must produce the same luminous flux. The radiometric power of the blue LED for producing 1 lm is greater than the radiometric power of the red and green LEDs. This means that the luminous efficiency of the blue LED is the lowest; thus, the photo detected current generated by the blue color detector is the greatest. The inter-channel interference represented by the
,
,
,
,
, and
indexes is significantly low due to the narrow spectral responses of LEDs and effective alignment of these responses with those of the detectors. The importance of cross-talk characterization is that the optimization of the VLC must consider the cross-talk matrix in order to maximize the minimum Euclidean distance between the received symbols. The solved design of the CSK constellation depends on establishing certainty regarding the inter-channel interference and the DC channel gain. Until now, previous CSK optimizations have only considered a unique cross-talk matrix.
Table 4 shows the received power for every color channel when the detector’s position changes. The power reported for the receivers corresponds to a radiated power of 1 W at every color LED. The red channel presents the greatest power and the blue channel the lowest received power according to the spectral response of the wall’s reflectance. For Configuration A, as illustrated in
Figure 5a, displacement of the photodetector by 1 meter with respect to the center of the receiver plane results in a reduction of received power by more than 20% across each color detector channel (red, green, and blue). The lighting parameters shown in
Table 5 reveal three critical problems in the illumination quality: non-uniform illuminance over the receiver plane, low color rendering, and saturated perceived color. The non-uniform illuminance problem must be solved using more than one RGB-LED source; on the other hand, the problems regarding color rendering and perceived color depend on the CSK constellation design. These simulations were carried out using the constellation design proposed in IEEE 802.15.7. Consequently, with low luminous efficiency of the blue LED, users will perceive a saturated blue color with very low color rendering quality. The design of the CSK constellation must be studied as an optimization problem that improves the symbol error rate and ensures color rendering quality.
The communication performance of the VLC indoor system was analyzed by simulating an AWGN channel model while incorporating the effects of shot noise and thermal noise observed in the photodetector. A simulation was conducted to estimate the luminous flux required to achieve an SER of approximately
for IEEE-based CSK modulation with sixteen symbols. With the receiver positioned vertically below the light source (position P1 in
Figure 5a), a luminous flux of approximately 4000 lm is required to achieve an SER of approximately
. At positions P2 and P3, the luminous flux increases to about 7000 lm and 12,500 lm, respectively. The final analysis demonstrates the degradation of communication quality as the light detector is moved away from the light source. The estimated luminous flux corresponds to the smaller active area of the photodetectors. Enhancing the optical power on the active area can be achieved using lenses or optical concentrators, which allow for managing reduced luminous flux at the transmitter while maintaining an appropriate SER. Additionally, the observed SER curves are based on the IEEE-standard constellation design; however, the Python package also supports customized constellation designs. Consequently, the performance of an optimal constellation design tailored to the indoor channel characteristics can be demonstrated using our Python-based model.
7. Conclusions
The primary contribution of this work is the development and validation of a novel open-source Python-based indoor channel model for CSK in visible light communication systems. The model successfully calculates the received power at each color photodetector along with the inter-channel interference and lighting parameters within an empty rectangular room, assuming Lambertian reflective walls. Validation against a reference model demonstrated a relative error of less than 3% across four indoor configurations, with enhanced performance in handling high-order reflections (up to ten orders). Notably, for environments with high-reflectance walls, the model revealed that higher-order reflections substantially impact the received power, contributing to a increase in detected power of up to 22% in certain configurations, which emphasizes the need to account for these components in highly reflective environments.
The model also enables a detailed cross-talk analysis across different photodetector positions, showing significant variations in inter-channel interference, particularly in configurations where the photodetector was positioned near walls. These findings are essential for optimizing CSK constellations to minimize symbol error rates while maintaining acceptable illumination quality. Moreover, the model simulated the spectral responses of commercial LEDs and photodetectors, capturing key illumination challenges such as non-uniform illuminance, low color rendering index (CRI), and saturated perceived color when using the IEEE 802.15.7 standard constellation. Addressing these issues requires optimizing the CSK constellation design, particularly to improve color quality and communication performance.
In terms of communication performance, the model simulated an AWGN channel to estimate the symbol error rate (SER) under realistic noise conditions. The results showed that for a target SER of approximately , the required luminous flux increased significantly as the receiver was moved away from the light source, demonstrating the spatial sensitivity of the system. The findings also suggested that optimizing the receiver’s design through techniques such as optical concentration can reduce the required luminous flux while maintaining adequate communication quality. Additionally, the model’s flexibility allows for the simulation of custom constellation designs, offering a powerful tool for optimizing CSK systems to meet both communication and lighting performance goals in various indoor environments.