A Stock Prediction Method Based on Multidimensional and Multilevel Feature Dynamic Fusion


1. Introduction

Stock price prediction is one of the core applications of financial data mining, and the stock market reflects the overall state and expectations of the economy. Studying the stock market gives valuable insights regarding economic trends, industry development, and company performance. By forecasting stock market movements, investors and financial institutions can develop appropriate risk management strategies in advance, reducing potential risks, obtaining more options, and achieving higher efficiency, thus making more informed investment decisions [1]. Consequently, there has been significant interest in stock prediction from both academia and the industry in recent years [2,3,4]. However, the inherent complexity and randomness of the stock market present significant challenges. Historical stock price data are fraught with noise and irregularities, complicating the decision-making process for investors. Moreover, stock prices are influenced by a multitude of factors—including macroeconomic trends, regulatory policies, and investor sentiment—that are often difficult to quantify [5,6]. This vast and intricate dataset poses a formidable barrier to achieving accurate predictions of stock market movements.
The Efficient Market Hypothesis (EMH) [7] suggests that stock prices reflect all available information, and thus, using price information alone can efficiently accomplish prediction tasks [8,9]. In the past, researchers have attempted to use traditional time series analysis methods for stock prediction, such as Vector Autoregression (VAR) [10] and Autoregressive Integrated Moving Average (ARIMA) [11]. However, these methods are predicated on the assumptions of linearity and stationarity, which do not hold true for the inherently nonlinear and non-stationary nature of stock price data. Consequently, these traditional approaches often falter in the face of the noise embedded in historical stock data [12]. Another common approach, fundamental analysis, entails evaluating a company’s financial statements and broader industry conditions. However, this method is resource-intensive and requires a depth of expertise, making it challenging to apply consistently across diverse market conditions. As a result, fundamental analysis can yield suboptimal predictive performance.
In recent years, deep learning technology has rapidly developed and has been widely applied in fields such as medicine, transportation, and finance. Due to the limitations of traditional methods, deep learning techniques have gradually become mainstream in stock prediction [13]. Deep learning can automatically extract useful features from large amounts of historical data without requiring manual feature definition, reducing the workload of feature engineering and improving prediction accuracy. Moreover, deep learning models can adapt to dynamic changes in market conditions through continuous training and updates [14], which significantly enhances their robustness and predictive performance. However, despite these advantages, most existing methods primarily focus on the impact of different features on stock prices in a separate way. This narrow approach often overlooks the complex interactions between multiple features and fails to consider the broader global environment’s influence on stock market dynamics. Such limitations can lead to suboptimal predictions, as stock prices are affected by a multitude of interrelated factors.

Recognizing these challenges, our research aims to develop a stock prediction method that employs the dynamic fusion of multi-dimensional and multi-level features. By integrating data smoothing strategies, we can mitigate the noise often present in global historical stock data, enhancing the reliability of our predictions. Additionally, incorporating attention mechanisms allows us to effectively capture both global and local environmental impacts on stock prices, thereby providing a richer understanding of the market.

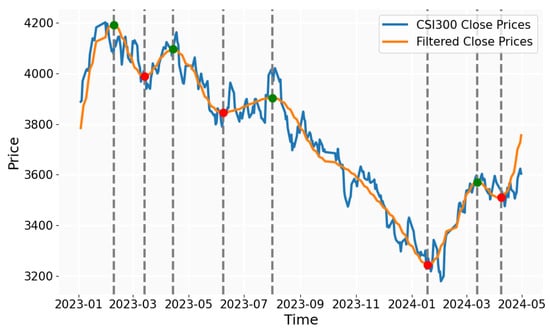
To validate the effectiveness of our MDML model, we utilized stock data from the China Securities Index 300 (CSI 300), covering the period from January 2020 to April 2024, as a representation of local market features. Simultaneously, data from the CSI 300 index for the same period were employed to capture global market dynamics. The key contributions of this study are listed below.

  • We provide a stock prediction method based on the dynamic fusion of multidimensional and multilevel data that successfully captures the impact of both global and local factors on stock prices. By combining variables from many dimensions and levels, the model provides a thorough knowledge of the factors that influence stock price movements. This novel approach analyzes not only the influence of individual features but also the interactions between features, hence increasing the model’s expressive power.

  • A dynamic weight allocation method is presented that enables the model to dynamically modify the weights of various characteristics according to their relative importance. This guarantees an accurate representation of each feature’s effect on stock prices. The model can represent the changing importance of information across several time points and market conditions by dynamically allocating weights, which enhances the accuracy and dependability of prediction outcomes.

  • We introduce a Fourier transform method for global features, applying Fourier transform to global features to capture long-term trends in the global environment. This technique helps in understanding the impact of macroeconomic and other broad factors on stock prices over an extended period, providing the model with support from long-term information.

  • We conducted extensive experiments on stocks from different industries within the CSI 300 index in the Chinese market. The results indicate that the proposed model performs exceptionally well in stock price prediction, significantly outperforming traditional methods and other deep learning approaches, thereby demonstrating its substantial potential in practical applications.

The remainder of the paper will be organized as follows: Section 2 will review related work on stock prediction, including both traditional methods and deep learning approaches. Section 3 will provide a detailed description of the proposed stock prediction method based on dynamic fusion of multi-dimensional and multi-level features. Section 4 will present the design and results of the experiments. Section 5 discusses the limitations of this work and future research directions, while Section 6 summarizes the main findings and contributions of the study.

4. Experiments

4.1. Dataset

During the data collection process, taking into account that stocks in the same or related industries may exhibit similar trend variations, we combine the classification results based on the enterprise types from the East Money website with the clustering results based on the close price as shown in Table 2. This approach allows us to segment the stocks into different datasets for separate training.

4.2. Data Process and Model Training

The dataset is divided temporally into training, testing, and validation sets with a ratio of approximately 8:1:1, followed by min–max normalization of the data.

An Adam optimizer is utilized with a learning rate of 0.001 and a batch size of 64, employing the Mean Squared Error (MSE) as the loss function. To investigate the impact of the observation window on the predictive outcome, experiments were conducted with observation windows set to 5, 10, 15, 20, and 25. The results indicated that the model performed optimally with an observation window of 15; thus, this setting was adopted. During the Fourier transformation of global features, the top K frequencies were selected, and it was discovered through experimentation that the model’s predictive performance was best when the top K was set to 7. To mitigate overfitting, an early stopping strategy was employed, halting the training process if the loss value on the validation set did not decrease for five consecutive epochs.

The historical data indicators obtained from the website encompass a total of 20 types, as shown in Table 3, which include: Opening Price, Closing Price, Highest Price, Lowest Price, Trading Volume, Transaction Value, Turnover Rate, Price Change Percentage, Price Change Amount, Amplitude, Pivot and some technical indicators. Among the historical data indicators obtained from the website, the term “Pivot” refers to the average value of the Highest Price, Lowest Price, and Closing Price. In the global information capture module, we utilize the CSI 300 Index as a representative of global information. The CSI 300 is a significant index in China’s securities market, encompassing the stocks of 300 companies and representing the overall trend of China’s securities market.

4.3. Evaluation Parameters

In our quest to forecast stock prices with precision, we evaluated the reliability of the experimental results by incorporating three widely used metrics: Mean Absolute Error (MAE), Mean Absolute Percentage Error (MAPE), and Root Mean Square Error (RMSE). These metrics serve as a multidimensional framework for assessing the predictive efficacy of our model. The Mean Absolute Error (MAE) offers a direct measure of the average prediction error magnitude, while the Mean Absolute Percentage Error (MAPE) translates these errors into a percentage of actual values, highlighting relative inaccuracies especially pertinent in finance. The Root Mean Square Error (RMSE) amplifies the impact of larger errors through squaring, making it an effective tool for gauging average error severity and identifying outliers [25]. The formulas for the calculation of these metrics are as follows:

M A E = 1 n i = 1 n | y i y ^ i |

M A P E = 1 n i = 1 n | y i y ^ i | y i

R M S E = 1 n i = 1 n ( y i y ^ i ) 2

where n is the number of samples, y i is the actual value, y ^ i is the predicted value, and y ¯ is the average value.

4.4. Baseline

Our experiments are benchmarked against a diverse array of analytical techniques, including traditional models like ARIMA and Moving Average (MA) [39,40], which are cornerstones in time series forecasting. We also leverage machine learning algorithms such as SVM and RF for their efficacy with complex data patterns. Additionally, we engage deep learning models: CNN-LSTM, DTML, and LSTM-BN to harness advanced pattern recognition capabilities. This comprehensive comparison with our approach aims to affirm its effectiveness and superiority in predictive performance.

Here is a brief introduction to the baselines:

  • ARIMA [41]: The ARIMA model is a time series forecasting model composed of the Autoregressive (AR) and Moving Average (MA) components. In this approach, we utilize historical closing prices as variables to predict future closing prices. To identify the optimal hyperparameters, we utilize the Autocorrelation Function (ACF) and Partial Autocorrelation Function (PACF) for parameter specification.
  • MA [42]: The MA model is a time series forecasting model that consists solely of the Moving Average component. The predictions of the MA model are influenced by historical data and are suitable for stationary time series data.
  • ES [43]: Exponential Smoothing (ES) effectively captures trends and seasonal variations in data, demonstrating strong adaptability to rapidly respond to market changes and adjust forecasts in a timely manner. This makes it suitable for dynamic financial markets. The relevant code for this part of the experiment can be found at https://github.com/DONGTangYuan/multi-dimension-data (accessed on 1 October 2024) for reference.
  • lightGBM [44]: LightGBM is an efficient gradient-boosting tree algorithm that excels in handling nonlinear relationships and high-dimensional data, enabling it to capture complex market patterns.
  • SVM [45]: Support Vector Machine is a supervised learning algorithm that finds an optimal hyperplane to separate data into two categories. It applies to both classification and regression problems. The SVM model can capture complex nonlinear relationships in historical data and is therefore widely used in stock price forecasting.
  • RF [46]: Random Forest is an ensemble learning algorithm that makes predictions through multiple decision trees. In this stock prediction model, in addition to utilizing fundamental features such as opening price, highest price, lowest price, and trading volume, we have also incorporated technical indicators such as moving averages, Relative Strength Index (RSI), Bollinger Bands, and Moving Average Convergence Divergence (MACD).
  • CNN-LSTM [23]: The CNN-LSTM model is a model that combines Convolutional Neural Networks and Recurrent Neural Networks. It extracts features from the input sequence using convolutional networks and then makes predictions using recurrent networks.
  • DTML [34]: The DTML model is a transformer-based model. It learns the correlations between stocks in an end-to-end manner. DTML captures asymmetric and dynamic correlations by learning the temporal correlations within each stock and generates multi-level context based on the global market context.
  • LSTM-BN [47]: The LSTM-BN model is a model based on Recurrent Neural Networks and Batch Normalization. It accelerates the training process and improves prediction accuracy through batch normalization.

4.5. Experiment Result

To substantiate the efficacy of our model, we conducted experiments on both the baseline models and our proposed model. During the validation process of the model’s performance, we set different random seeds and performed the experiments five times, taking the average results. The following are the outcomes from testing our model and the baseline models on a test set composed of stocks from eight different industries. The results are shown in Table 4, Table 5, Table 6 and Table 7. We have bolded the best metrics for all models and underscored the second-best metrics.
Table 6 and Table 7 demonstrate that the ES model and SVM model exhibit notably strong performance in the Pharm. and Biotech. and Finance sectors, respectively. This indicates that traditional time series forecasting methods and conventional machine learning algorithms can perform well in certain cases. On the other hand, the LSTM-BN and CNN-LSTM algorithms show superior performance in the Chemical Industry and Information Technology datasets, respectively, suggesting that employing alternative deep learning methods for stock price prediction also holds significant promise. Overall, across all eight datasets, our proposed models consistently achieve the lowest or second-lowest values for MAE, RMSE, and MAPE metrics. This signifies that the absolute and relative errors between predicted and actual results are minimal, indicating that our models possess a degree of stability and accuracy. This further validates the effectiveness of our proposed method for dynamic fusion of multi-level and multi-dimensional features.

4.6. Case Study

To substantiate the efficacy of our predictive model, an in-depth case study was conducted focusing on a select group of the most representative stocks within the CSI 300 index. This study was designed to meticulously assess the model’s forecasting capabilities by comparing its predicted values against the actual market outcomes. The selected stocks were chosen based on their market capitalization, liquidity, and influence on the overall index, ensuring a comprehensive reflection of the model’s performance across various sectors and market conditions. The testing period for this case study spanned from 1 April 2024, to 1 June 2024, a timeframe that encapsulates a variety of market conditions, including seasonal fluctuations and potential macroeconomic events that could influence stock prices.

The results of the case study were compelling, with the model demonstrating a high degree of accuracy in its predictions. The predicted values were found to be near the actual values as shown in Figure 3a,b, Figure 4a,b, Figure 5a,b and Figure 6a,b, indicating the model’s robustness and reliability in forecasting stock prices.

4.7. Ablation Study

To verify the effectiveness of our model, we conducted ablation studies. The setup of the ablation studies is as follows:

  • my-model-1: The Discrete Fourier Transform (DFT) is removed, while dynamic weights and feature dynamic fusion are retained, to verify the impact of the DFT on the model.

  • my-model-2: Dynamic weights are removed, while the DFT and feature dynamic fusion are retained, to verify the impact of dynamic weights on the model.

  • my-model-3: Feature dynamic fusion is removed, while the DFT and dynamic weights are retained, to verify the impact of feature dynamic fusion on the model.

  • my-model: The complete model, including the DFT, dynamic weights, and feature dynamic fusion.

In this experiment, we conducted experiments on two datasets from the finance and construction industries within the CSI 300. The results of the experiment are as follows:

The results of the ablation experiments in Table 8 indicate that the removal of the DFT module, dynamic weights module, and feature dynamic fusion all lead to an increase in MAE, RMSE, and MAPE metrics, implying a decline in the model’s predictive accuracy. Thus, it can be concluded that the DFT module, MOE module, and feature fusion module all contribute to the enhancement of the model’s performance. Specifically, the impact of removing the DFT module on the experimental results is minimal, while the removal of the feature fusion module causes a significant increase in the MAE metric. Conversely, the removal of the MOE module results in a more substantial rise in RMSE and MAPE metrics. These experiments demonstrate that adding fusion modules is beneficial for reducing both the relative and absolute discrepancies in predictions, thus validating the effectiveness of multi-dimensional and multi-feature fusion. The minimal impact of the DFT module suggests that there is still room for improvement in capturing the global characteristics of stocks, which could be a focus for future work.

6. Conclusions

In conclusion, this paper presents a novel deep neural network model for stock price prediction that effectively integrates multi-dimensional and multi-level features. By dynamically assigning weights to various stock features and applying the Fourier transform to capture long-term trends, the model successfully combines global and local information to reflect the overall market environment’s impact on individual stocks. The incorporation of an attention mechanism and RNN-based structure further enhances the model’s ability to capture temporal dynamics, leveraging historical price data to improve prediction accuracy. Experimental results on stocks from different industries within the CSI 300 index demonstrate the model’s superior performance compared to traditional methods and other deep learning approaches, highlighting its potential for more accurate and robust stock price prediction. However, the research presented in this paper still has several limitations. For instance, the experiments were conducted exclusively within the context of the Chinese stock market and relied solely on numerical data, neglecting textual information, which may limit the model’s predictive performance and expressive capability. Therefore, in future work, it would be beneficial to incorporate a broader range of information into the model, including textual data, and to validate the model’s effectiveness across stock markets in other countries.


Source link

Yuxin Dong www.mdpi.com