
2. Materials and Methods
AERMOD is an air quality dispersion model based on atmospheric boundary layer turbulence structures. It simulates the dispersion of pollutants from multiple ground-level and elevated sources, including point, area, and volume sources. The AERMOD suite uses numerical solvers to simulate dispersive phenomena, pollutant transport, and both dry and wet removal processes as meteorological conditions change. It also accounts for the geomorphology of the terrain and integrates chemical transformation modules.
AERMOD calculates pollutant concentrations using a steady-state plume model. Terrain influence was accounted for by combining horizontal and terrain-following plumes. The dispersion algorithms were adapted for both convective and stable conditions, considering the characteristics of urban and rural areas, and the impact of vertical structures like buildings. In the current version of the DSS, the AERMOD version 16216r was used.
2.1. Application of AERMOD to the Cagliari Metropolitan Area
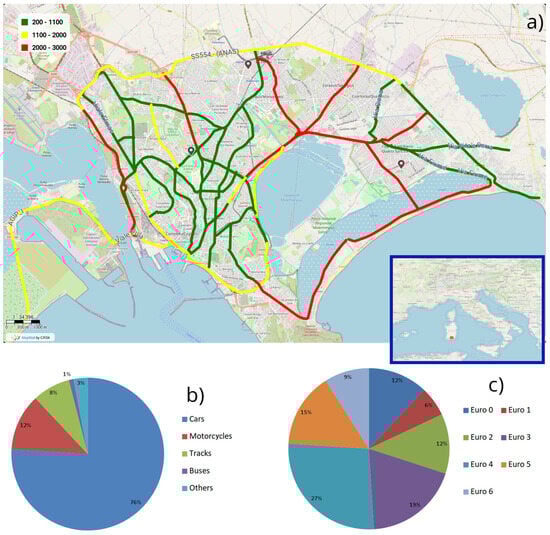
Traffic data provide key insights into the number and types of vehicles passing through a road segment over time. This includes details on vehicle categories such as passenger cars, trucks, and buses, as well as their density at different hours. Each vehicle type has specific emission factors, which indicate the amount of pollutants (e.g., CO2, NO2, or particulate matter) emitted per unit of activity, such as per kilometer driven.
To estimate emissions, the number of vehicles in each category is multiplied by their corresponding emission factors, yielding the total emissions for that road segment within a given time period. Summing these emissions across all categories provides the overall emission load for the road segment, calculated on an hourly basis. This method enables a dynamic estimation of emissions that accounts for variations in traffic volume, vehicle types, and time of day.
The development of the Cagliari model started with the assumption of a continuous rural domain and constant hourly car emissions that vary for each season and each road. Additionally, atmospheric conditions are updated hourly for each day throughout the entire simulation period, using varying (at 1 h time step) measured meteorological data from Elmas and Decimo stations.
Wind direction signals analyzed for 2019 revealed dominant winds from the NW, N, and SE. The SE winds, which bring humid air from the sea towards the city, differ in intensity and often have higher wind speeds. In accordance with Pandey et al., 2023, this can lead to an underestimation of micrometeorological parameters essential for AERMOD inputs, ultimately causing pollutant concentrations to be underestimated.
The data sampling period of 2019 and 2020 was selected due to the availability of complete and reliable datasets for both traffic and air quality measurements during this timeframe. The period from March to April 2019 was used for calibration, while the remainder of the year served for validation. These data sets were critical to ensuring the robustness and accuracy of the model calibration.
Data from March and April 2020, when vehicular traffic was minimal due to COVID-19 lockdowns, were employed to estimate non-traffic nitrogen oxide sources. During this period, NO2 concentrations were more than 45% lower than the typical hourly concentrations observed in March and April of 2018, 2019, 2021, and 2022. These hourly experimental values were incorporated into the model as background values.
2.2. Calibration and Validation of the Model
The development of the air dispersion model is influenced by three key sources of uncertainty: conceptual model uncertainty, input uncertainty, and parameter uncertainty. Conceptual model uncertainty arises from the fundamental assumptions and structure of the model itself, reflecting how accurately it represents real-world conditions. Input uncertainty involves variations in the data used, such as meteorological and climatic conditions as well as pollution sources, which may not always be precisely known. Finally, parameter uncertainty relates to the specific constants and variables within the model calculations, which can impact the accuracy and reliability of the model’s predictions. Together, these uncertainties play a significant role in shaping the model’s performance, making it essential to address them for greater accuracy and robustness. The Cagliari model addresses air dispersion, excluding photochemical reactions and pollutant transformations.
Here, y represents the measured value, denotes the simulated value, and y is the arithmetic mean of the measured observations.
Vehicle emission loads fluctuate hourly based on workdays, holidays, seasons (winter, spring, summer, and fall), and the specific roads. To account for these variations, average hourly emission loads were calculated for each season and each road segment. Thus, emission coefficients were adjusted to improve consistency in model performance.
In the model, the Urban Heat Island effect (UHI) was also incorporated, which refers to urban areas being hotter than their rural surroundings due to human activities, building materials, and dense infrastructure. The UHI influences local meteorology by altering wind patterns, temperatures, and atmospheric stability, which, in turn, affect the dispersion of pollutants. Incorporating this effect in the model helped better simulate local air quality in the Cagliari domain by adjusting for these localized climate effects.
Once calibrated, the model was then run for the entirety of 2019, capturing seasonal and daily variations in vehicle emissions and atmospheric conditions. Air pollution peaked during winter and fall due to increased traffic and low-wind conditions that trap pollutants. Summer experienced cleaner air thanks to lighter traffic, high-pressure systems, and stronger winds. Daily patterns remained consistent across seasons, with air pollution peaking between 8–10 a.m. and 7–10 p.m. In winter and fall, however, model estimates at 6 p.m. tended to be higher than observed values, likely due to micro-atmospheric factors causing numerical anomalies.
The MSE, MSEP, and R2 values calculated for the four seasons demonstrate a strong alignment between the simulated results and the observed experimental data, highlighting the reliability of the proposed modeling system. Specifically, the model achieved the following performance metrics:
Winter: MSE = 36.03, MSEP = 1.25, R2 = 0.72;
Autumn: MSE = 62.53, MSEP = 1.71, R2 = 0.73;
Spring: MSE = 27.4, MSEP = 1.03, R2 = 0.74;
Summer: MSE = 21.5, MSEP = 1.42, R2 = 0.72.
These results validate the model’s capability to accurately estimate the environmental impact of vehicular traffic in the city of Cagliari across all seasons. Notably, the lower MSE and MSEP values observed in spring and summer suggest better predictive accuracy during these periods, although the R2 values remain consistently high across all seasons, reflecting strong agreement between predictions and observations. Given its robust performance, the model is well suited for integration into a web-based platform. This enables stakeholders to simulate and analyze various traffic and pollution scenarios, supporting data-driven decision making to mitigate environmental impacts. The platform can generate detailed seasonal maps by leveraging high-resolution output, enabling the in-depth spatial analysis and visualization of pollutant distributions and traffic-related emissions throughout the year.
Near major roads, the model showed that traffic-induced mechanical mixing dominated over mixing driven by atmospheric turbulence, especially under calm cross-road wind conditions that made plumes rise more significantly. The model tended to underestimate pollutant concentrations during southeast and east winds coming from the sea, highlighting specific areas where the more detailed characterization of traffic and atmospheric conditions (resulting in a stronger calibration) could enhance accuracy.
3. Results
3.1. The AERQ DSS
The AERQ platform integrates multiple data sources, including Copernicus, regional databases, in-house datasets, and ISTAT data, along with high-performance computing (HPC) infrastructure and large-scale data storage. This integration supports the execution of models such as AERMOD and various Business Intelligence (BI) applications. After executing the scenarios, BI algorithms process the data. Hourly analyses are conducted to evaluate daily cycles and are then aggregated to provide annual, monthly, and seasonal insights, which are presented through the application interfaces.
AERQ DSS enables comprehensive analysis by the following:
Estimating atmospheric pollutant emissions from diverse sources, such as transportation and industrial activities.
Predicting pollutant concentrations in the air, analyzing spatiotemporal variations and trends.
Identifying, detecting, reconstructing, and forecasting pollutant behavior, enabling deeper insights into environmental dynamics.
3.2. The HPC Environment
The CRS4 HPC is a cutting-edge, in-house high-performance computing environment with over 300 compute nodes and more than 9000 cores. This infrastructure is a cornerstone of the AERQ decision support system, satisfying the computational demands of the AERMOD air quality model and its applications. Due to its complex physics and the need for high spatial and temporal resolutions, AERMOD is computationally intensive, making efficient processing essential.
The CRS4 HPC provides the required computational power to pre-process and post-process large geospatial datasets and simulate pollutant dispersion at fine scales. This allows us to deliver results with the accuracy, timeliness, and reliability necessary for effective air quality management.
In the specific use case for the metropolitan area of Cagliari, simulating air quality for a single pollutant over the entire road network (over 1500 sources) and all active receptors (over 2500) would take over 36 h for a seasonal simulation on a modern mid-sized desktop machine. For a full year, accounting for all variables, this would extend to approximately 62 days. Calibrating the AERMOD model for the Cagliari domain required hundreds of these simulations, translating to several years on a single machine.
An unconventional hybrid infrastructure of the SQL database and file system has been designed to meet the demands of our large-scale geospatial simulations. In a 5-year simulation scenario, the system manages 315 GB of imagery (43,200 GeoTIFF files) and 575 GB of structured data within the SQL database. The SQL component (PostgreSQL with PostGIS) handles metadata management and complex spatial queries, ensuring data integrity and efficient access to vector data. Meanwhile, the filesystem is optimized for storing and retrieving large raster datasets, providing high-throughput access to high-resolution geospatial imagery. This dual approach combines the structured, query-optimized environment of SQL with the flexibility and speed of the filesystem, delivering the scalability and performance required for diverse, intensive simulation workflows.
3.3. Back End and Front End
The front end consists of several applications built with HTML and JavaScript, utilizing various libraries and frameworks to present tools tailored for users. Maps are generated using MapWall (vers. 0.05+4), a framework developed by CRS4 for creating web-GIS dashboards based on the OpenLayers library (vers.6.5.0), while charts are created with the Chart.js library (vers. 4.3.0).
The back end is built on a Node.js infrastructure with the Express framework and provides a set of REST APIs to the front end, acting as a bridge between user interfaces and the Data Processing Layer. This layer manages data handling and model execution, using ETL (extract, transform, load) procedures to generate input datasets for AERMOD. Data are stored in a PostgreSQL database and a file system repository, with ETL procedures implemented in Python (vers. 3.6.9).
When a user designs a new scenario via the web interface, the back-end processes the request, initiating a pipeline to create the necessary input data for AERMOD based on user specifications. Once the data preparation phase is complete, the input environment is transferred to the HPC layer to execute the AERMOD model. Upon completion, the output is processed through another ETL procedure to load the simulated data into the database and generate heatmaps, which are stored in the file system repository. Finally, the scenario catalog is updated, making results available for visualization (GIS maps, graphs, and reports) in the front end.
The front end of the system features both the Job-demand App and the Visualization App.
3.4. System Architecture and Key Features
3.4.1. Modular Architecture
AERQ is designed with a modular architecture, where functionalities are distributed across independent layers (front end, back end, ETL, and HPC). This ensures that specific tasks are isolated and executed in a well-defined sequence. In the event of an issue during the simulation workflow, the system marks the simulation as incomplete in the database and logs the error. Intermediate data and inputs are preserved, allowing for diagnostics and, if necessary, the resumption of the process without starting from scratch. Additionally, the front end remains operational, allowing users to access pre-processed simulation results and visualizations even during the processing of new simulations.
The system ensures efficient data exchange through optimized communication channels between components, all of which operate over a high-speed internal network. This setup reduces latency and ensures smooth data flow between the front end, back end, ETL, and HPC layers, enabling fast and reliable interactions across the system.
3.4.2. Security and Access Control
Robust security measures are in place across all layers to safeguard against unauthorized access. Network segmentation ensures that machines are assigned specific roles and access levels, with the front end and back end in the DMZ handling external requests while other critical components, such as the scenarios setup and the HPC area, are restricted to internal access via VPN. Access to the front end can be configured as either public or private depending on the application setup. If authentication is enabled, access to the front end is managed through JWT-based tokens, ensuring secure user identification and role-based access. This setup provides flexibility in managing who can access different levels of data and functionalities. Additionally, the physical and logical isolation of the HPC cluster provides further protection, shielding it from external access.
3.4.3. Load Management and Scalability
The system is designed to handle increased demand by leveraging scalable resources within the HPC layer, ensuring that computational power is efficiently allocated based on the number of simulations being processed. This flexibility allows the system to adapt to varying workloads, maintaining optimal performance even during periods of higher computational demand.
3.5. The Job-on-Demand App
The job-on-demand interface offers a comprehensive and flexible system for environmental modeling, allowing users to simulate and study pollution dynamics through various customizable features:
Pollutant Selection: Users can select specific pollutants for analysis, including CO2, SO2, NO2, PM (particulate matter), CO, SO2, and NMHC. This flexibility enables targeted simulations and analysis based on specific environmental concerns or regulatory needs.
Dynamic Road Emission Control: Roads can be activated or deactivated as emission sources directly from the web-GIS map by simply clicking on them. When deactivated, roads do not contribute to emissions, simulating scenarios such as road closures for maintenance, construction, or traffic restrictions. This function allows for the precise simulation of changes in traffic patterns and their impact on air quality.
Vehicle Volume Adjustment: Users can adjust the total number of circulating vehicles across the city or on specific roads, allowing simulations of varying traffic densities during events like national celebrations, concerts, or sports matches.
Vehicle Type Distribution: The interface enables changes in the composition of vehicle fleets by adjusting the percentage of vehicles in each emission standard category (Euro 0, Euro 1, Euro 2, etc.). These adjustments can be made for both working days and holidays, capturing different emission profiles based on vehicle age and efficiency standards.
Additional Pollution Sources: New pollution sources can be introduced to model exceptional events, such as fires, industrial releases, or port activities like ship arrivals. The simulation infrastructure uses a Lagrangian approach for pollutant diffusion, tracking the spread of pollutants through a continuous release of “puffs” that follow meteorological conditions. This allows for highly realistic dispersion modeling that reflects local weather patterns and terrain effects.
Receptor Placement for Spatial Analysis: Users can place receptors at specific points in the simulation area to monitor pollutant concentrations, facilitating detailed spatial analysis and hotspot identification. This feature is essential for assessing pollutant impacts on sensitive areas such as schools, hospitals, or residential zones.
Simulation Time and Meteorological Integration: The system provides extensive control over the simulation period and integrates detailed 3D meteorological data covering both horizontal and vertical layers. These data are reconstructed using ground-based measurements, atmospheric profiles, terrain features, and land-use information, enabling the simulation to account for the influence of topography on wind and temperature patterns and, consequently, on pollutant transport and dispersion.
This enhanced interface allows for the development of highly customized environmental scenarios, aiding in planning, policy making, and responses to both routine and emergency pollution events.
3.6. The AERQ Visualization Tools
Heatmaps, generated as GeoTIFF files by a post-processing pipeline following the AERMOD job, represent simulation results aggregated by hourly means. For an efficient web-based display, we employ Mod_tile (vers. 0.61) and Renderd software (vers. 0.61), forming a tile server architecture similar to that of OpenStreetMap (vers. 2023-05-25). This setup transmits only the tiles within the visible viewport, optimizing bandwidth and performance. Users can manually adjust the color scale to visualize heatmaps and select color schemes that best highlight data ranges for their analysis. This feature was implemented by modifying the open-source rendering code, enabling flexible color scaling.
Vector layers, such as streets and stations, are handled using the WKT (Well-Known Text) format. This format supports efficient front-end processing and integration, making it easy to visualize and interact with spatial data directly within the application.
Finally, MapWall—built on OpenLayers—supports the creation of responsive, interactive “slippy maps” for smooth panning and zooming. Menus allow users to filter and select heatmaps based on specific simulation parameters, including simulation type, year, month, and hour, enhancing data exploration by allowing precise temporal and spatial control.
Some of our map tools include a split-view option ( enabling users to display and compare two maps side-by-side—useful for examining variations across different times, zones, or scenarios. Additionally, chart widgets display data trends with options to download the data in CSV format or as PNG images, supporting further analysis and data sharing. Each chart is also dynamic, allowing users to toggle data options on and off and zoom into specific areas for closer examination.
- The Front End (Figure 5) provides user interfaces for viewing and analyzing data, including the following:
Input Data: Displays the primary factors driving the model (e.g., all emission sources).
- Air Quality Results (Figure 6): Presents average seasonal high-resolution maps of air quality at the hourly time step.
- Air Quality Comparison (Figure 7): Facilitates scenario analysis by comparing different scenarios.
Air Quality by Wind Direction: Analyzes pollutant distribution for each scenario under varying wind conditions.
4. Discussion
Mistral occurred for 263 h with speeds above 5.5 m/s, averaging 7.86 m/s and peaking at 13.4 m/s.
Scirocco blew for 199 h, averaging 6.91 m/s and reaching a maximum of 10.8 m/s.
The West wind was recorded for 25 h, with an average speed of 7.6 m/s and a peak of 11.3 m/s.
Low-wind conditions were observed for 508 h, with an average speed of 1.17 m/s.
These results highlight the relationship between wind and pollutant dispersion patterns in the region.
Decision support systems rely on real observational data to update, calibrate/validate model predictions, and provide timely information to stakeholders. HPC facilitates the rapid use of large volumes of observational data in air quality models, enabling the generation of up-to-date forecasts and assessments: HPC systems leverage parallel processing architectures to distribute computational tasks across multiple processors or nodes, enabling the faster execution of simulations and data processing tasks. The parallel strategy by running multiple simulations with varying parameters simultaneously across different scenarios and pollutants allowed us to utilize the full computational capacity of CRS4 HPC systems, reducing simulation times and improving the responsiveness of AERQ DSS. By enabling scalability and flexibility, the HPC system supports complex simulations, large-scale data analysis, and the generation of actionable insight.
The AERQ DSS distinguishes itself from similar platforms, such as AirNow and CAMS, through its modular and scalable design specifically tailored for urban air quality management. Unlike these platforms, which primarily focus on regional-scale domains, data aggregation, and visualization, AERQ incorporates high-resolution modeling (AERMOD) combined with HPC capabilities to support simulations, scenario development, and detailed analysis. Its user-friendly interface, job-on-demand application, and support for localized assessments make it a comprehensive and adaptable tool for addressing urban air quality challenges.
5. Conclusions
This study highlights the critical role of advanced technological frameworks in addressing urban air quality challenges. By developing a modular and scalable decision support system (DSS), this research delivers a robust solution for air quality monitoring and analysis. The integration of the AERMOD modeling system with a high-performance computing infrastructure enables precise, high-resolution assessments of air pollutant concentrations while significantly reducing computational time.
AERQ is designed with a flexible structure comprising independent modules for consuming and exposing web services. The platform leverages geographical datasets and models to facilitate data mapping, querying, sharing, processing, and distribution. It also provides users with the flexibility to develop new content, analyses, and applications, making it adaptable to various use cases.
The proposed DSS bridges the gap between data acquisition and actionable insights, empowering stakeholders such as policymakers, urban planners, and public health officials to make informed decisions. Its innovative features—including a job-on-demand application, scenario analysis, and user-friendly interfaces—position it as a transformative tool for urban air quality management.
By demonstrating its application in the Cagliari metropolitan area, the system underscores its practical value in addressing localized pollution issues while maintaining the flexibility to scale to broader regions. Through discussions of the model, datasets, calibration, and validation, this study provides a clear example of how the DSS can integrate and process available data for environmental modeling. This approach ensures that the methodology and results are transferable to other timeframes or regions with similarly complete datasets.
Emphasizing security, scalability, and accessibility, the DSS is well suited to the demands of modern urban governance. This study lays the groundwork for future research to enhance urban air quality systems by incorporating additional pollutants, improving spatial and temporal resolutions, and addressing interactions among pollutants.
As cities grow and face increasing environmental challenges, the development of innovative, data-driven solutions like this DSS will be pivotal in promoting sustainable urban living and improving public health outcomes. Future steps will involve ensemble simulations, running multiple simulations with varied inputs or model configurations, to quantify uncertainties and provide probabilistic forecasts within the DSS framework.
Source link
Pierluigi Cau www.mdpi.com