1. Introduction
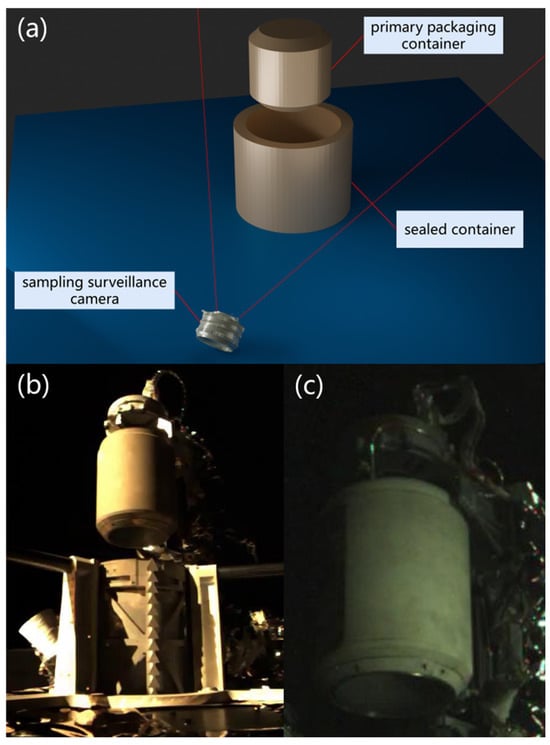
The primary packaging container was not directly inserted into the sealed container. Instead, it detached from the top displacement device through a controlled release and then descended into the sealed container. This required the alignment detection system on Chang’e-6 to be both highly accurate and stable, with a maximum permissible alignment error of 0.5 mm and a stability threshold of no less than 0.1 mm.
2. Approach
To address the issue of holes appearing in images captured during the rotation of primary packaging containers—which can lead to errors in image edge extraction and render traditional line fitting methods ineffective—a new approach has been developed. This technique specifically targets the unique features of these images, extracting the median line through bottom ellipse fitting of the primary packaging containers. Unlike previous methods, this approach remains robust even with container rotation, ensuring greater accuracy and reliability.
The lunar backlighting environment adds further complexity by creating multiple reflection points within images, which can compromise the accuracy of alignment detection. However, the bottom ellipse of the primary packaging container is relatively unaffected by these reflections, making it an effective reference for alignment detection. Despite this, the brightness of the bottom ellipse is typically lower and noisier than that of the side edge, which can reduce the accuracy of using an ellipse fitting method compared to a straight line fitting method. Therefore, under standard conditions, a straight line fitting approach is generally preferred. To optimize the process, an algorithm has been designed to adaptively select the most appropriate fitting method. This algorithm evaluates the presence of reflections and holes in the images to determine whether a straight line or ellipse fitting method is more suitable for each situation.
Furthermore, this paper addresses the challenge of detecting minor changes in two-dimensional images when the primary packaging container moves along the camera’s optical axis, with the relative position of the sealed container and the camera remaining unchanged. In such cases, the size ratio between the primary and sealed containers in the image can be used to calculate their median line alignment in the optical axis direction.
2.1. YOLO Object Recognition
2.2. Median Line Fitting in Straight Line
where , and represent the gradient magnitudes at three points, and is the maximum difference in gradient magnitude.
2.3. Median Line Fitting in Ellipse
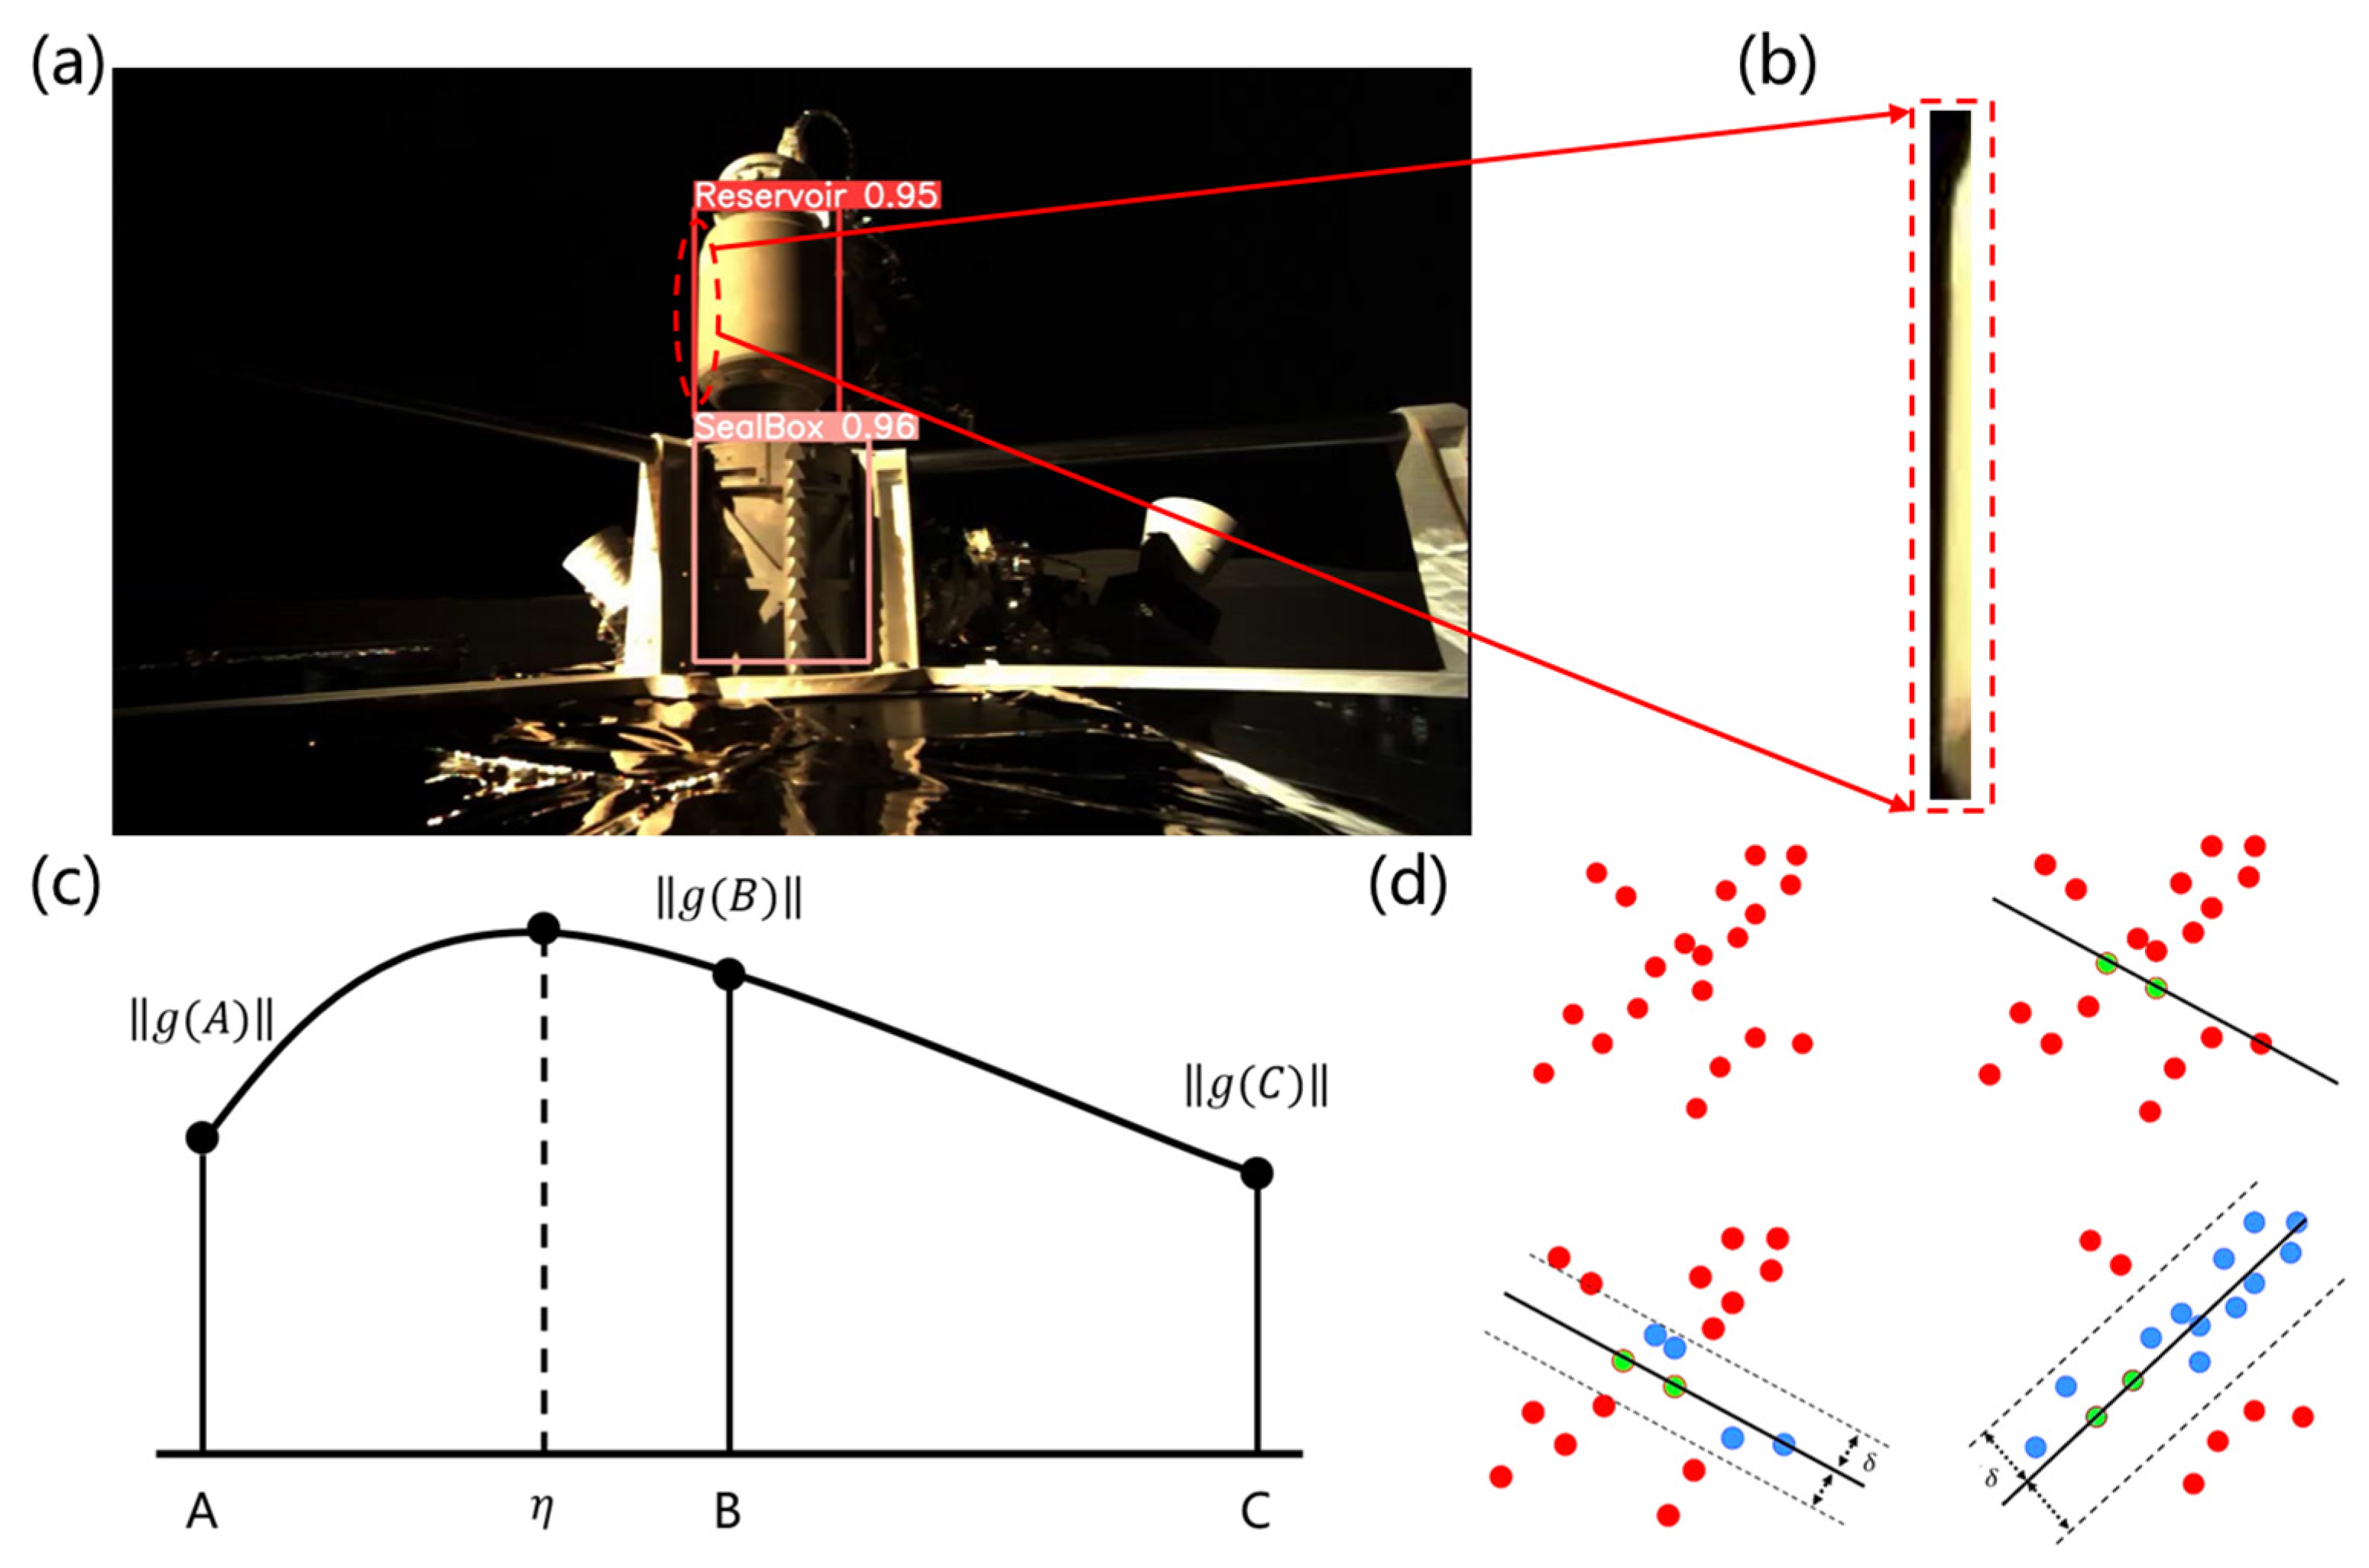
During the rotation of the primary packaging container, holes may appear in the elongated region of interest, leading to significant errors when fitting the midline with a straight line. To ensure accurate midline fitting, alternative methods must be considered. Since the round bottom of the primary packaging container appears as an ellipse in the image, the ellipse’s minor axis can be used to represent the midline of the primary packaging container.
where is the prior semi-major axis length, and is the weight of each candidate edge point.
2.4. Selection of Adaptive Median Line Fitting Algorithm
When the image of the primary packaging container exhibits holes or intense reflections, the mean and variance of the grayscale values will be either unusually high or low. By setting dual thresholds for these metrics, the system can automatically identify such anomalies.
During the initial assessment of the primary packaging container, the system calculates the mean and variance of the grayscale values within the specified elongated region of interest. These values are then compared to predetermined thresholds. If both metrics are within the acceptable range, a line fitting median is selected; otherwise, an ellipse fitting median is applied. This adaptive method ensures accurate alignment detection, regardless of the varying conditions of the images.
3. Experiment
To evaluate the effectiveness of the alignment detection algorithm, experiments were conducted using images of the primary packaging container captured in two different environments: a simulated lunar surface and the actual far side of the moon. The objective was to assess the algorithm’s performance under various conditions.
The experimental data is categorized into two parts. The first part consists of images obtained from Chang’e-6 on a simulated lunar surface, primarily used for training the YOLO model, designing initial algorithms for alignment detection, and evaluating the accuracy, precision, and robustness of the detection functions. The second part includes real images taken on the actual lunar surface.
3.1. Simulation of Lunar Surface Experiment
To test the alignment detection algorithm’s effectiveness and robustness, parameters such as the position, rotation angle, and light intensity of the primary packaging container were varied. The tests were conducted on Earth in a simulated lunar environment at the Aerospace Research Institute’s dedicated test facility. The test environment simulated various lunar conditions, including lunar soil simulation, terrain types, and drilling and sampling conditions. These simulations were designed to closely mimic the physical properties of the lunar surface and the challenges faced during actual lunar operations.
Analysis of 12 sets of image data revealed a mean value for the angle of 0.001 rad with a standard deviation of 0.001 rad. The mean value for the distance was 0.15 mm, with a standard deviation of 0.02 mm. These results suggest that, under consistent positioning and lighting conditions, the alignment detection algorithm exhibits high precision and stability with respect to rotation angle. This demonstrates the algorithm’s effectiveness in addressing issues such as holes appearing in primary packaging containers during rotation.
Analysis of 6 sets of image data showed that the mean value for the angle was 0.001 rad with a standard deviation of 0.001 rad. The mean value for the distance was 0.14 mm, with a standard deviation of 0.03 mm. These findings indicate that under consistent position and rotation angle conditions, the alignment detection algorithm is highly precise and robust to variations in light intensity. Moreover, the algorithm performs effectively even in low-light environments, successfully handling uneven lighting and reflections commonly encountered with primary packaging containers.
3.2. Practical Lunar Surface Results
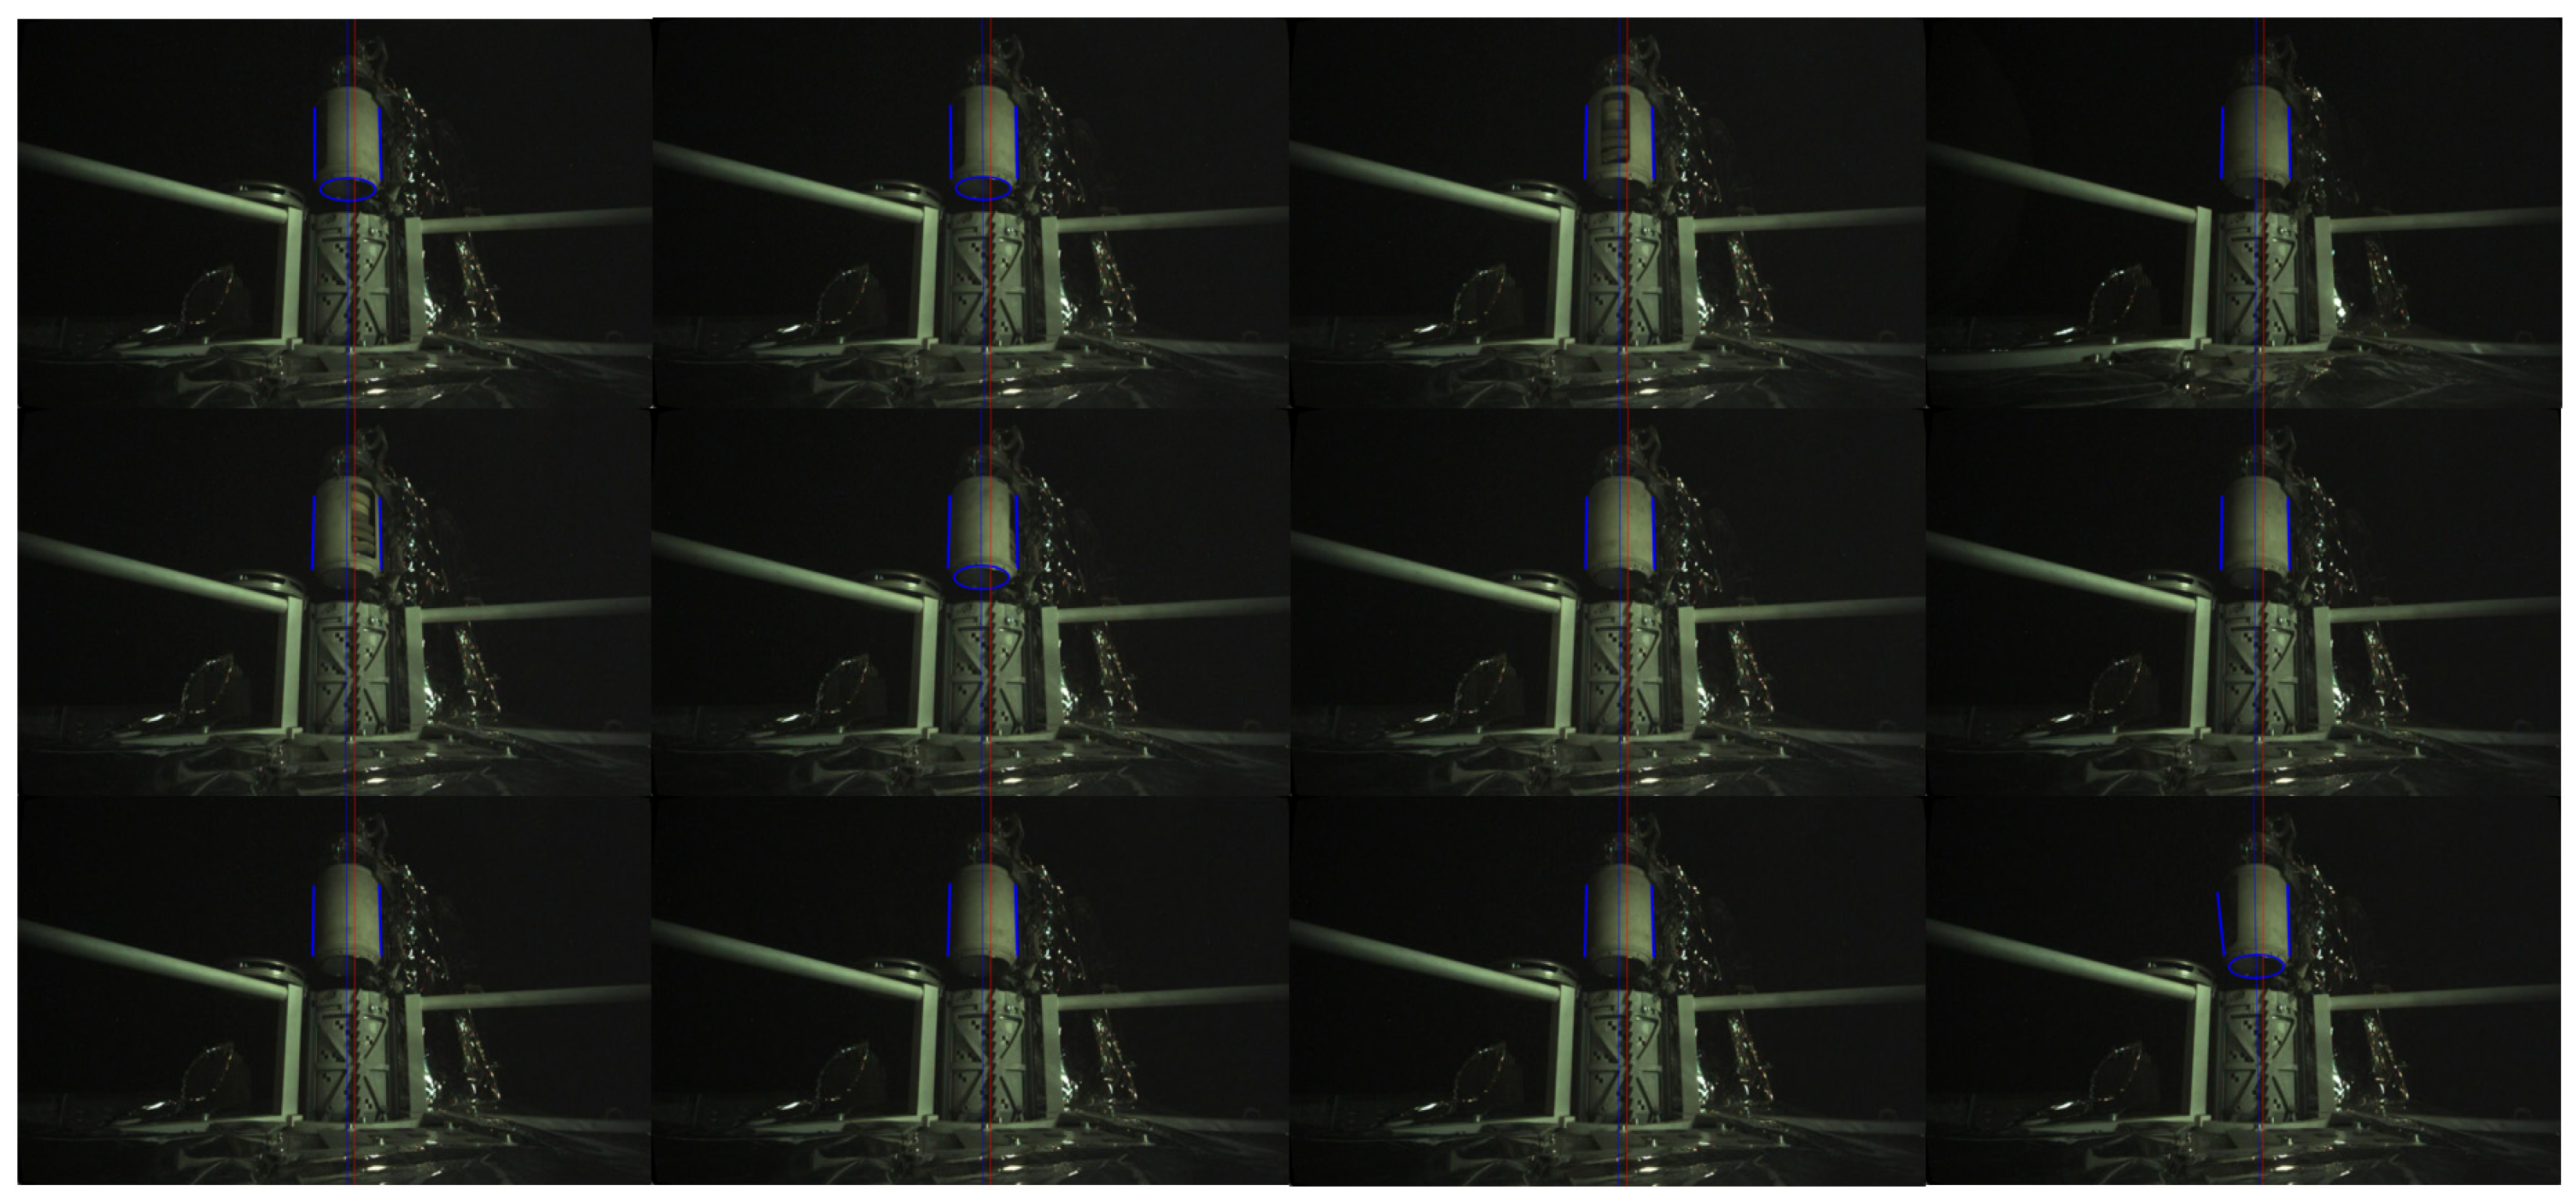
Analysis of the actual image alignment detection results indicated that no holes were present in the primary packaging container during sampling. However, due to uneven lighting conditions, the right side of the container appeared darker, leading to less accurate edge detection. As a result, the method of fitting the median line using the elliptical base of the primary packaging container was chosen over the straight-edge fitting method.
Analysis of 12 sets of image data revealed a mean orthogonal angle of 0.002 rad with a standard deviation of 0.001 rad. The mean orthogonal distance was 0.28 mm, with a standard deviation of 0.03 mm. These results suggest that the alignment detection algorithm achieves high precision and stability in actual lunar surface environments, with detection accuracy not less than 0.5 mm and stability not less than 0.1 mm, thus meeting task requirements. However, due to uncontrollable factors present in field images of the lunar surface, the accuracy is slightly lower than that achieved in simulated lunar environments.
The successful application of this detection technology enabled precise alignment detection of the primary packaging container and sealed container after Chang’e-6 sampled on the far side of the Moon, marking the successful completion of the mission.
4. Conclusions
To meet the alignment requirements and address the practical challenges of the primary packaging container in the Chang’e-6 lunar surface autonomous sampling mission, we developed a detection technique that combines both linear and elliptical midline fitting methods. This technique leverages YOLO target recognition on images captured by the Chang’e-6 sampling surveillance camera to identify and extract regions of interest for the primary and sealed containers. By analyzing grayscale mean and variance against dual thresholds, the method determines whether to employ linear or elliptical midline fitting. Edge extraction is then performed within these regions, and the parameters are derived using RANSAC fitting, either linear or elliptical. These parameters are used to calculate the midlines of the primary and sealed containers, which are compared to a reference image to evaluate their relative angles and distances. This process ensures precise container alignment and facilitates the adjustment of the primary packaging container for optimal alignment.
The algorithm’s performance was assessed using images from both a simulated lunar surface and the actual far side of the Moon. For the real lunar surface images, the mean corrected angle was 0.002 rad with a standard deviation of 0.001 rad, and the mean corrected distance was 0.28 mm with a standard deviation of 0.03 mm. These results confirm that the algorithm achieves the necessary precision and stability, demonstrating its effectiveness and reliability for alignment detection in both simulated and real lunar environments.
Author Contributions
Conceptualization, Y.Q., S.J. and X.D.; methodology, G.W. and Y.Q.; software, G.W.; validation, G.W. and Y.Q.; formal analysis, Y.Q., S.J. and X.D.; investigation, G.W. and Y.Q.; resources, S.J. and X.D.; data curation, G.W., S.J. and X.D.; writing—original draft preparation, G.W.; writing—review and editing, Y.Q.; visualization, G.W.; supervision, Y.Q., S.J. and X.D.; project administration, Y.Q., S.J. and X.D.; funding acquisition, S.J. and X.D. All authors have read and agreed to the published version of the manuscript.
Funding
This research received no external funding.
Institutional Review Board Statement
Not applicable.
Informed Consent Statement
Not applicable.
Data Availability Statement
Data underlying the results presented in this paper are not publicly available at this time but may be obtained from the authors upon reasonable request.
Acknowledgments
The authors thank the Institute of Spacecraft System Engineering, China Academy of Space Technology for providing image data to conduct this research.
Conflicts of Interest
The authors declare no conflicts of interest.
References
- Zeng, X.; Liu, D.; Chen, Y.; Zhou, Q.; Ren, X.; Zhang, Z.; Yan, W.; Chen, W.; Wang, Q.; Deng, X.; et al. Landing site of the Chang’e-6 lunar farside sample return mission from the Apollo basin. Nat. Astron. 2023, 7, 1188–1197. [Google Scholar] [CrossRef]
- Lezama, J.; Morel, J.-M.; Randall, G.; von Gioi, R.G. A contrario 2d point alignment detection. IEEE Trans. Pattern Anal. Mach. Intell. 2014, 37, 499–512. [Google Scholar] [CrossRef] [PubMed]
- Zhang, K.; Zhang, Z.; Li, Z.; Qiao, Y. Joint face detection and alignment using multitask cascaded convolutional networks. IEEE Signal Process. Lett. 2016, 23, 1499–1503. [Google Scholar] [CrossRef]
- Battiato, S.; Farinella, G.M.; Messina, E.; Puglisi, G. Robust image alignment for tampering detection. IEEE Trans. Inf. Forensics Secur. 2012, 7, 1105–1117. [Google Scholar] [CrossRef]
- Bochkovskiy, A.; Wang, C.Y.; Liao, H.Y.M. Yolov4: Optimal speed and accuracy of object detection. arXiv 2020, arXiv:2004.10934. [Google Scholar]
- Canny, J. A computational approach to edge detection. IEEE Trans. Pattern Anal. Mach. Intell. 1986, 8, 679–698. [Google Scholar] [CrossRef] [PubMed]
- Ziou, D.; Tabbone, S. Edge detection techniques-an overview. Pacnoзнaвaнue Oбpaзoв Aнaлuз Изoбpaжeн/Pattern Recognit. Image Anal. Adv. Math. Theory Appl. 1998, 8, 537–559. [Google Scholar]
- Maini, R.; Aggarwal, H. Study and comparison of various image edge detection techniques. Int. J. Image Process. (IJIP) 2009, 3, 1–11. [Google Scholar]
- Stojmenovic, M.; Nayak, A. Direct ellipse fftting and measuring based on shape boundaries. In Advances in Image and Video Technology, Proceedings of the Second Paciffc Rim Symposium, PSIVT 2007 Santiago, Chile, 17–19 December 2007; Proceedings 2; Springer: Berlin/Heidelberg, Germany, 2007; pp. 221–235. [Google Scholar]
- Rossi, L.; Karimi, A.; Prati, A. A novel region of interest extraction layer for instance segmentation. In Proceedings of the 2020 25th International Conference on Pattern Recognition (ICPR), Milan, Italy, 10–15 January 2021; IEEE: Piscataway, NJ, USA, 2021; pp. 2203–2209. [Google Scholar]
- Raffee, G.; Dlay, S.S.; Woo, W.L. Region-of-interest extraction in low depth of ffeld images using ensemble clustering and difference of Gaussian approaches. Pattern Recognit. 2013, 46, 2685–2699. [Google Scholar] [CrossRef]
- Liu, Z.; Chen, W.; Zou, Y.; Hu, C. Regions of interest extraction based on HSV color space. In Proceedings of the IEEE 10th International Conference on Industrial Informatics, Beijing, China, 25–27 July 2012; IEEE: Piscataway, NJ, USA, 2012; pp. 481–485. [Google Scholar]
- Redmon, J.; Divvala, S.; Girshick, R.; Farhadi, A. You only look once: Uniffed, real-time object detection. In Proceedings of the IEEE Conference on Computer Vision and Pattern Recognition, Las Vegas, NV, USA, 27–30 June 2016; pp. 779–788. [Google Scholar]
- Jiang, P.; Ergu, D.; Liu, F.; Cai, Y.; Ma, B. A Review of Yolo algorithm developments. Procedia Comput. Sci. 2022, 199, 1066–1073. [Google Scholar] [CrossRef]
- Ge, Z.; Liu, S.; Wang, F.; Li, Z.; Sun, J. Yolox: Exceeding yolo series in 2021. arXiv 2021, arXiv:2107.08430. [Google Scholar]
- Neubeck, A.; Van Gool, L. Efffcient non-maximum suppression. In Proceedings of the 18th International Conference on Pattern Recognition (ICPR’06), Hong Kong, China, 20–24 August 2006; IEEE: Piscataway, NJ, USA, 2006; Volume 3, pp. 850–855. [Google Scholar]
- Hosang, J.; Benenson, R.; Schiele, B. Learning non-maximum suppression. In Proceedings of the IEEE Conference on Computer Vision and Pattern Recognition, Honolulu, HI, USA, 21–26 July 2017; pp. 4507–4515. [Google Scholar]
- Trujillo-Pino, A.; Krissian, K.; Alemán-Flores, M.; Santana-Cedrés, D. Accurate subpixel edge location based on partial area effect. Image Vis. Comput. 2013, 31, 72–90. [Google Scholar] [CrossRef]
- Renshaw, D.T.; Christian, J.A. Subpixel localization of isolated edges and streaks in digital images. J. Imaging 2020, 6, 33. [Google Scholar] [CrossRef] [PubMed]
- Devernay, F. A Non-Maxima Suppression Method for Edge Detection with Sub-Pixel Accuracy; INRIA: Le Chesnay-Rocquencourt, France, 1995. [Google Scholar]
- Bolles, R.C.; Fischler, M.A. A RANSAC-based approach to model fftting and its application to ffnding cylinders in range data. In Proceedings of the IJCAI, Vancouver, BC, Canada, 24–28 August 1981; pp. 637–643. [Google Scholar]
- Choi, S.; Kim, T.; Yu, W. Performance evaluation of RANSAC family. J. Comput. Vis. 1997, 24, 271–300. [Google Scholar]
(a) Schematic diagram of hardware setup for alignment detection. (b) Primary packaging container and sealed container. (c) Hole in primary packaging container.
Figure 1.
(a) Schematic diagram of hardware setup for alignment detection. (b) Primary packaging container and sealed container. (c) Hole in primary packaging container.
Schematic diagram of the algorithm. (a) Real image of Chang’e-6. (b) YOLO object recognition image. (c) Median line fitting result in straight line. (d) Median line fitting result in ellipse.
Figure 2.
Schematic diagram of the algorithm. (a) Real image of Chang’e-6. (b) YOLO object recognition image. (c) Median line fitting result in straight line. (d) Median line fitting result in ellipse.

Schematic diagram of the algorithm. (a) Processing result of the YOLO algorithm. (b) Long strip-shaped region of interest. (c) Principal diagram of the Devernay subpixel edge extraction algorithm. (d) Simplified schematic diagram of the RANSAC algorithm.
Figure 3.
Schematic diagram of the algorithm. (a) Processing result of the YOLO algorithm. (b) Long strip-shaped region of interest. (c) Principal diagram of the Devernay subpixel edge extraction algorithm. (d) Simplified schematic diagram of the RANSAC algorithm.

(a) Results of the line fitting median. (b) Results of the ellipse fitting median.
Figure 4.
(a) Results of the line fitting median. (b) Results of the ellipse fitting median.

Comparison of alignment detection results at different rotational angles of the primary packaging container.
Figure 5.
Comparison of alignment detection results at different rotational angles of the primary packaging container.

Comparison of alignment detection results at different light intensities of primary packaging container.
Figure 6.
Comparison of alignment detection results at different light intensities of primary packaging container.

Alignment detection results from Chang’e-6’s lunar mission.
Figure 7.
Alignment detection results from Chang’e-6’s lunar mission.

Table 1.
Impact of Different Rotation Angles on the Alignment Detection Results in Primary Packaging Container.
Table 1.
Impact of Different Rotation Angles on the Alignment Detection Results in Primary Packaging Container.
| Serial Number | Angle (rad) | Distance (mm) |
|---|---|---|
| 1 | 0.002 | 0.17 |
| 2 | 0.002 | 0.17 |
| 3 | 0.001 | 0.12 |
| 4 | 0.001 | 0.12 |
| 5 | 0.001 | 0.15 |
| 6 | 0.001 | 0.18 |
| 7 | 0.001 | 0.13 |
| 8 | 0.001 | 0.15 |
| 9 | 0.002 | 0.12 |
| 10 | 0.001 | 0.14 |
| 11 | 0.001 | 0.13 |
| 12 | 0.002 | 0.17 |
Table 2.
Impact of Different Light Intensities of Alignment Detection Results in Primary Packaging Container.
Table 2.
Impact of Different Light Intensities of Alignment Detection Results in Primary Packaging Container.
| Serial Number | Angle (rad) | Distance (mm) |
|---|---|---|
| 1 | 0.001 | 0.10 |
| 2 | 0.001 | 0.11 |
| 3 | 0.001 | 0.15 |
| 4 | 0.002 | 0.17 |
| 5 | 0.002 | 0.16 |
| 6 | 0.001 | 0.15 |
Table 3.
Impact of Different Conditions on Alignment Detection Results in Primary Packaging Container.
Table 3.
Impact of Different Conditions on Alignment Detection Results in Primary Packaging Container.
| Serial Number | Angle (rad) | Distance (mm) |
|---|---|---|
| 1 | 0.001 | 0.29 |
| 2 | 0.002 | 0.28 |
| 3 | 0.003 | 0.22 |
| 4 | 0.003 | 0.25 |
| 5 | 0.003 | 0.27 |
| 6 | 0.003 | 0.29 |
| 7 | 0.001 | 0.32 |
| 8 | 0.001 | 0.28 |
| 9 | 0.001 | 0.29 |
| 10 | 0.001 | 0.28 |
| 11 | 0.001 | 0.29 |
| 12 | 0.001 | 0.32 |
Disclaimer/Publisher’s Note: The statements, opinions and data contained in all publications are solely those of the individual author(s) and contributor(s) and not of MDPI and/or the editor(s). MDPI and/or the editor(s) disclaim responsibility for any injury to people or property resulting from any ideas, methods, instructions or products referred to in the content. |
Source link
Guanyu Wang www.mdpi.com

