
3.2. Selection of Main Control Factor Indicators
The analytic hierarchy process (AHP) is a multi-criteria decision-making method. The fundamental principle of AHP is to decompose the elements related to decision-making into a progressive three-level hierarchy—the objective level, the criterion level, and the decision alternative level—constructing a model with a hierarchical structure [27]. The AHP uses the numbers 1 to 9 and their reciprocals as a scale to define a judgment matrix, from which the weights of each factor within a hierarchy are derived. It also performs a consistency check on the hierarchy, calculating the consistency ratio (CR). If the CR is less than 0.10, the consistency of the judgment matrix is considered acceptable; otherwise, appropriate adjustments should be made. Based on an in-depth analysis of actual geological data and in conjunction with expert opinions, effective borehole data are statistically compiled, and factors such as aquifer thickness, lithological combination index, core recovery rate, specific discharge, permeability coefficient, flush fluid consumption, and weathering influence index are selected as the main controlling factors for evaluating the water richness of the No. 2 coal seam roof weathered bedrock aquifer31. This paper categorizes the geological elements that can affect the weathered bedrock aquifer in the roof of coal seams into three levels. The objective level (Level A) is the evaluation result of the water richness of the weathered bedrock aquifer. The criterion level (Level B) includes characteristic elements such as the hydrologic field, lithological field, and degree of weathering. The decision-making level (Level C) consists of the secondary sub-factors under each characteristic element in the criterion level (Figure 4).
The unit yield is the most direct indicator of an aquifer’s ability to store water. It represents the volume of water that flows out from a well during a pumping test for every 1 m decrease in water level [28]. The larger the unit yield value, the stronger the aquifer’s water richness. Within the distribution range of the No. 2 coal seam, the unit yield in the central area ranges from 0.10 L/s·m to 1.00 L/s·m, indicating moderate water richness. In most of the western and eastern areas, the unit yield is less than 0.10 L/s·m, which is considered to have weak water richness. Only in the central area near the erosion boundary does the unit yield exceed 1.00 L/s·m, indicating strong water richness, with the maximum unit yield from a well reaching approximately 3.70 L/s·m (Figure 5).
Permeability coefficient refers to the unit flow rate under a unit hydraulic gradient in a soil or rock mass, and it is an indicator that reflects the permeability of the soil or rock. A higher permeability coefficient indicates greater connectivity and permeability of the rock mass, resulting in higher water richness [29]. A lower coefficient suggests poor connectivity and permeability, indicating weaker water richness. Within the distribution range of the No. 2 coal seam, the permeability coefficient is relatively lower in the western and northeastern parts, while it is comparatively higher in the eastern part. There is a general trend of increasing permeability coefficients from west to east across the entire study area. The weathered bedrock in the entire research area is classified as having weak to extremely high permeability (Figure 6).
Flushing fluid consumption can serve as an important indicator reflecting the degree of fracture development in an aquifer, and it also demonstrates the hydraulic properties and permeability of the rock strata penetrated by the drill hole. The loss zone of wash fluid typically indicates areas where the groundwater is abundant due to well-developed voids and fractures, indirectly reflecting the water richness of the rock strata. Within the distribution range of the No. 2 coal seam, the consumption of wash fluid is relatively low in the majority of the western area. Areas with high consumption of wash fluid are primarily distributed near the erosion boundaries in the northeast and southeast. In some local areas of the northeast, the consumption of wash fluid exceeds 1.00 m3/h. The consumption of wash fluid gradually decreases from the west towards the northeast and southeast erosion boundaries (Figure 7).
Rocks tend to develop numerous joints and fractures after being subjected to weathering, which increases their porosity and permeability. Generally, the thicker the weathered bedrock, the greater the storage space within the unit thickness of the aquifer, and consequently, the stronger the water richness; the more intense the weathering, the more developed the joints and fractures, and the stronger the water richness. Due to the differential weathering in the study area, the central part, as well as some local areas along the northern and southern boundaries, exhibit stronger weathering, while other regions show weaker weathering (Figure 8).
where is the thickness of strata with different degrees of weathering. is the intensity of rock weathering, which is assigned values of 3, 2, and 1 according to strong, moderate, and weak weathering, respectively.
The weathered bedrock aquifer acts as a primary reservoir for groundwater. The greater the thickness of the water-bearing stratum, the more space is available for storing groundwater. When other influencing factors are held constant, the water richness is stronger with a thicker aquifer, and weaker with a thinner one. Within the distribution area of the No. 2 coal seam, the weathered bedrock is considerably thicker in the northwest and southwest, reaching up to approximately 78.00 m in some areas. In contrast, the northeast experiences severe erosion, with the weathered bedrock generally being less than 30.00 m thick (Figure 9).
Due to the differences in mechanical properties among various types of rocks, they exhibit distinct responses when subjected to stress. Different structural coefficients are assigned to different types of rocks, reflecting the grain size of the rock strata, with the structural coefficient generally being positively correlated with the grain size of the rock. The lithological combination index (z) is a quantitative indicator used to describe its impact on the water production of weathered bedrock aquifers. The calculation method is to quantify the impact of different rock layers on water production and combine their proportions in the thickness of the aquifer to obtain the lithological combination index (Equation (11)). The lithological combination index is relatively large in the southern and northern mining boundaries and the central part of the erosion boundary within the No. 2 coal seam, with good conditions for fracture development. Typically, the lithological combination index exceeds 0.6 in these zones. Conversely, in the central and northeastern sectors, the index is comparatively reduced, exhibiting a progressive decline as one moves from the southern and northern areas toward the western and northeastern regions. (Figure 10).
where z is the lithological combination index. is the thickness of coarse sandstone, medium sandstone, fine sandstone, siltstone, sandy mudstone, and mudstone, respectively. is the structural coefficient, which is assigned values based on the grain size of the rock, 1 for the coarsest grain size, 0.8 for the next, 0.6, 0.4, 0.3, and 0.2 for the finest grain size.
The core recovery percentage is the ratio of the length of the core drilled to the depth of the drilling in the drilling operation. The core recovery rate can effectively reflect the integrity of the corresponding rock stratum. Generally, the core recovery rate is negatively correlated with the water-charging capacity of the aquifer; the lower the core recovery rate, the higher the degree of rock fragmentation, indicating well-developed fractures, which in turn leads to stronger water richness. There is a significant variation in the distribution of the core recovery rate in the weathered bedrock aquifer. In the central and some scattered areas in the northeast, the core recovery rate is relatively low, below 60.00%, suggesting that the weathered bedrock in these areas is fragmented with well-developed fractures, corresponding to strong water richness. In contrast, in most areas of the west and some local areas on the eastern boundary, the core recovery rate is greater than 80.00%, indicating weaker water richness in these regions (Figure 11).
3.3. Determination of Partition Variable Weight
By studying the main controlling factors of the rechargeability of the weathered bedrock aquifer, analyzing the actual conditions of mining, and incorporating the opinions of relevant scholars and experts, a 9-point scale method is employed to quantify the relative importance among each attribute type and among the main controlling factors within the same attribute. This results in judgment matrices at various levels, which are then subjected to consistency tests. Ultimately, the constant weights of the main controlling factors of the rechargeability of the weathered bedrock aquifer are obtained (Table 1, Table 2 and Table 3).
The consistency ratio (CR) and consistency index (CI) calculated from each set of judgment matrices are all less than 0.1, indicating that the judgment matrices have satisfactory consistency and have passed the consistency test. The weight values of the main controlling factors in the study of the water richness zoning of the weathered bedrock aquifer have been ultimately determined (Table 4).
Taking the thickness of the weathered bedrock aquifer as an example, this section provides a detailed explanation of the iterative classification calculation. By applying the K-means algorithm and analyzing the normalized data of the thickness indicator of the weathered bedrock aquifer, the initial cluster analysis is presented in Table 5. The process of changes in the iterative cluster centers is shown in Table 6. The specific iterative data can be found in Table 7 and Table 8, and the results of the variance analysis are provided in Table 9.
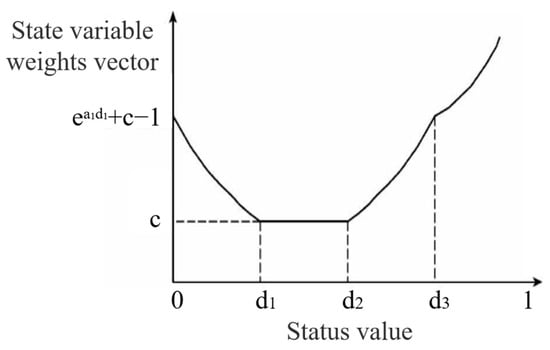
Through the process of cluster grading, the normalized classification threshold values for the thickness of the weathered bedrock aquifer in the roof of the No. 2 coal seam can be obtained as follows: 0.2051, 0.2308, 0.3846, 0.4103, 0.5897, and 0.6154. Based on the established classification threshold values, the thresholds for the variable-weight intervals are further determined to be 0.2436, 0.4231, and 0.6036. Using the same clustering method, the variable-weight interval thresholds for other main controlling factors after normalization are calculated. Table 10 shows the results of these calculations.
The characteristic factors categorized within the variable-weight intervals are the core recovery rate, weathered bedrock thickness, wash fluid consumption, and permeability coefficient. The characteristic factor assigned to the penalty interval is the weathering impact index. The characteristic factors placed in the neutral interval, where there is neither penalty nor incentive, are the unit water inflow and the lithological combination index. Table 11 is the normalized index values of these characteristic factors.
Based on the constructed zoned variable-weight model, the variable-weight values of different influencing factors in each zone are calculated to achieve a redistribution of weights. Ultimately, the weight values of various influencing factors are obtained, which vary with the changes in the indicator values of the factors within the different combinations of states in each zone. The variable-weight values are presented in Table 12.
Figure 12 presents the recharge evaluation map for the weathered bedrock aquifer situated within the overburden of the No. 2 coal seam at the Hongliulin coal mine, utilizing a zoned variable-weighting approach. The recharge capacity of the weathered bedrock exhibits spatial variability. Within the confines of the No. 2 coal seam, there is a discernible gradient in recharge intensity, with an increase from the central region towards the northern and southern extremities. Zones characterized by moderate to substantial recharge are predominantly located in the central–northern and southern sections. Regions of intense recharge are predominantly found along the northern and southern mining boundaries, as well as the southeastern erosional boundary. Furthermore, the western expanse and select areas within the central and northeastern regions exhibit comparatively diminished recharge levels, categorizing them as weak and very weak recharge zones, respectively.
Source link
Yanping Miao www.mdpi.com