
1. Introduction
The broader objective of this study is to contribute to the ongoing discussions about the future of automotive technologies as the industry transitions toward electrification and away from traditional gasoline-powered vehicles. Through a combination of rigorous simulation and in-depth cost analysis, this article offers valuable insights into the potential benefits and challenges of advanced vehicle technologies. The findings aim to inform policymakers, manufacturers, and researchers about the opportunities for accelerating the shift to sustainable transportation solutions.
2. Procedure
The simulation framework is divided into three critical steps:
- Assumptions collection: The first step involves gathering detailed assumptions regarding powertrain technology progress from publicly available U.S. DOE-VTO targets and reports [14,17]. This includes parameters like engine efficiency, battery energy density, electric motor specific power, and advancements in lightweighting technologies. These assumptions form the foundation for the vehicle models developed in this study. The data in Table 1 were sourced from government reports, including DOE vehicle performance targets, ICCT studies on electrification trends [8], and industry benchmarks [12,13]. These data ensure alignment with state-of-the-art knowledge in powertrain technologies.
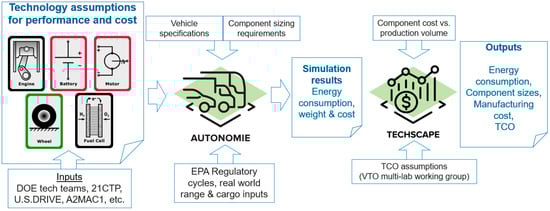
- Powertrain and vehicle simulation: In the second step, the Autonomie vehicle system simulation tool [18] is employed to size powertrain components and build the vehicle models from the ground up, using the collected assumptions. The tool simulates energy consumption based on different vehicle types—conventional internal combustion engine (ICs) vehicles, hybrid electric vehicles (HEVs), plug-in hybrid electric vehicles (PHEVs), and battery electric vehicles (BEVs)—and applies the U.S. DOE-VTO performance targets. Autonomie ensures that the simulated vehicles meet critical specifications like 0–60 mph acceleration time, gradeability, and maximum speed. The energy consumption is calculated over standard regulatory drive cycles such as the UDDS, FTP, and US06 cycles [15,20].
- Cost evaluation: The final step utilizes the TechScape tool to compute the manufacturing cost and total cost of ownership (TCO) of the vehicles. By combining the outputs of Autonomie with cost estimates for advanced powertrain components—such as electric machines and batteries—the TCO analysis provides a comprehensive economic perspective on the potential adoption of advanced vehicle technologies using TechScape [19].
The detailed examination of these assumptions, particularly for future years like 2035 and 2050, allows for a comprehensive understanding of how powertrain technologies are expected to progress. The methodology provides a solid foundation for the subsequent analysis of vehicle sizing, energy consumption, and cost.
2.1. Autonomie Vehicle Modeling
Autonomie employs a physics-based modeling approach to simulate energy flows and performance across powertrain components. The tool integrates vehicle-specific parameters (e.g., weight, aerodynamics, drivetrain) with regulatory drive cycles (UDDS, FTP, US06) to calculate fuel economy, energy consumption, and performance metrics. The primary assessment indicators used in this study include:
Fuel consumption: measured in L/100 km or kWh/100 km for electrified powertrains.
Powertrain power: calculated as the required engine or motor output in kW.
Component costs: focused on manufacturing costs of batteries and electric motors.
Total cost of ownership (TCO): a metric integrating vehicle purchase price, maintenance, and energy consumption.
Simulations were conducted on a high-performance computing system, ensuring accurate and scalable modeling across timeframes and vehicle configurations.
The key parameter settings for vehicle modeling and simulation included:
Battery energy density: projected to increase from 189 Wh/kg (2023) to 337 Wh/kg (2050) based on DOE-VTO performance targets.
Electric motor efficiency: improved from 90% (2023) to 95% (2050).
Vehicle weight: assumes reductions of 10–20% due to lightweighting strategies, such as the use of high-strength steel and composites.
Drive cycles: standardized regulatory cycles (UDDS, FTP, US06) were used to ensure consistent evaluation of fuel economy and emissions.
These parameter assumptions are derived from DOE reports, industry benchmarks, and peer-reviewed literature. This setup allows for a detailed analysis of the performance and cost trajectories of advanced powertrains across multiple timeframes.
2.2. Vehicle and Components Sizing
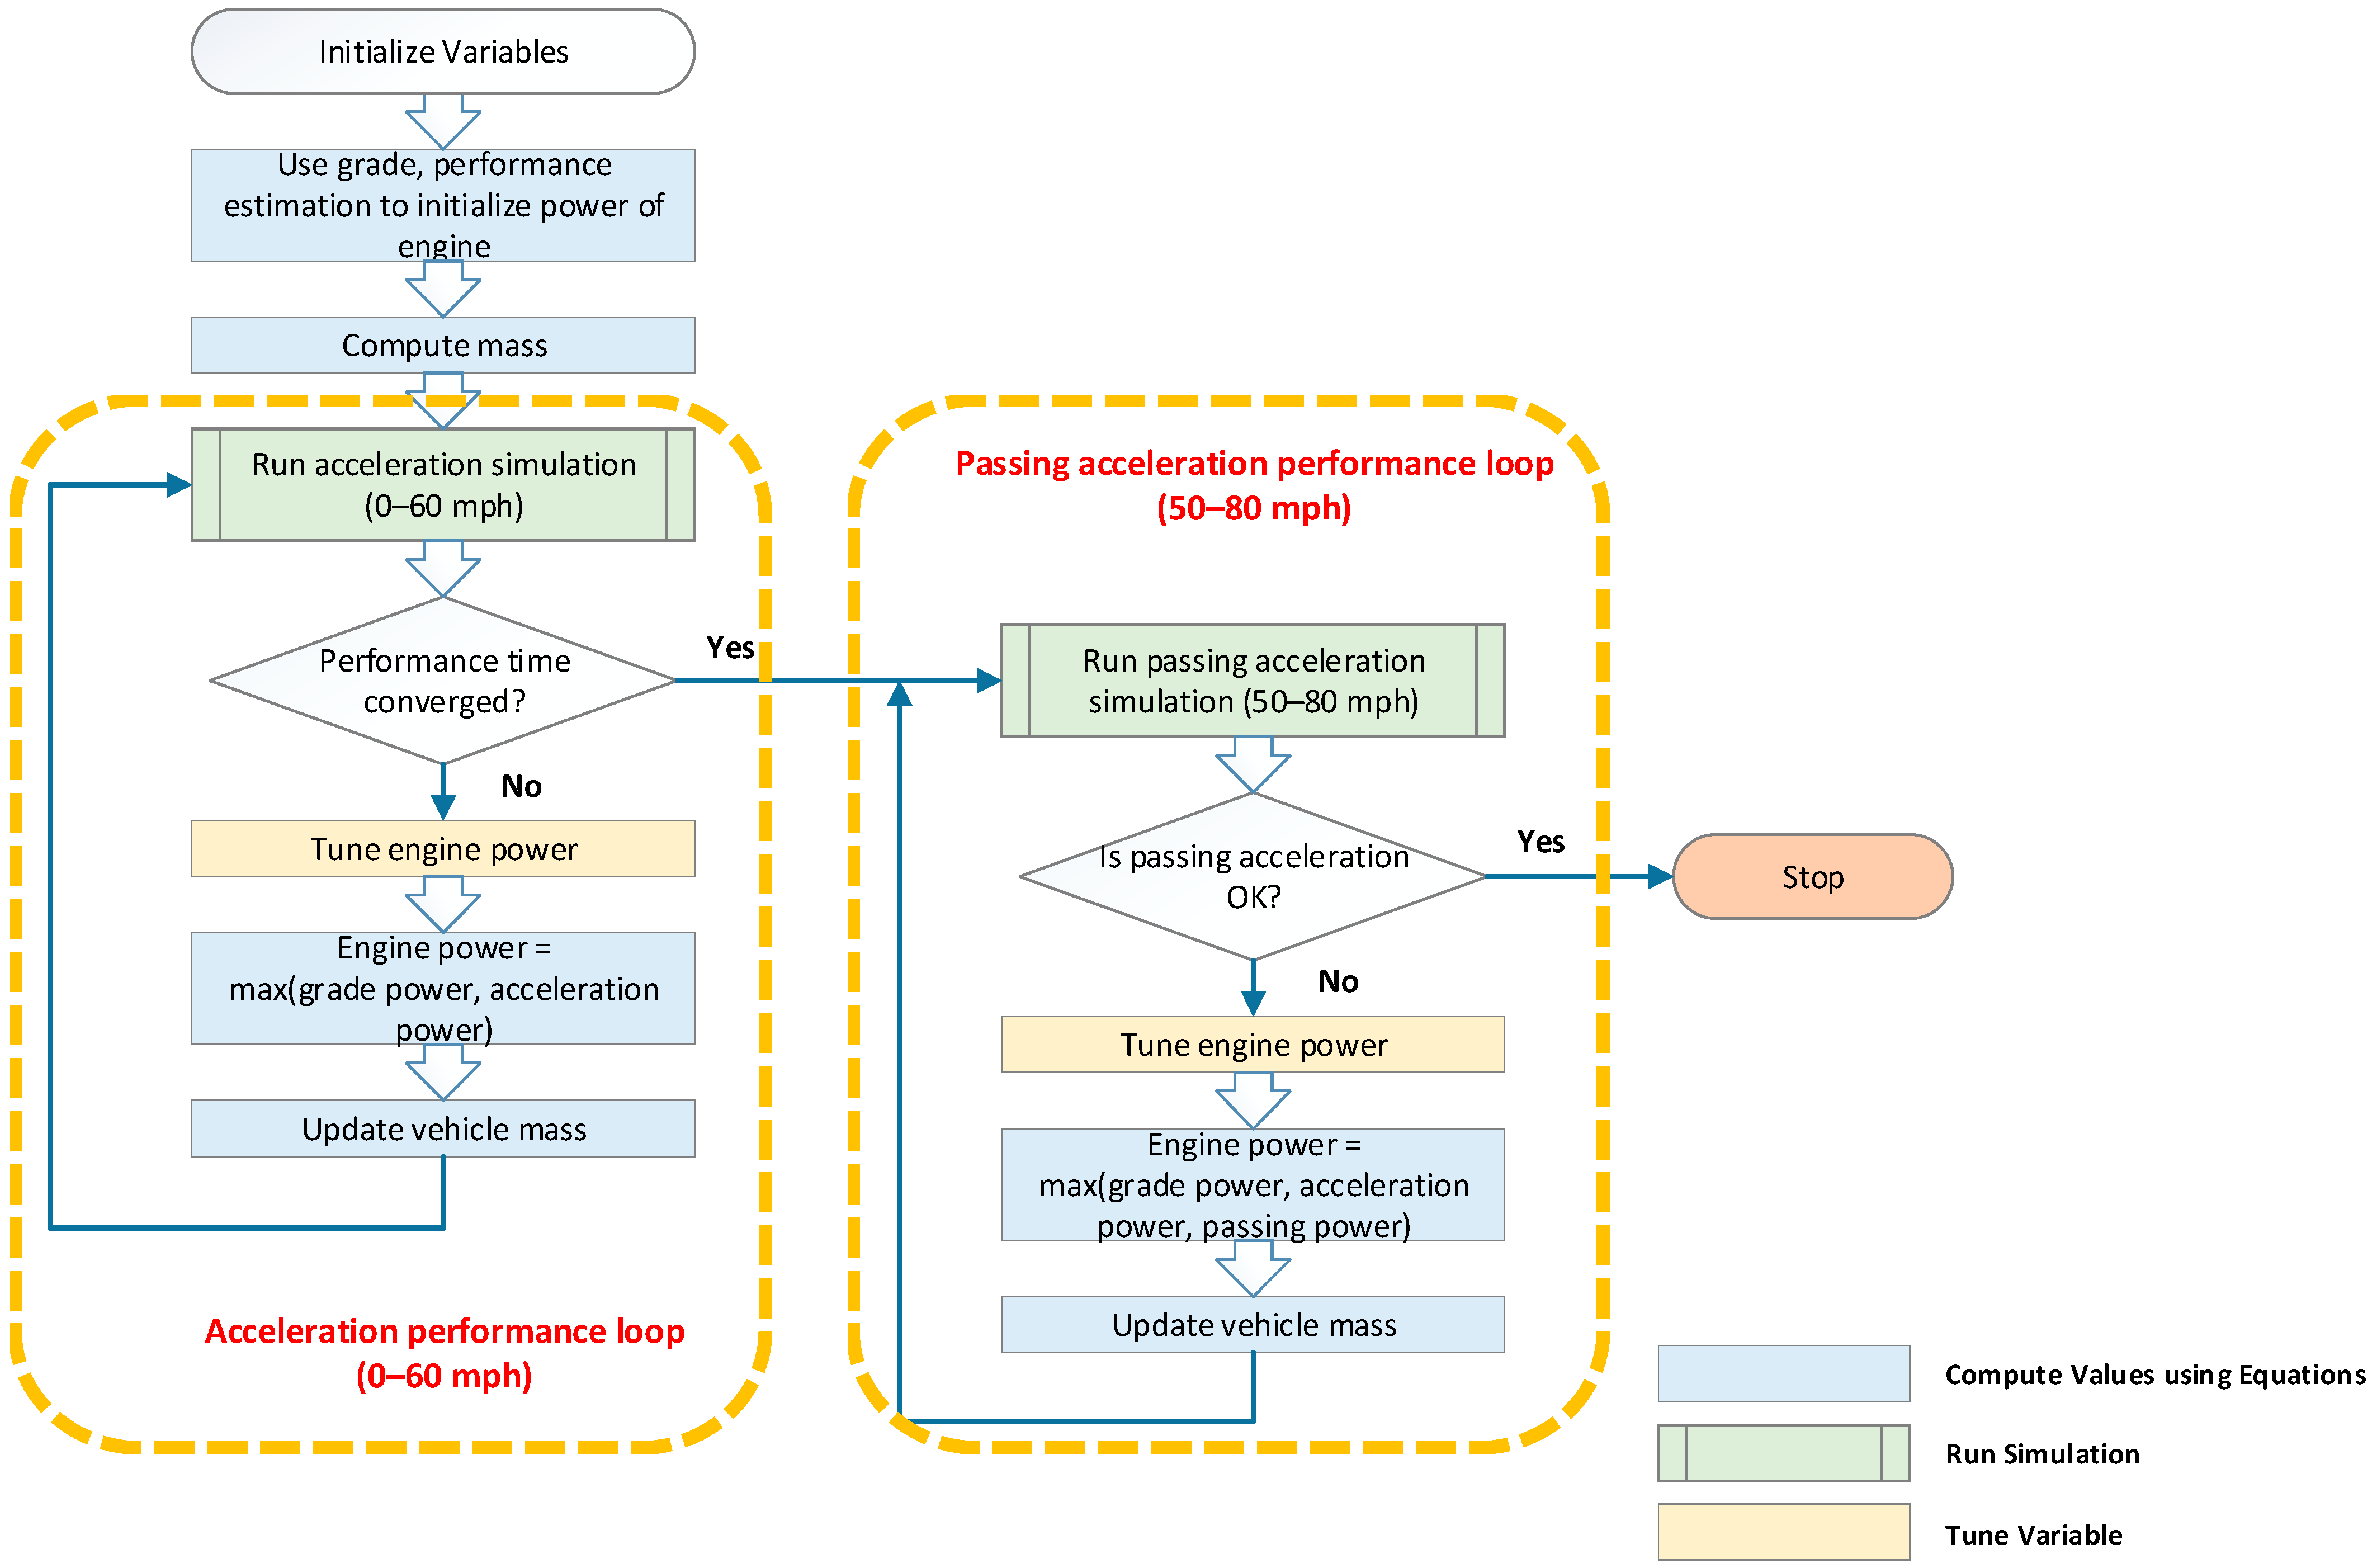
The sizing process is highly iterative. The vehicle models are built from the ground up, with every component from the engine to the battery pack being designed to meet specific performance criteria. For instance, the engine power is sized to meet the acceleration and gradeability targets for conventional vehicles while the electric motor and battery pack are sized to capture all of the regenerative braking energy for hybrid vehicles. This iterative process ensures that each assumption (e.g., specific power, efficiency) influences key vehicle characteristics (e.g., curb weight, energy consumption) and that the system converges after 5 to 10 iterations to meet all specifications.
For HEVs, the sizing process assumes that the electric machine and battery are capable of capturing all regenerative energy from the Urban Dynamometer Driving Schedule (UDDS) cycle. The internal combustion engine and electric generator are then sized to meet gradeability and performance requirements, ensuring that the vehicle meets all acceleration and load-bearing targets.
For PHEVs, which operate with a specific electric-only range (e.g., 20 or 50 miles of all-electric range, AER), the power levels of the electric machine and battery are designed to ensure that the vehicle can operate in electric mode for the duration of the US06 cycle, which represents more aggressive driving conditions. While the sizing process is primarily concerned with ensuring that the vehicle meets these performance targets, a blended control strategy is used during energy consumption assessments to optimize overall performance.
This sizing methodology, combined with the advanced simulation tools employed in this study, allows for a robust evaluation of future vehicle performance across multiple powertrain types and electrification levels.
3. Results and Observations
This section presents a detailed examination of the simulation results, highlighting the sizing of key components and their impact on fuel economy and cost. By simulating vehicles across a range of powertrains and performance categories, the results offer a clear perspective on the evolving role of electrification and powertrain advancements.
3.1. Component Sizes
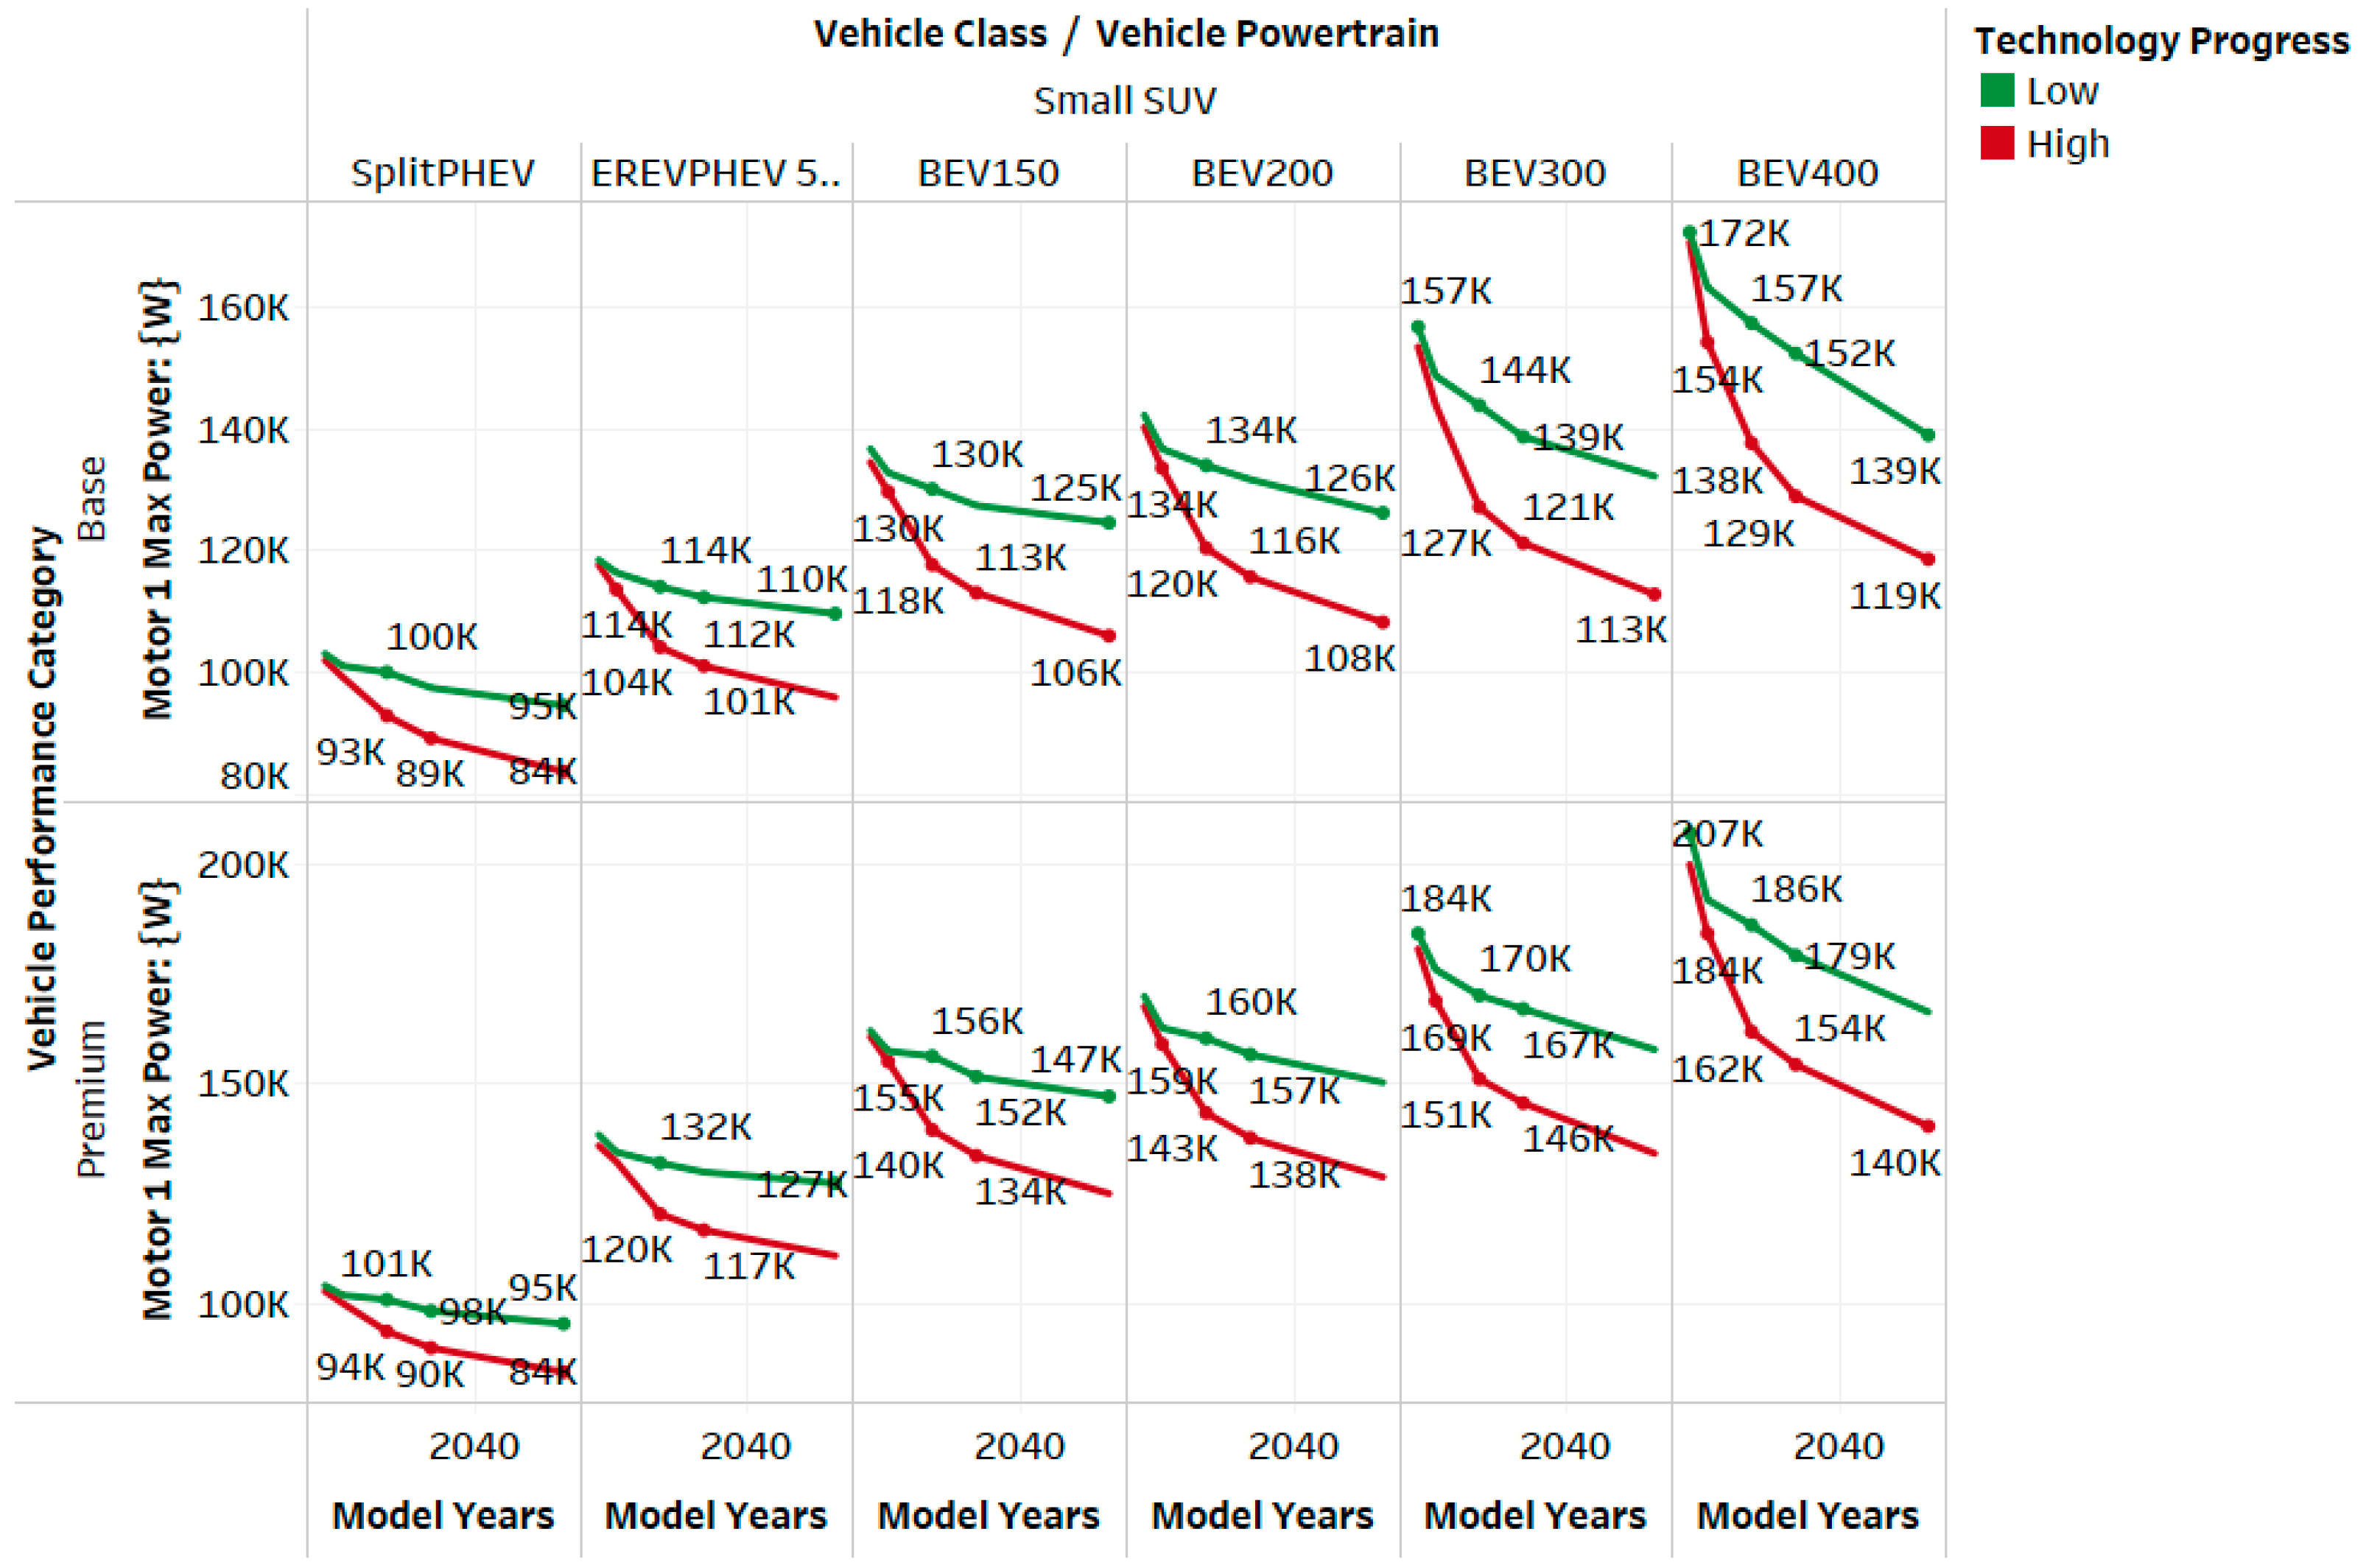
These reductions in engine, motor, and battery sizes highlight the impact of continuous technological improvements, particularly in component efficiency and lightweighting. By optimizing vehicle performance through better component sizing, future powertrains are expected to achieve significant gains in both fuel economy and cost savings.
3.2. Energy Consumption
4. Cost Analysis
The cost of manufacturing battery packs, motors, and other components is projected to decline significantly over time. While innovations in battery chemistry and energy density initially increase development costs, advancements in manufacturing processes, economies of scale, and supply chain optimizations offset these costs. For example, the cost of batteries is expected to decrease from 200 USD/kWh in 2023 to 60 USD/kWh in 2050, driven by higher production volumes and improvements in cathode and anode materials. Similarly, motor costs are projected to decline by over 80%, reflecting increased manufacturing efficiency and material utilization.
4.1. Component Cost
4.2. Vehicle Manufacturer Suggested Retail Price (MSRP)
4.3. Energy Consumption vs. Vehicle Manufacturing Cost
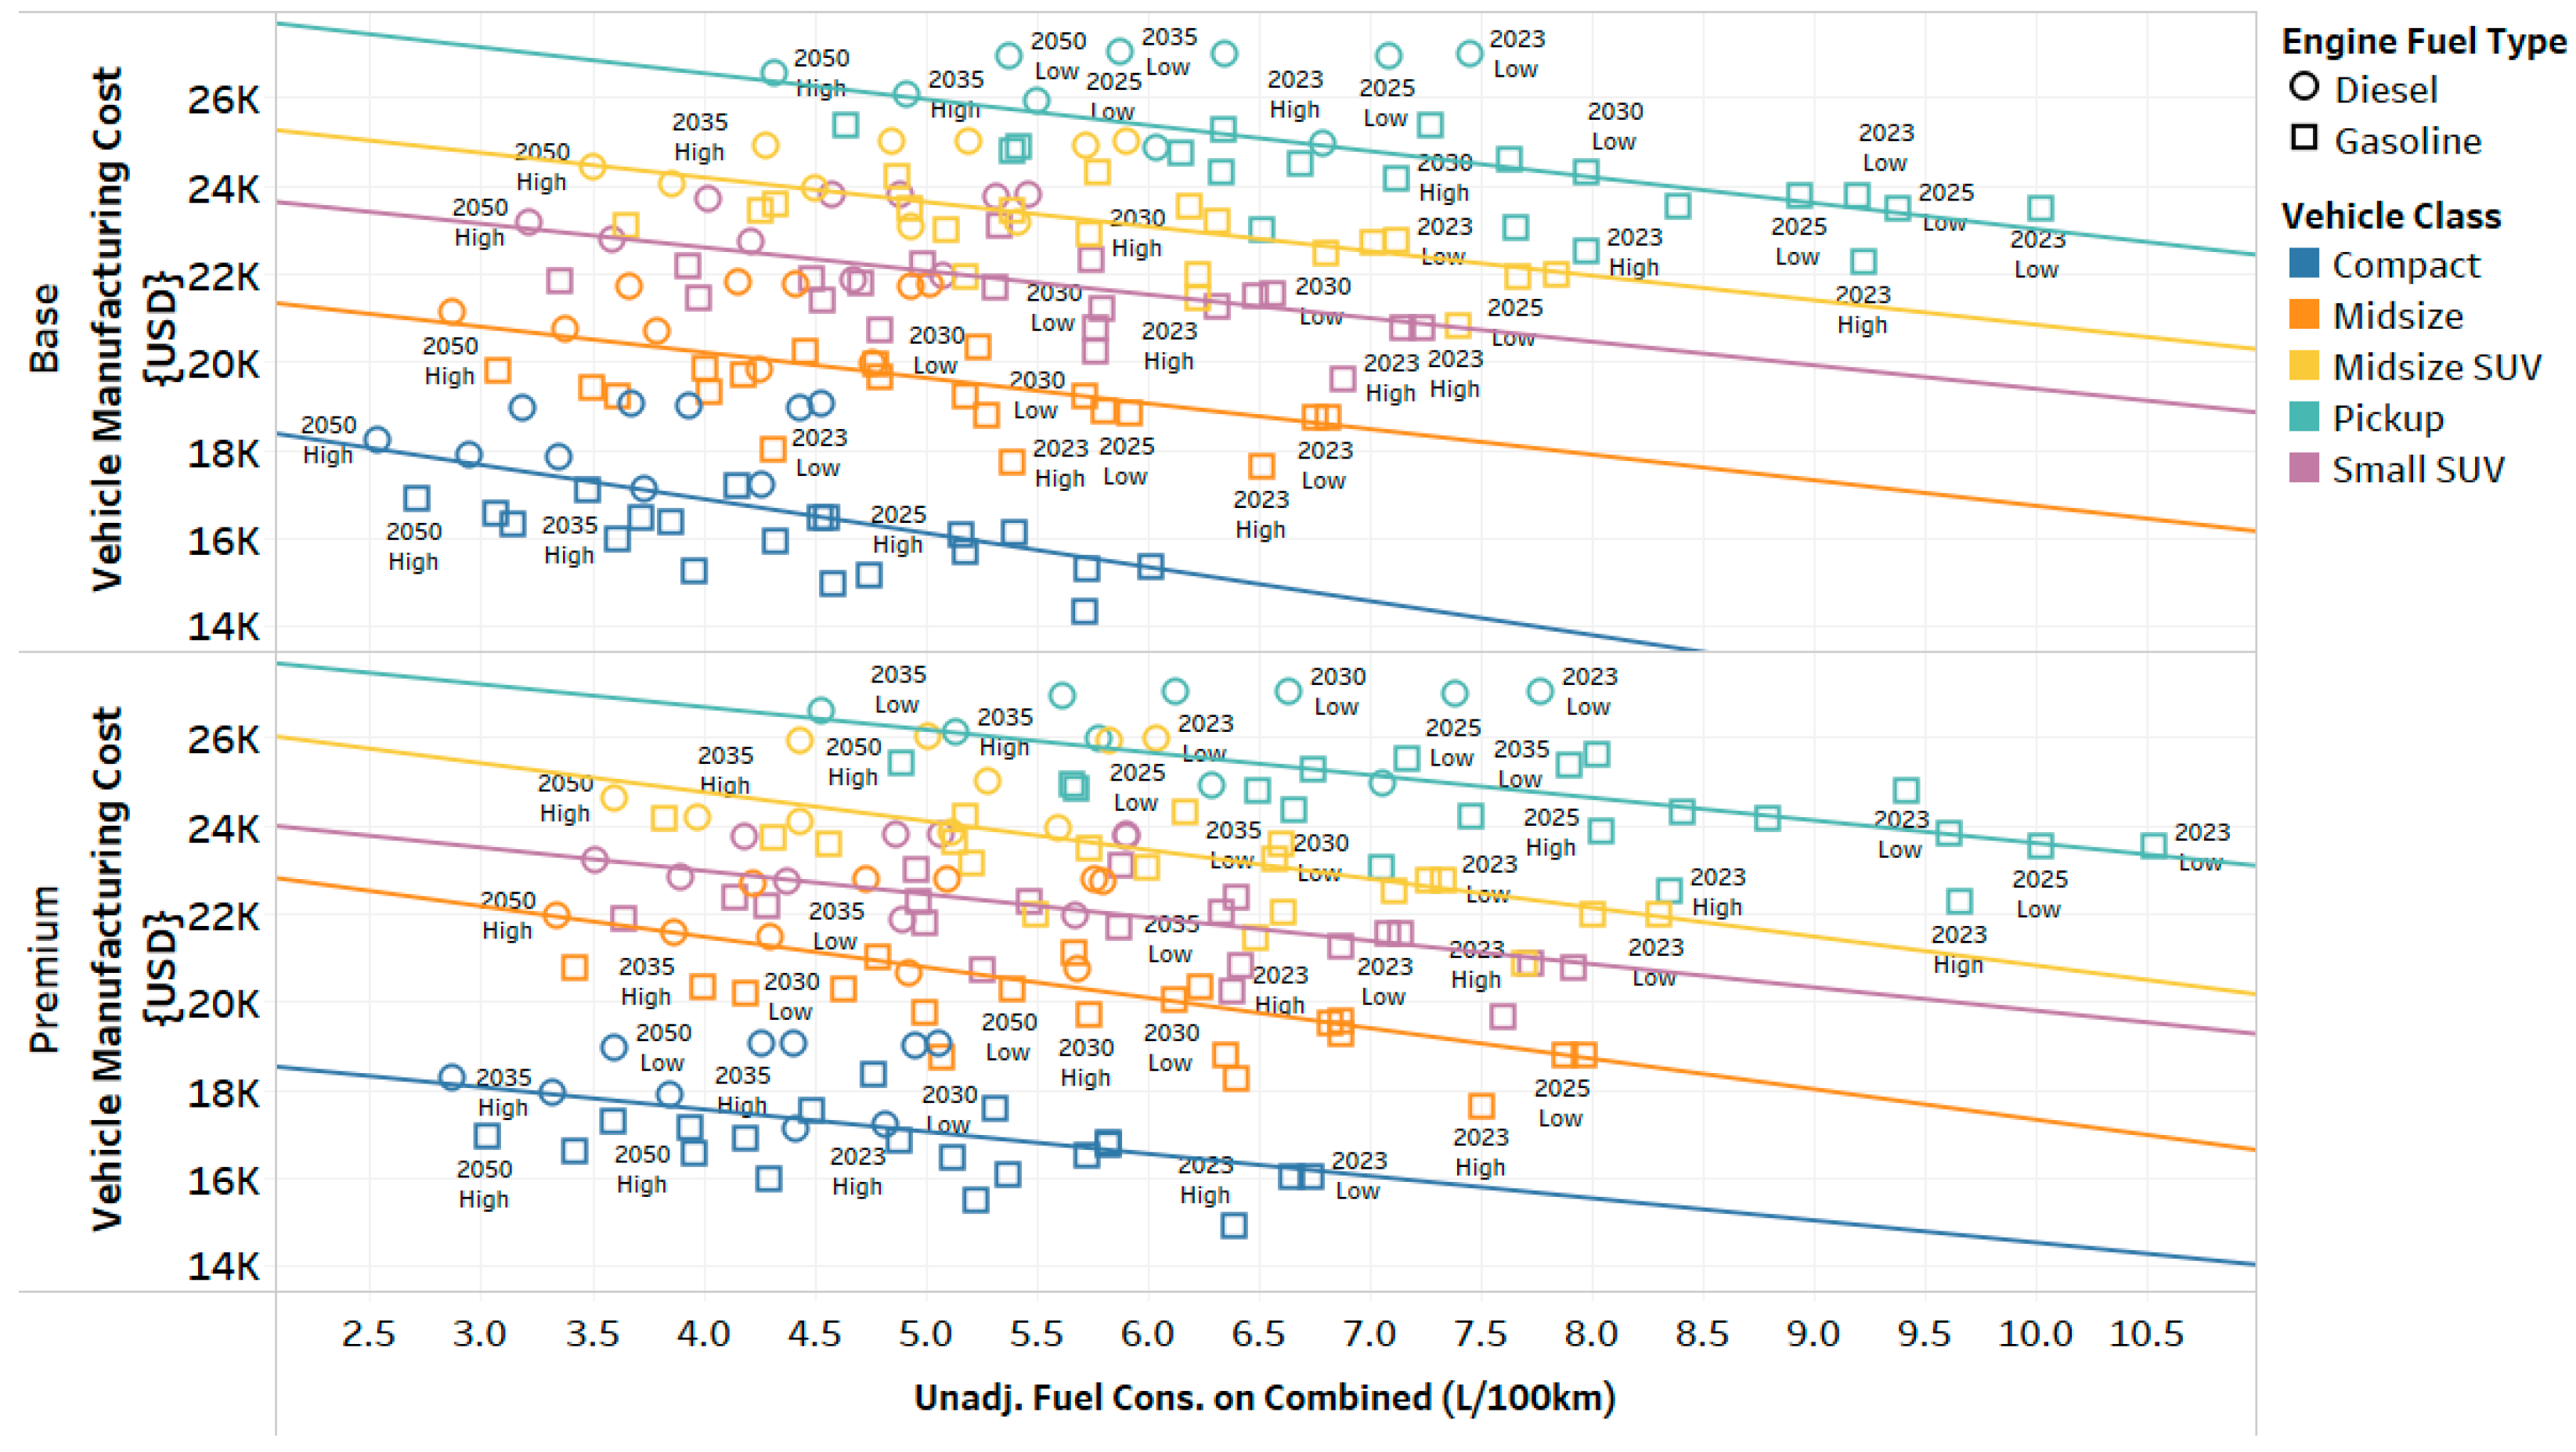
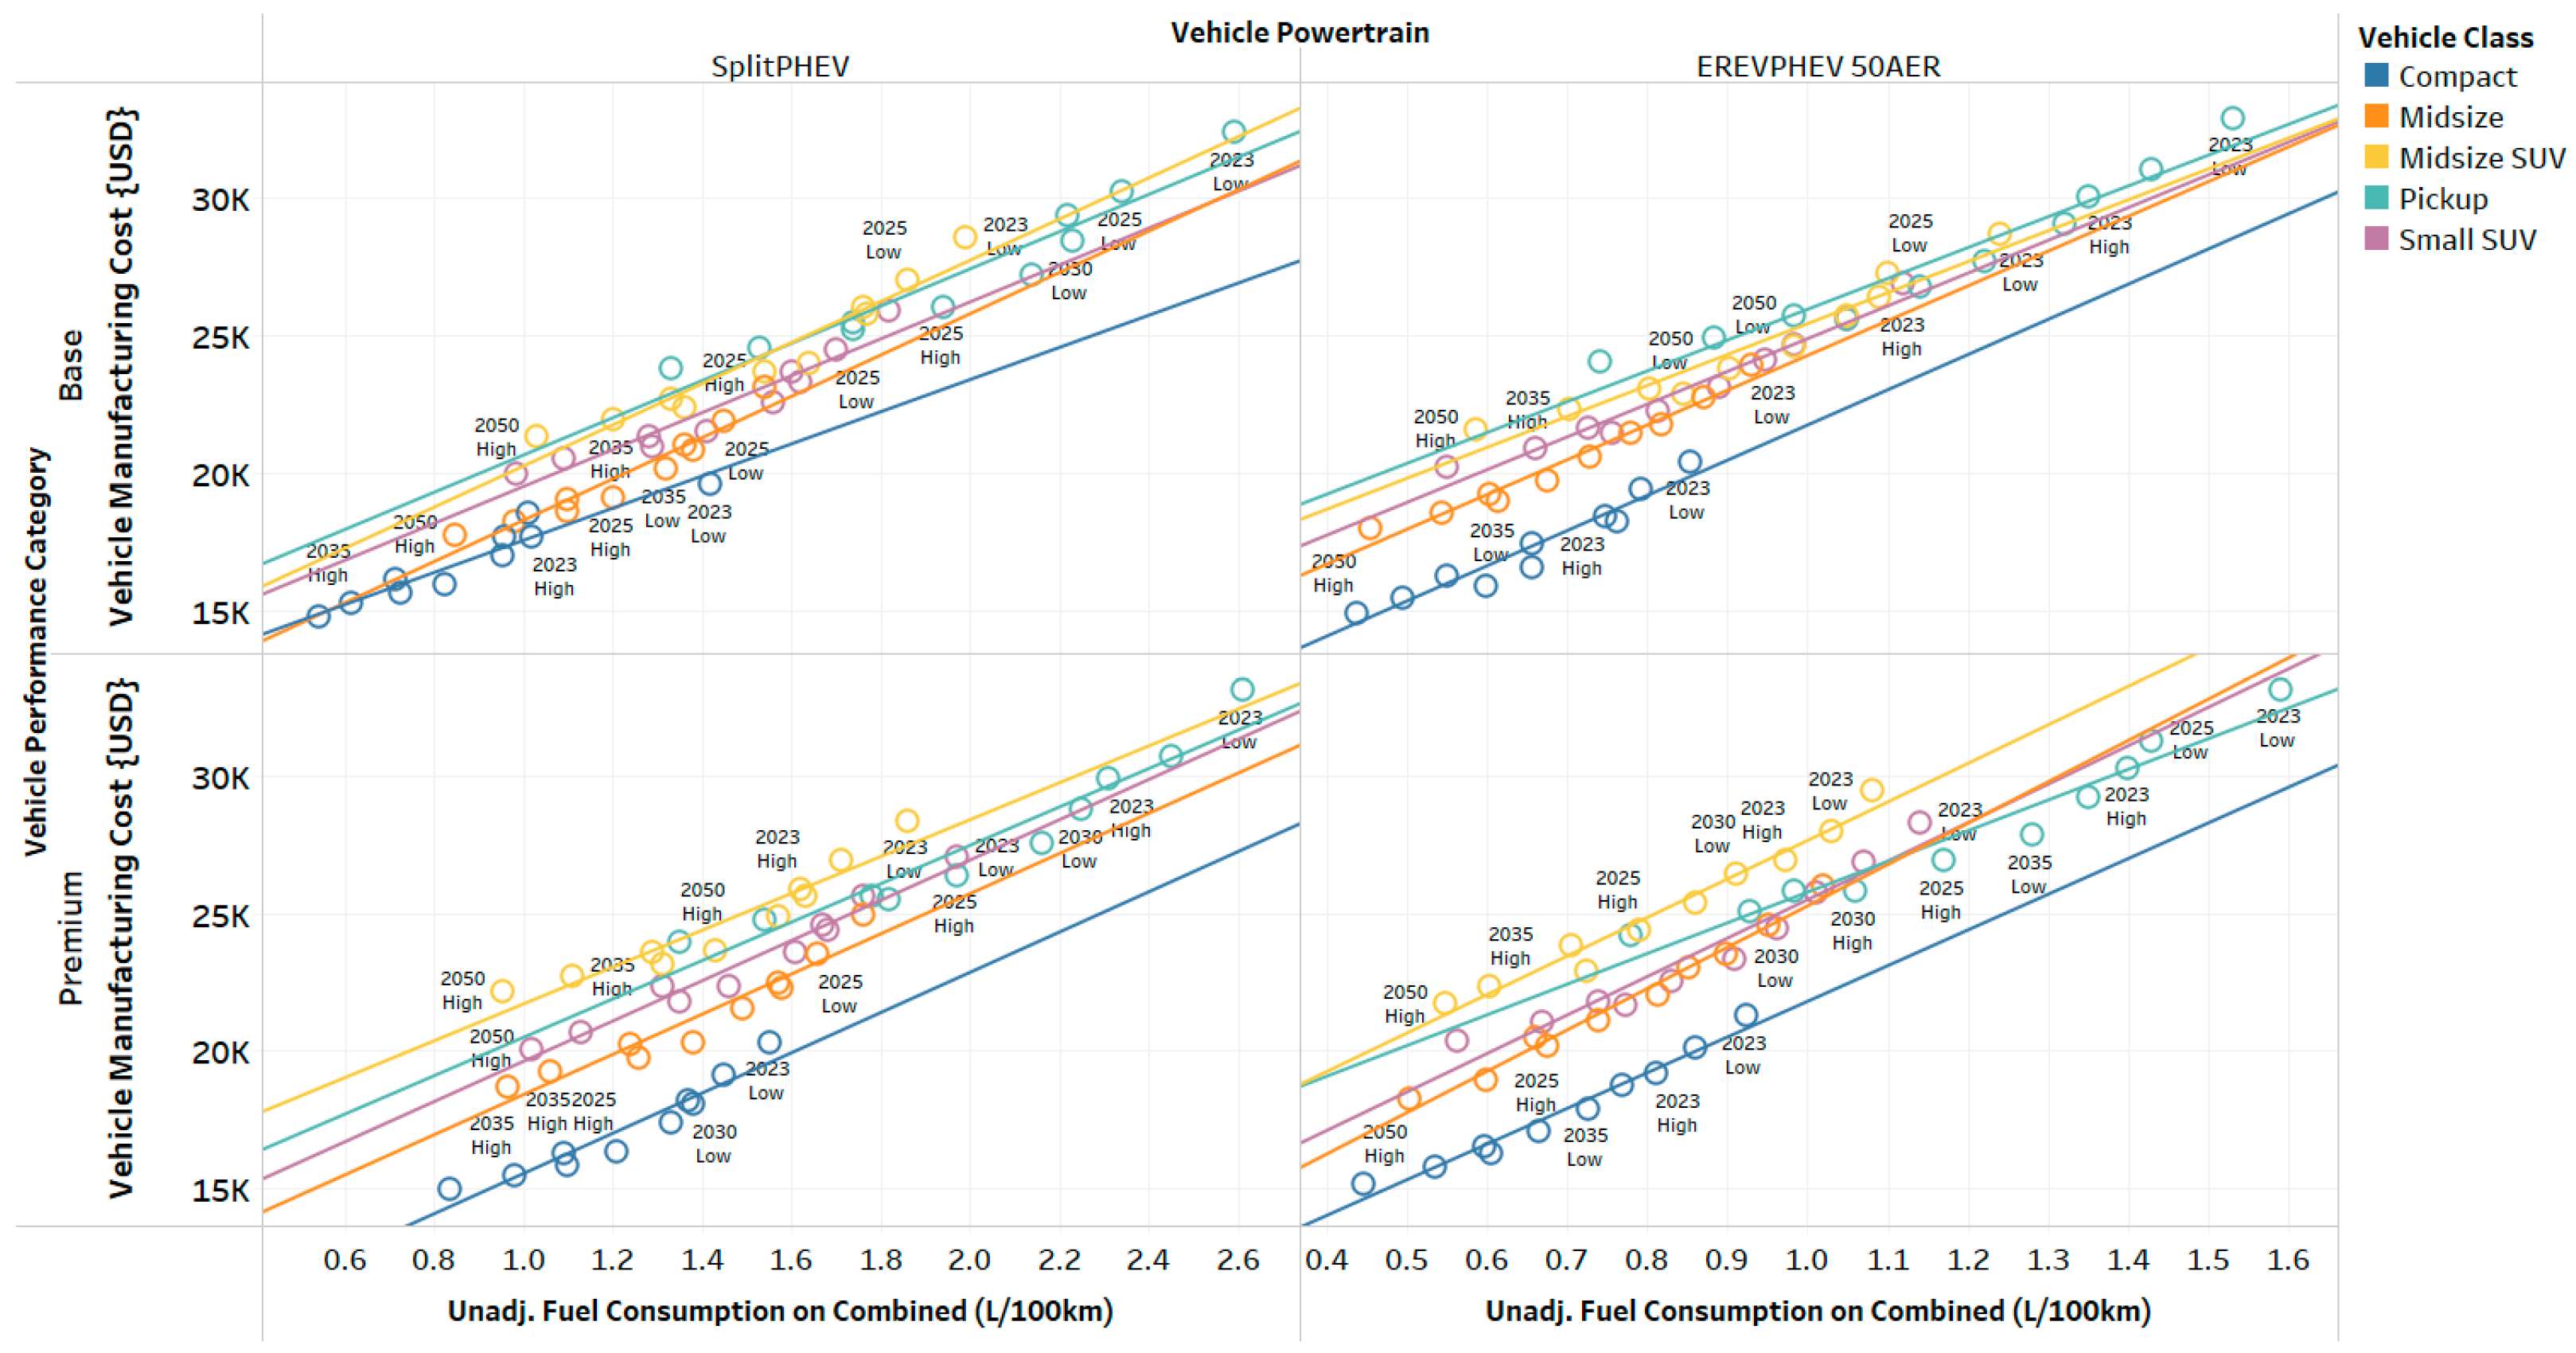
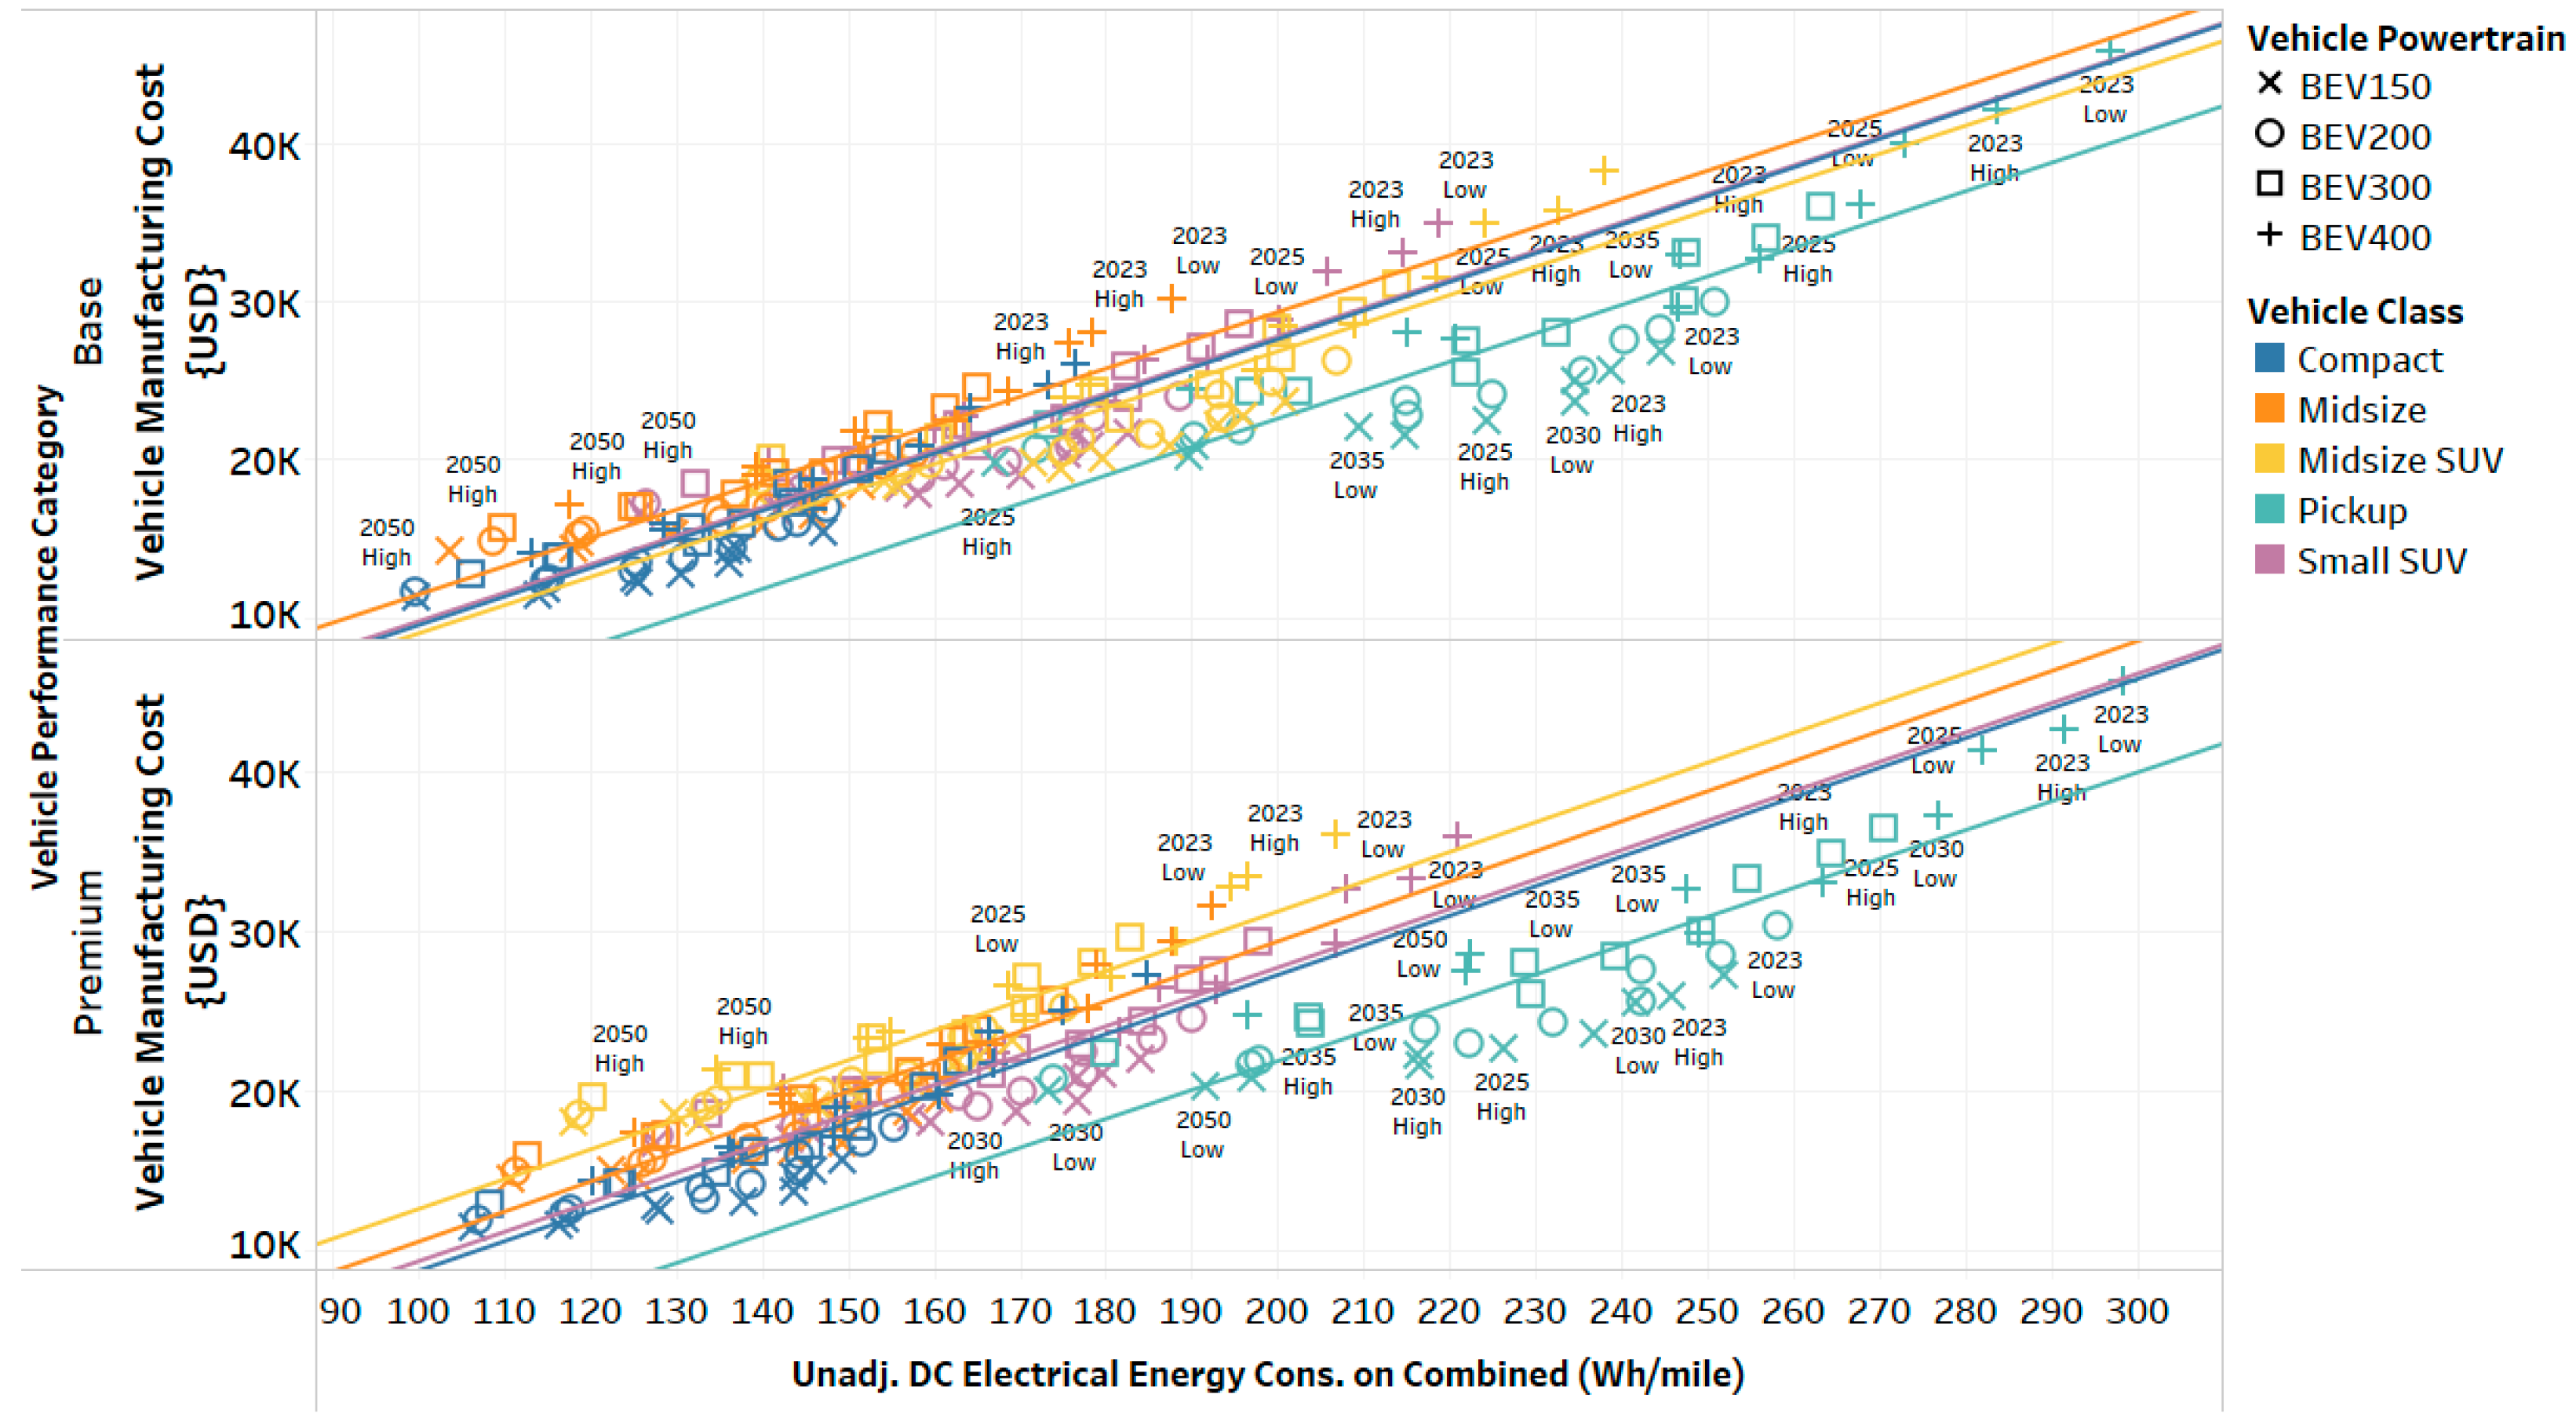
In this section, we explore the relationship between energy consumption and vehicle manufacturing costs across different powertrains. The objective is to assess how advancements in vehicle technologies influence both the fuel consumption and the overall cost of production. The results from this analysis highlight the trade-offs between cost reductions and fuel economy improvements as technology progresses.
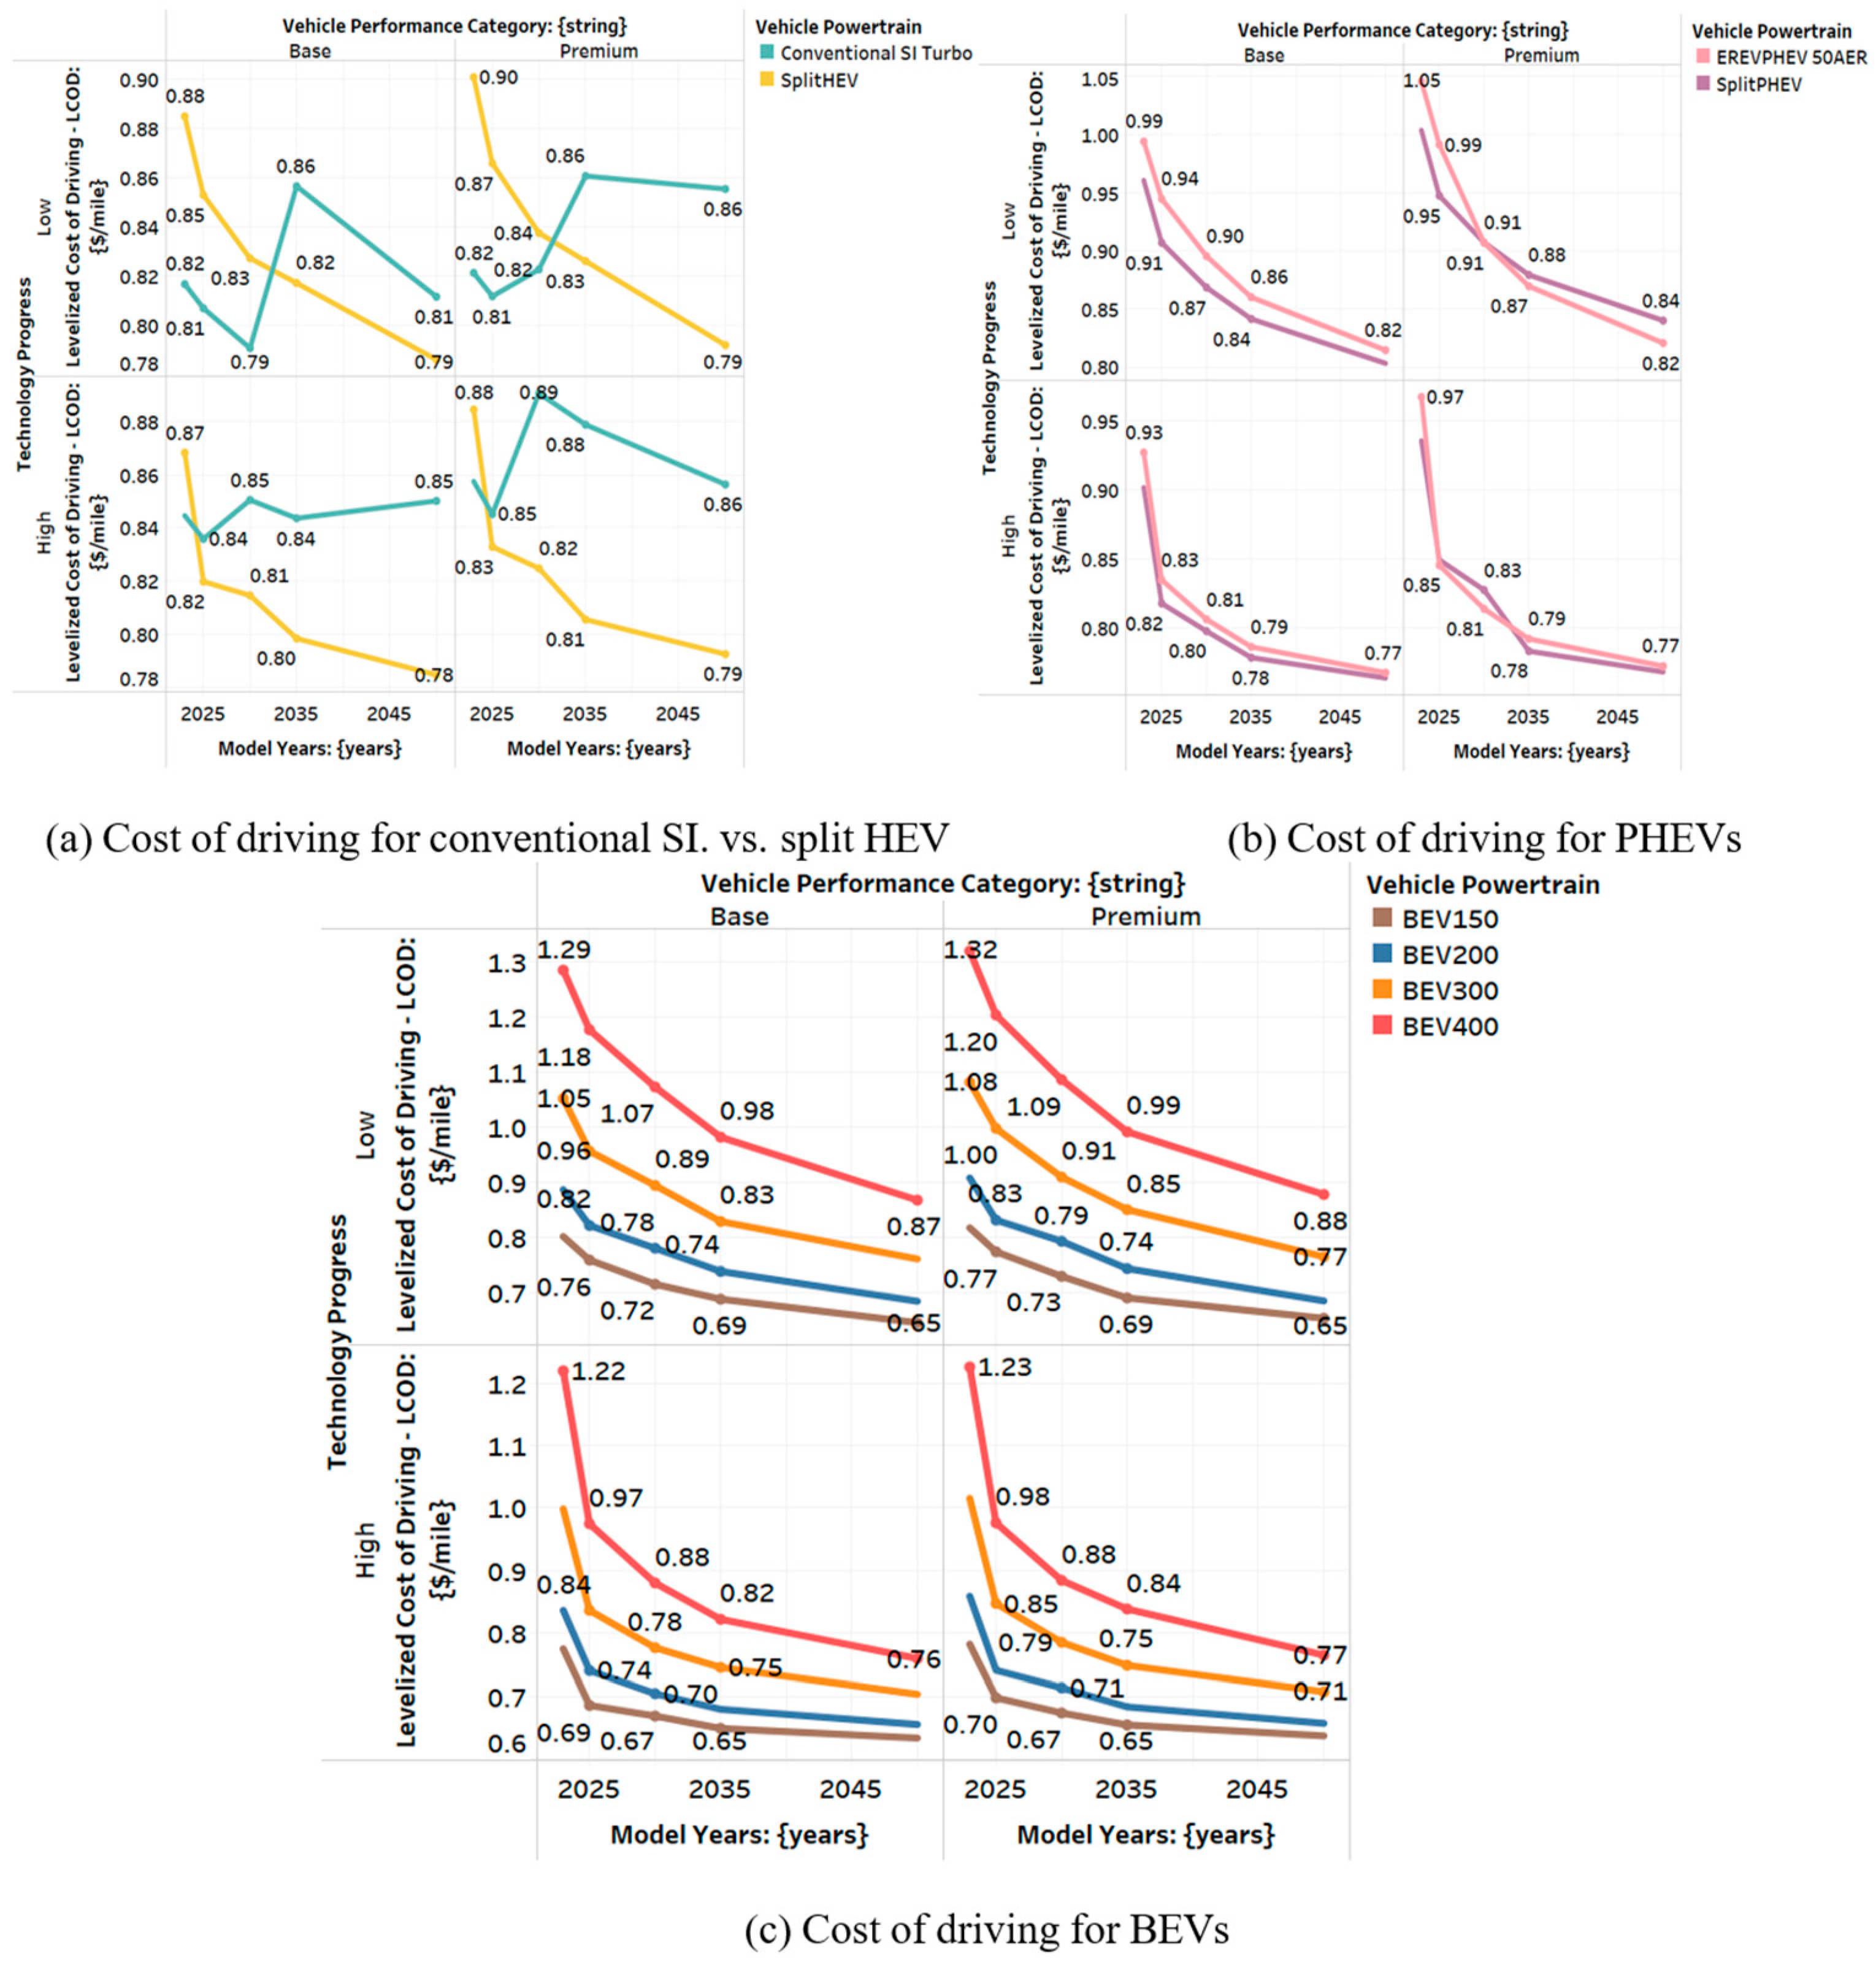
4.4. Levelized Cost of Driving
The levelized cost of driving (LCD) provides a comprehensive measure of the total cost per mile driven, incorporating both vehicle purchase costs and fuel or energy costs. This section presents an analysis of LCD for different powertrain types, focusing on small SUVs. The results highlight the long-term cost implications of adopting electrified powertrains, particularly as battery costs continue to decrease.
5. Comparison Cost Analysis
This section compares the total cost of ownership (TCO) across different powertrains, focusing on how advancements in vehicle technology and cost reductions influence overall affordability. The analysis covers the period from 2023 to 2050, highlighting key trends in both base and premium performance categories.
The analysis shows that while conventional gasoline vehicles remain competitive in the short term, the rapid advancements in battery technology and the declining cost of electrified powertrains will make BEVs the most cost-effective option in the long run, particularly for consumers who prioritize fuel economy and lower operational costs.
6. Summary and Conclusions
This article presents a comprehensive simulation-based analysis of the potential benefits of vehicle electrification, focusing on fuel consumption, energy consumption, and cost implications. The results suggest that significant reductions in fuel consumption and manufacturing costs can be achieved by 2050, particularly for electrified powertrains such as HEVs, PHEVs, and BEVs.
Key findings include:
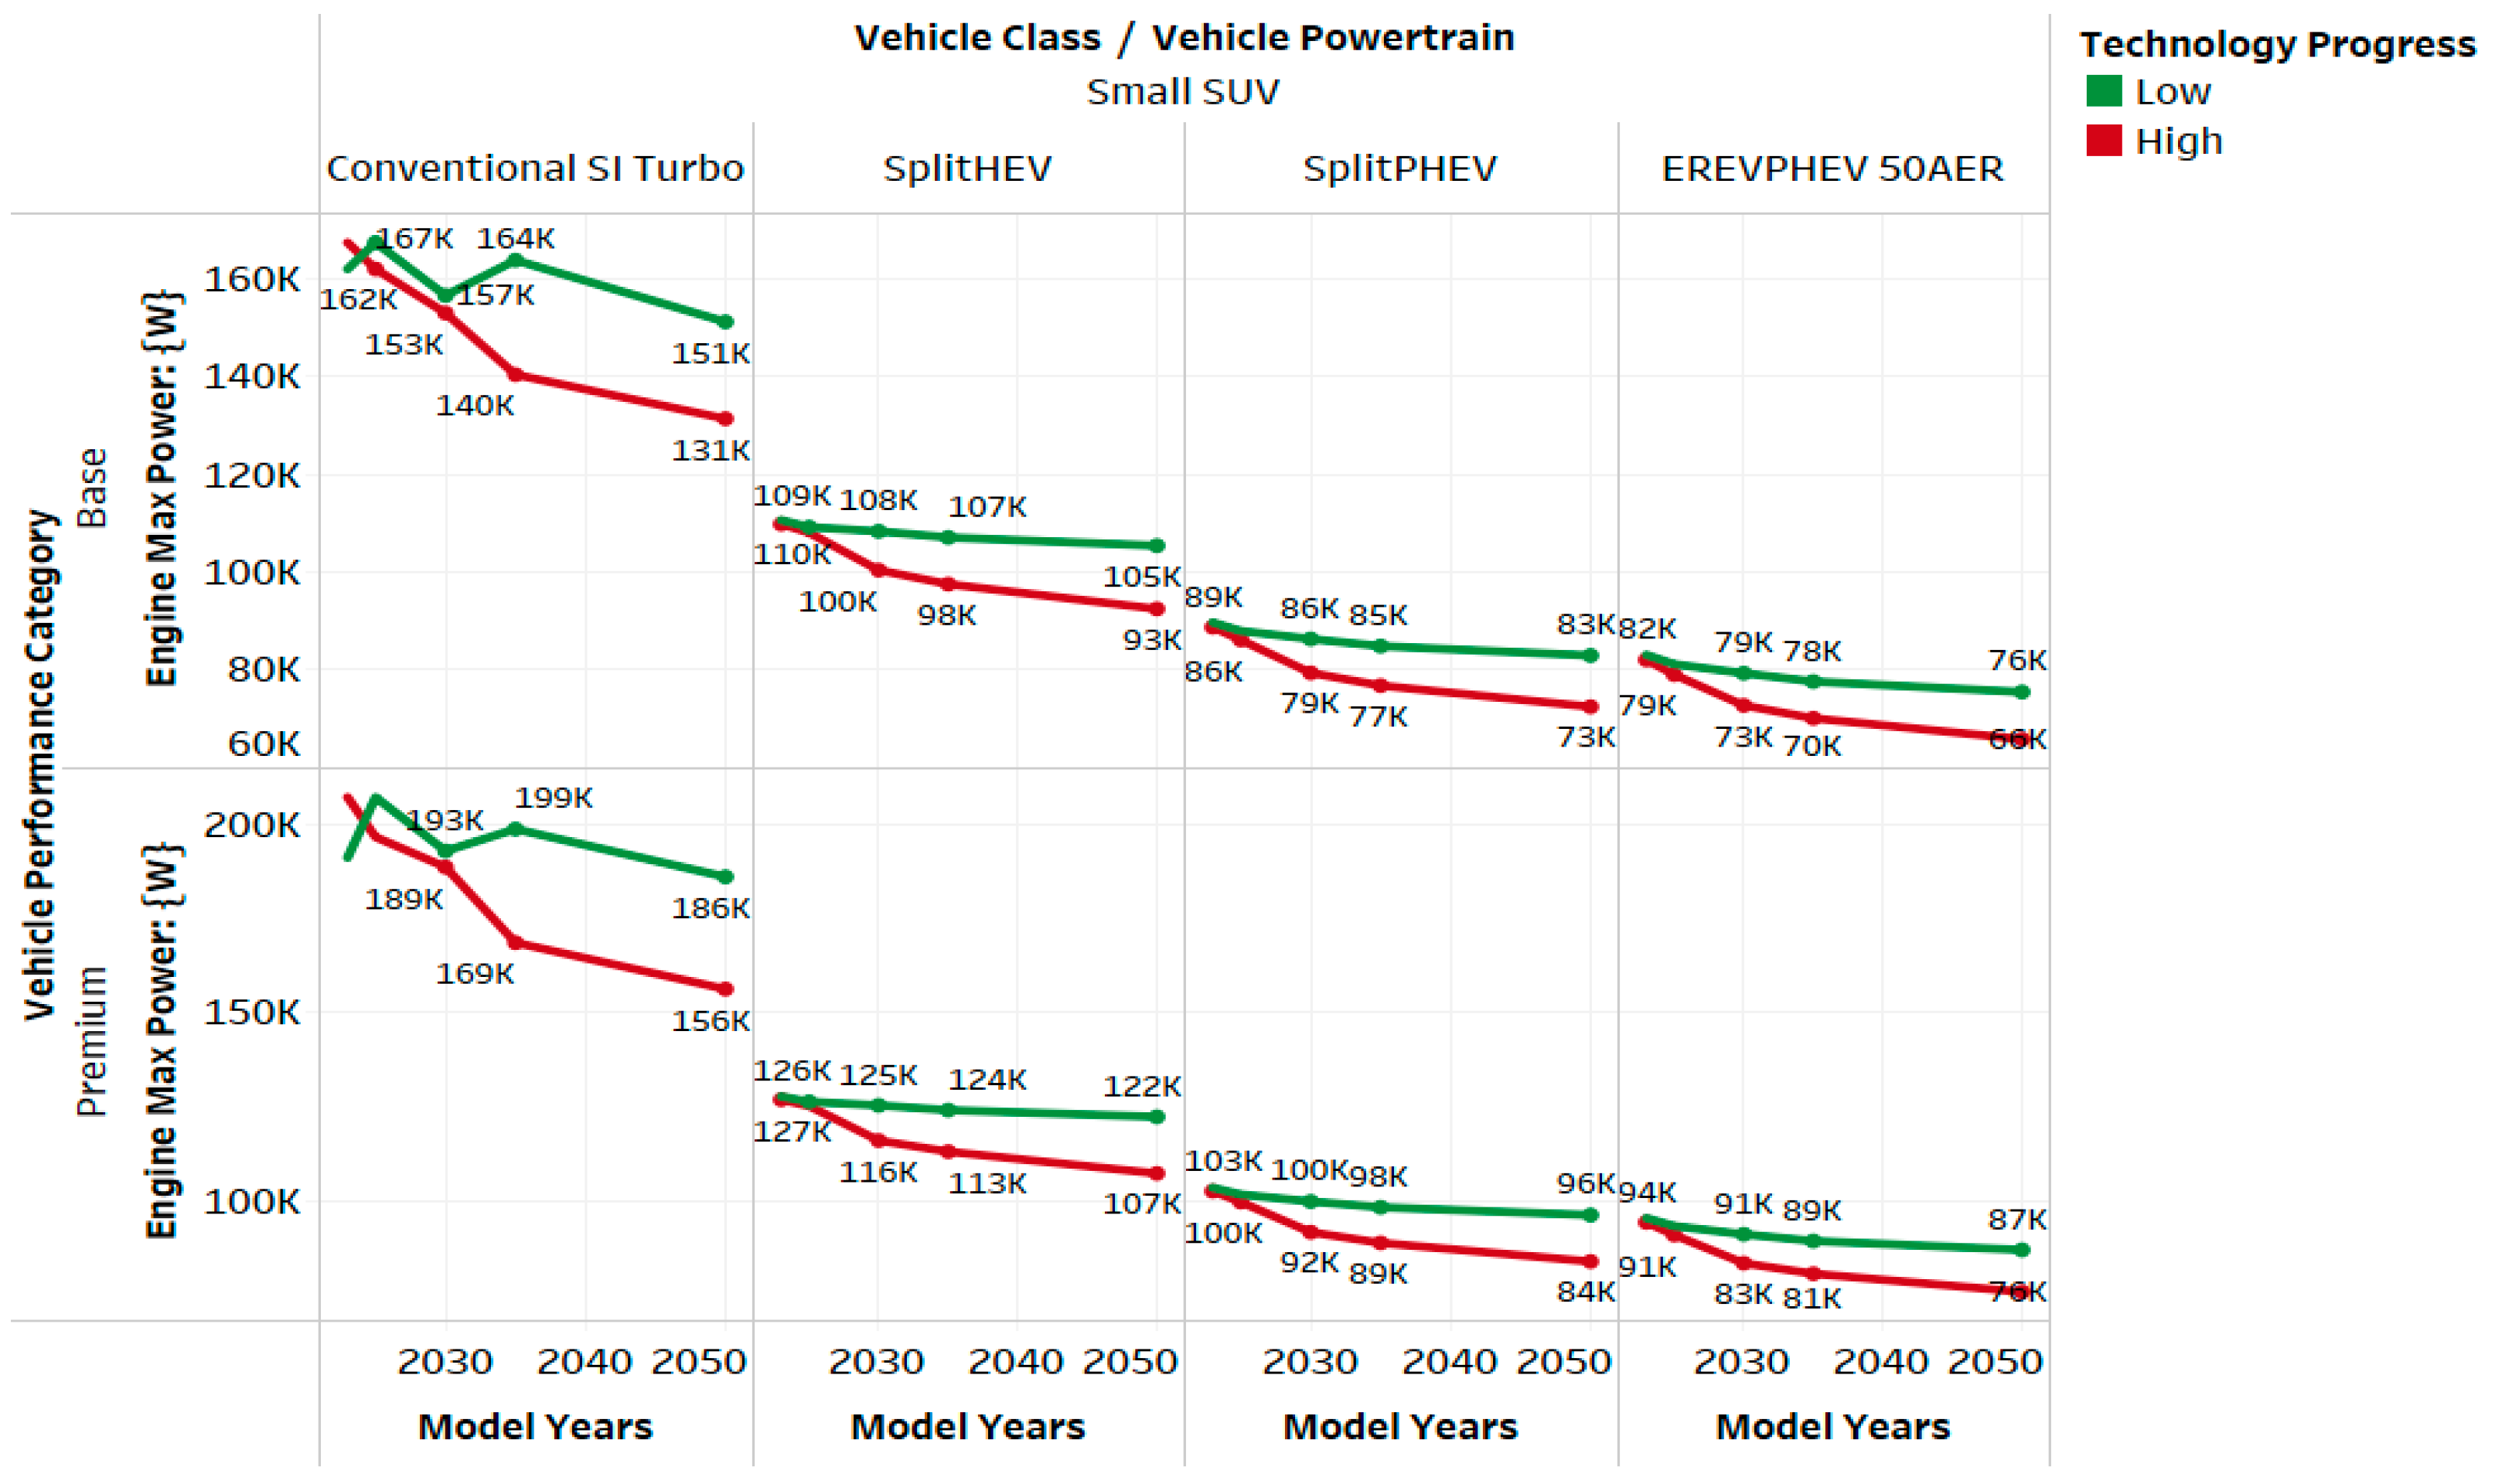
- Engine, electric machine, and battery sizes decrease significantly from model year 2020 to 2050 due to improvements in component efficiencies, lightweighting technologies, and advancements in battery energy density. Engine peak power for conventional vehicles decreases by 14–23%, while battery energy requirements for BEVs decrease by 26–40% [14].
- Manufacturing costs for BEVs and PHEVs decrease significantly, driven by reductions in battery and electric machine costs. By 2050, BEVs are expected to be 10–20% less expensive than conventional vehicles, making them the most cost-competitive option in the small SUV class [14].
- The total cost of ownership for BEVs becomes competitive with conventional gasoline vehicles between 2025 and 2040, depending on the technology progress scenario. This cost parity, combined with lower operational costs, suggests that BEVs will play a critical role in the future of transportation, particularly as consumers seek more energy-efficient and environmentally sustainable options [10].
In conclusion, the article demonstrates the transformative potential of vehicle electrification, highlighting the significant benefits in terms of fuel economy, energy consumption, and cost. These findings underscore the importance of continued investment in powertrain technology advancements and the need for policies that support the transition to electrified vehicles.
Author Contributions
Conceptualization, E.S.I. and A.R.; methodology, E.S.I. and A.R.; software, E.S.I.; validation, E.S.I. and A.R.; formal analysis, E.S.I. and R.V.; investigation, E.S.I. and R.V.; resources, A.R.; data curation, E.S.I. and R.V.; writing—original draft preparation, E.S.I.; writing—review and editing, E.S.I.; visualization, E.S.I. and R.V.; supervision, A.R.; project administration, E.S.I. and A.R.; funding acquisition, A.R. All authors have read and agreed to the published version of the manuscript.
Funding
This research was funded by the Vehicle Technologies Office of Energy Efficiency and Renewable Energy, U.S. Department of Energy (DE-AC02-06CH11357).
Data Availability Statement
Acknowledgments
The authors would like to acknowledge the financial support of Raphael Isaac, Laura Roberson, and Patrick Walsh (U.S. Department of Energy Vehicle Technologies Office) used to conduct this work. The submitted manuscript has been created by the UChicago Argonne, LLC, Operator of Argonne National Laboratory (“Argonne”). Argonne, a U.S. Department of Energy Office of Science laboratory, is operated under Contract No. DE-AC02-06CH11357. The U.S. Government retains for itself, and others acting on its behalf, a paid-up nonexclusive, irrevocable worldwide license in said article to reproduce, prepare derivative works, distribute copies to the public, and perform publicly and display publicly, by or on behalf of the Government.
Conflicts of Interest
The authors declare no conflicts of interest. The funders had no role in the design of the study; in the collection, analyses, or interpretation of data; in the writing of the manuscript; or in the decision to publish the results.
References
- The U.S. Department of Energy (DOE). Fact 943: September 19, 2016 Fuel Economy Being Chosen as the Most Important Vehicle Attribute is Related to the Price of Gasoline. Vehicle Technologies Office. 2016. Available online: https://www.energy.gov/eere/vehicles/fact-943-september-19-2016-fuel-economy-being-chosen-most-important-vehicle-attribute (accessed on 1 September 2023).
- Moawad, A.; Balaprakash, P.; Rousseau, A.; Wild, S. Novel Large Scale Simulation Process to Support DOT’s CAFE Modeling System. Presented at EVS28, Goyang-si, Korea. 2015. Available online: https://www.nhtsa.gov/sites/nhtsa.gov/files/anl-evs28-novel-large-scale-simulation-process-to-support-dot-paper.pdf (accessed on 1 March 2024).
- Sandrini, G.; Gadola, M.; Chindamo, D.; Magri, P. Efficient Regenerative Braking Strategy Aimed at Preserving Vehicle Stability by Preventing Wheel Locking. Transp. Res. Procedia 2023, 70, 28–35. [Google Scholar] [CrossRef]
- Hannan, M.A.; Azidin, F.A.; Mohamed, A. Hybrid Electric Vehicles and Their Challenges: A Review. Renew. Sustain. Energy Rev. 2014, 29, 135–150. [Google Scholar] [CrossRef]
- Harrison, G.; Thiel, C. An Exploratory Policy Analysis of Electric Vehicle Sales Competition and Cost Scenarios in Europe. Technol. Forecast. Soc. Change 2017, 114, 165–178. [Google Scholar] [CrossRef]
- Lutsey, N.; Nicholas, M. Update on Electric Vehicle Costs in the United States Through 2030; The International Council on Clean Transportation (ICCT): Washington, DC, USA, 2019; Available online: https://theicct.org/publications/update-US-2030-electric-vehicle-cost (accessed on 1 September 2024).
- Egbue, O.; Long, S. Barriers to Widespread Adoption of Electric Vehicles: An Analysis of Consumer Attitudes and Perceptions. Energy Policy 2012, 48, 717–729. [Google Scholar] [CrossRef]
- Slowik, P.; Lutsey, N. Evolution of Incentives to Sustain the Transition to a Global Electric Vehicle Fleet; ICCT Working Paper; International Council on Clean Transportation: Washington, DC, USA, 2016. [Google Scholar]
- Amjad, M.; Neelakrishnan, S.; Rudramoorthy, R. Review of Design Considerations and Technological Challenges for Successful Development and Deployment of Plug-in Hybrid Electric Vehicles. Renew. Sustain. Energy Rev. 2010, 14, 1104–1110. [Google Scholar] [CrossRef]
- Spreafico, C. Can Modified Components Make Cars Greener? A Life Cycle Assessment. J. Clean. Prod. 2021, 307, 127190. [Google Scholar] [CrossRef]
- Kelly, J.C.; Sullivan, J.L.; Burnham, A. Impacts of Vehicle Weight Reduction via Material Substitution on Life-Cycle Greenhouse Gas Emissions. Environ. Sci. Technol. 2015, 49, 12535–12542. [Google Scholar] [CrossRef] [PubMed]
- Das, S. Life Cycle Assessment of Carbon Fiber-Reinforced Polymer Composites. Int. J. Life Cycle Assess. 2011, 16, 268–282. [Google Scholar] [CrossRef]
- Guzzella, L.; Sciarretta, A. Vehicle Propulsion Systems: Introduction to Modeling and Optimization; Springer: Berlin/Heidelberg, Germany, 2013. [Google Scholar] [CrossRef]
- Islam, E.S.; Vijayagopal, R.; Moawad, A.; Kim, N.; Rousseau, A. A Comprehensive Simulation Study to Evaluate Future Vehicle Energy and Cost Reduction Potential; Contract ANL/ESD-22/6; Report to the US Department of Energy; Argonne National Laboratory (ANL): Lemont, IL, USA, 2022. [Google Scholar]
- Islam, E.S.; Prada, D.N.; Vijayagopal, R.; Mansour, C.; Phillips, P.; Kim, N.; Alhajjar, M.; Rousseau, A.; Transportation and Power Systems Division; Argonne National Laboratory. Detailed Simulation Study to Evaluate Future Transportation Decarbonization Potential; Contract ANL/TAPS-23/3; Report to the US Department of Energy; Argonne National Laboratory (ANL): Lemont, IL, USA, 2023. [Google Scholar]
- Islam, E.S.; Vijayagopal, R.; Rousseau, A. Exploring the Economic and Technological Viability of Future Electric Vehicles: Analyzing the Impact of Advances in the U.S. Department of Energy’s Vehicle Technologies. In Proceedings of the 37th International Electric Vehicle Symposium and Exhibition, Seoul, Republic of Korea, 23–26 April 2024. [Google Scholar]
- Ward, J.; Stephens, T.S.; Birky, A.K. Vehicle Technologies Program Government Performance and Results Act (GPRA) Report for Fiscal Year 2012; Argonne National Laboratory (ANL): Lemont, IL, USA, 2012. [Google Scholar] [CrossRef]
- Autonomie Model. Argonne National Laboratory. Available online: https://vms.es.anl.gov/tools/autonomie/ (accessed on 1 July 2024).
- The Argonne National Laboratory Vehicle & Mobility Systems Group (VMS). Argonne National Laboratory. TechScape. Available online: https://vms.taps.anl.gov/tools/techscape/ (accessed on 1 July 2024).
- Nykvist, B.; Nilsson, M. Rapidly Falling Costs of Battery Packs for Electric Vehicles. Nat. Clim. Change 2015, 5, 329–332. [Google Scholar] [CrossRef]
- Ziegler, M.S.; Trancik, J.E. Re-Examining Rates of Lithium-Ion Battery Technology Improvement and Cost Decline. Energy Environ. Sci. 2021, 14, 1635–1651. [Google Scholar] [CrossRef]
- Islam, E.S.; Vijayagopal, R.; Moawad, A.; Kim, N.; Rousseau, A. A Detailed Vehicle Modeling & Simulation Study Quantifying Energy Consumption and Cost Reduction of Advanced Vehicle Technologies Through 2050; Argonne National Laboratory (ANL): Lemont, IL, USA, 2021. [Google Scholar] [CrossRef]
- Delucchi, M.A.; Lipman, T.E. An Analysis of the Retail and Lifecycle Cost of Battery-Powered Electric Vehicles. Transp. Res. Part D Transp. Environ. 2001, 6, 371–404. [Google Scholar] [CrossRef]
- Hawkins, T.R.; Singh, B.; Majeau-Bettez, G.; Strømman, A.H. Comparative Environmental Life Cycle Assessment of Conventional and Electric Vehicles. J. Ind. Ecol. 2013, 17, 53–64. [Google Scholar] [CrossRef]
- Notter, D.A.; Gauch, M.; Widmer, R.; Wäger, P.; Stamp, A.; Zah, R.; Althaus, H.J. Contribution of Li-Ion Batteries to the Environmental Impact of Electric Vehicles. Environ. Sci. Technol. 2010, 44, 6550–6556. [Google Scholar] [CrossRef]
Argonne integration simulation framework.
Figure 1.
Argonne integration simulation framework.
Conventional powertrain sizing algorithm. Reprinted with permission from Ref. [22]. 2024, Islam.
Conventional powertrain sizing algorithm. Reprinted with permission from Ref. [22]. 2024, Islam.
Engine peak power for small SUVs across performance categories.
Figure 3.
Engine peak power for small SUVs across performance categories.
Motor peak power (W) for small SUVs across performance categories.
Figure 4.
Motor peak power (W) for small SUVs across performance categories.
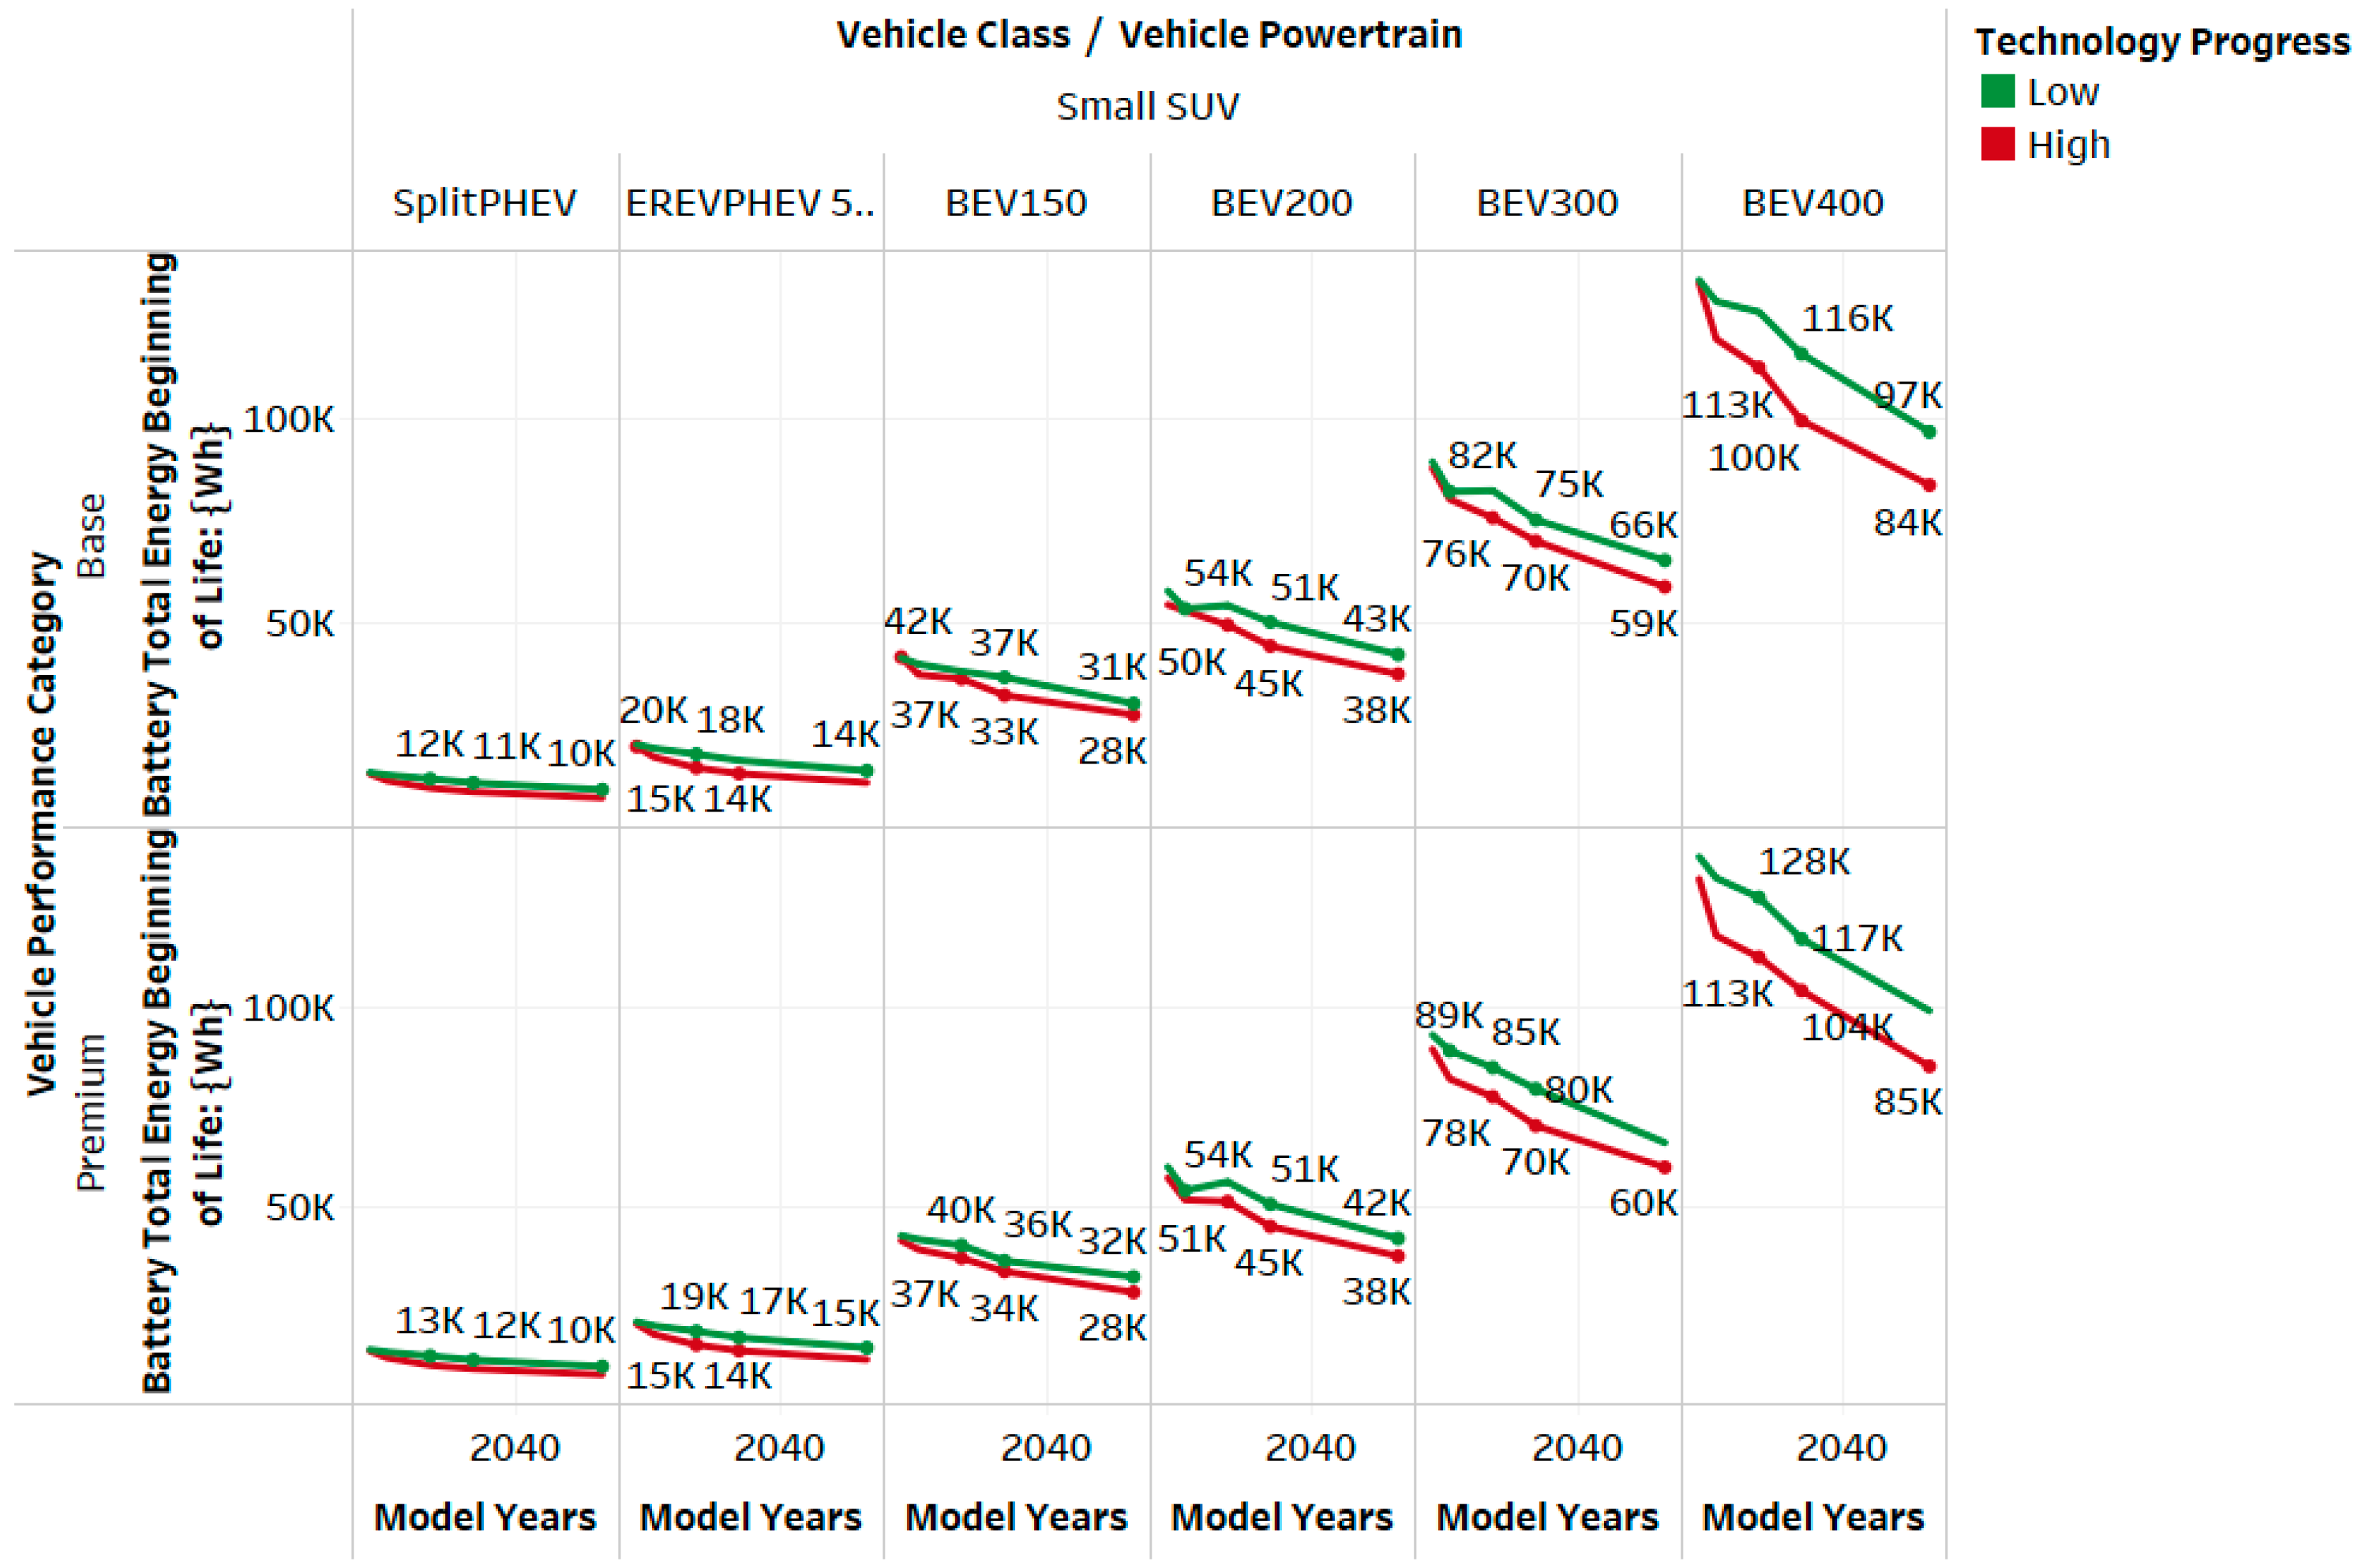
Battery total energy for small SUVs across performance categories.
Figure 5.
Battery total energy for small SUVs across performance categories.
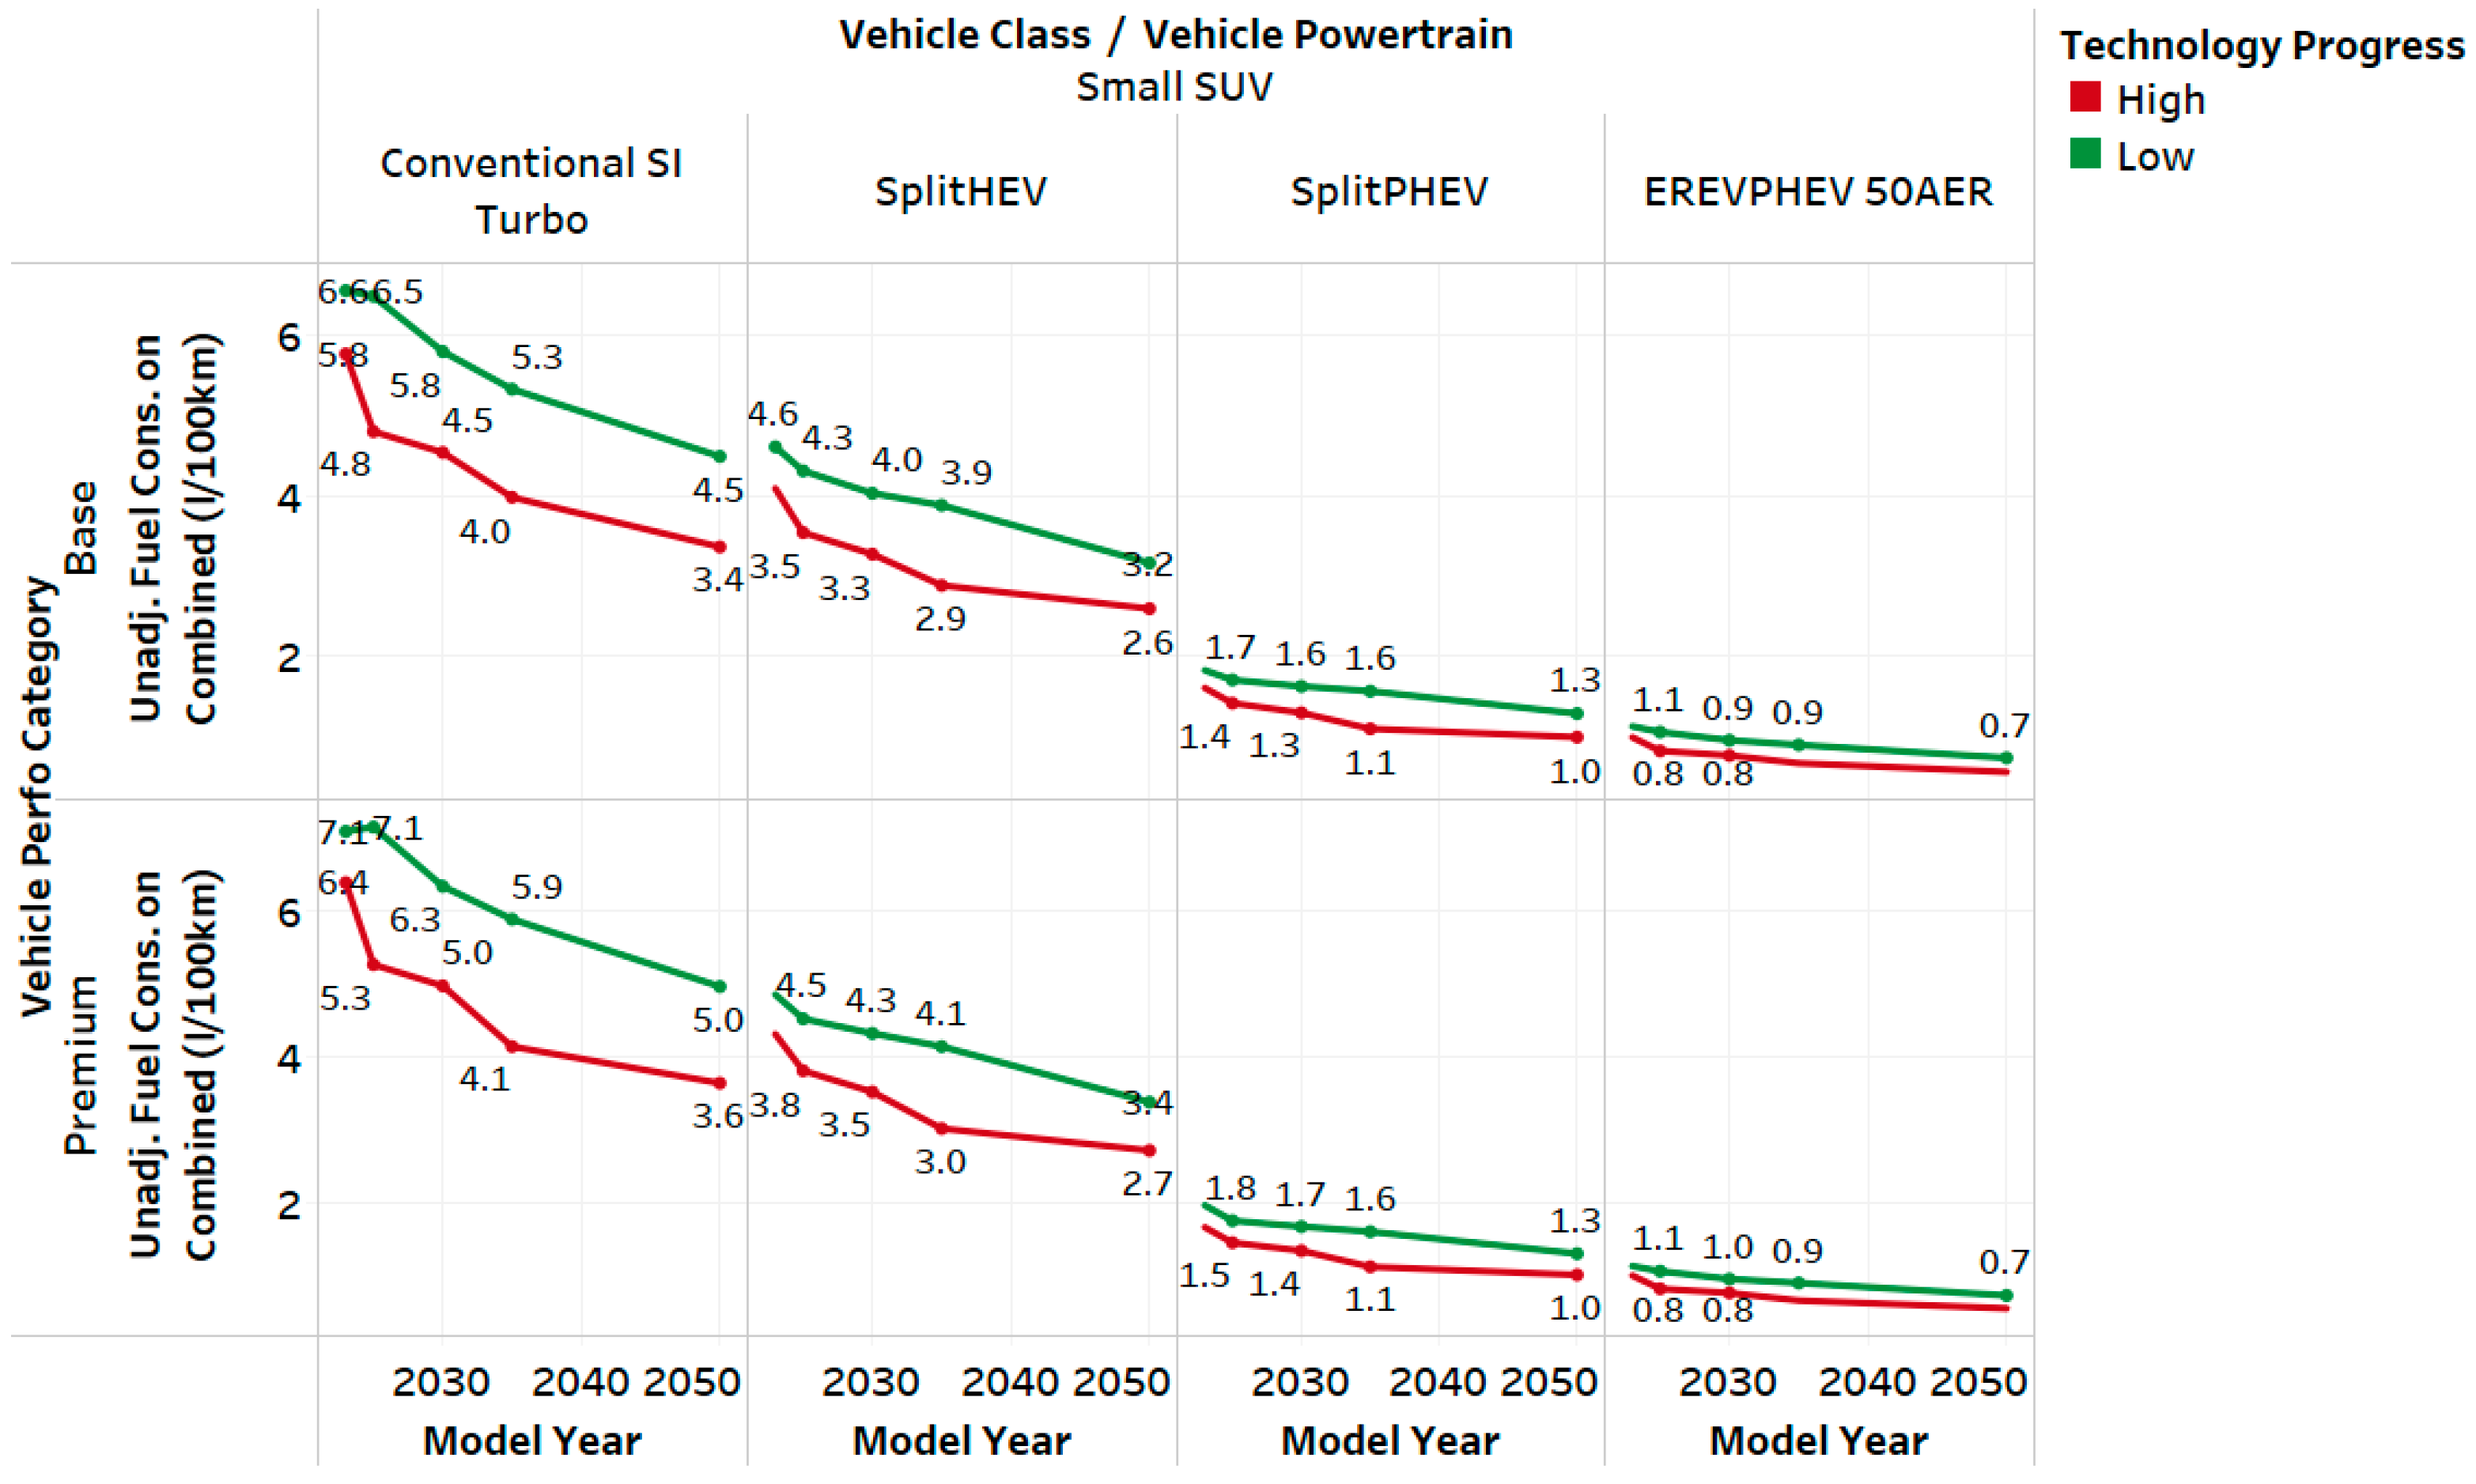
Unadjusted fuel consumption (utility-weighted for PHEVs) on the EPA-combined cycle for small SUVs.
Figure 6.
Unadjusted fuel consumption (utility-weighted for PHEVs) on the EPA-combined cycle for small SUVs.
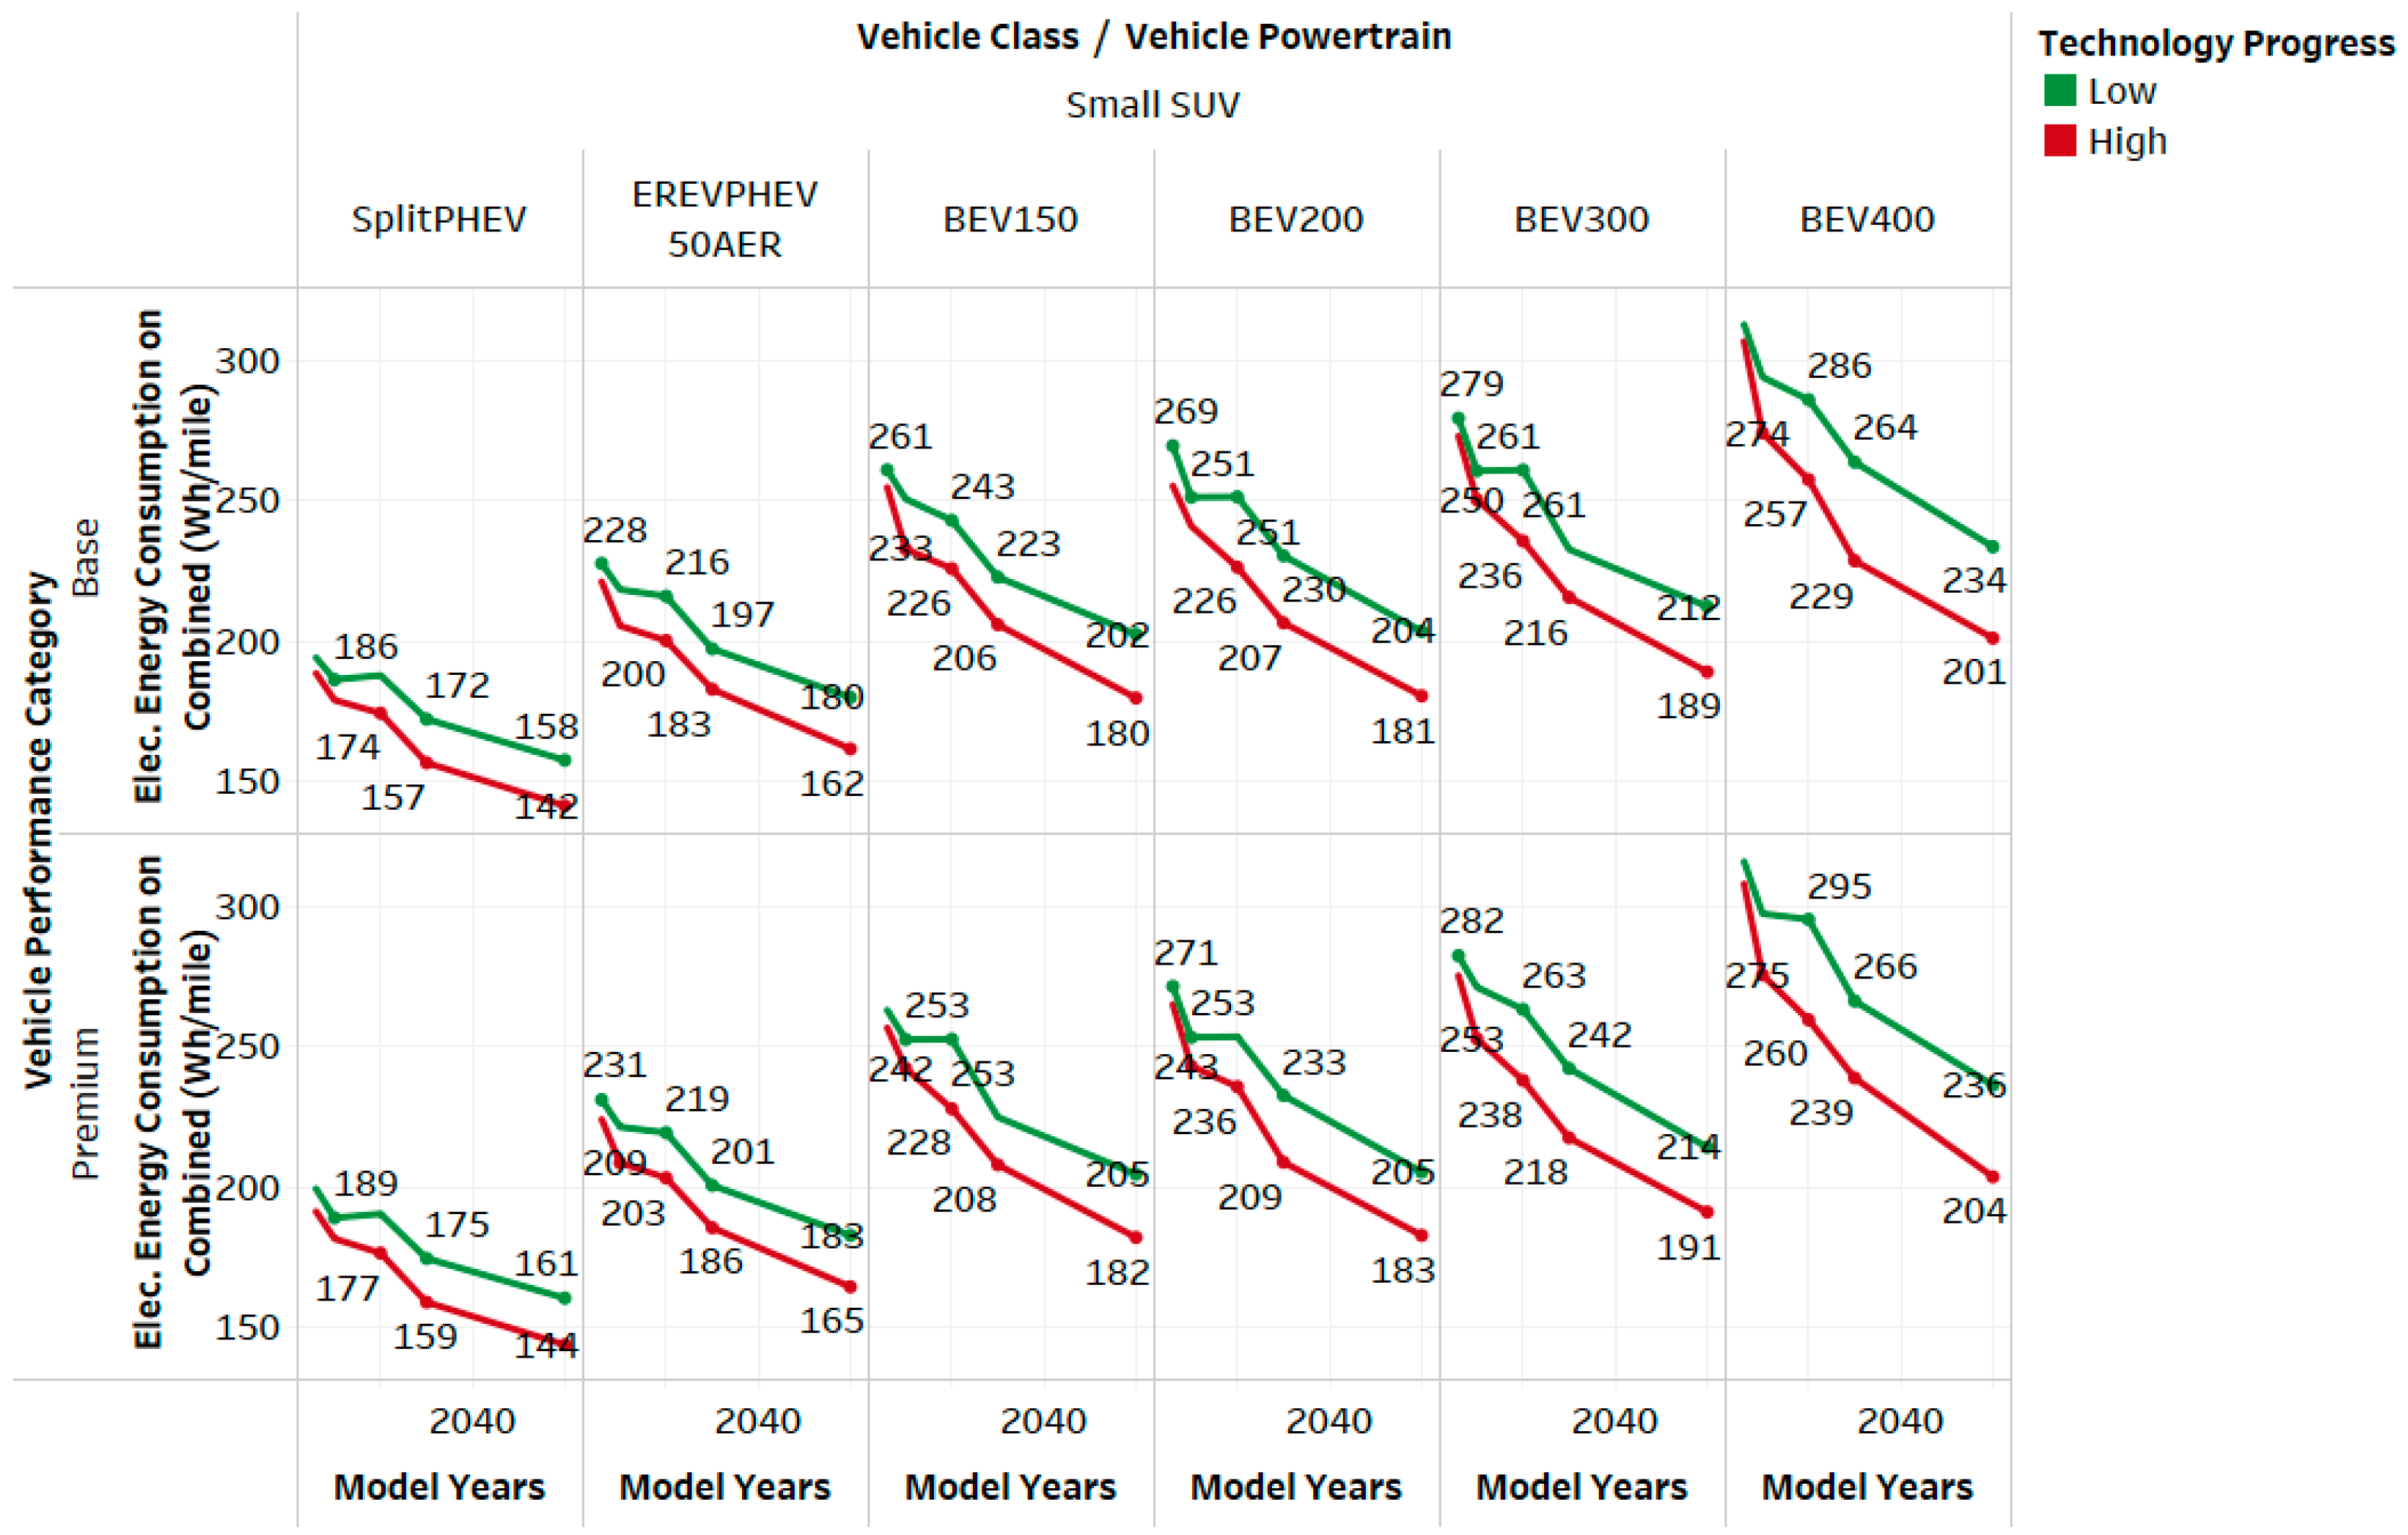
Adjusted DC electrical energy consumption on the combined label (Wh/mile) for small SUVs.
Figure 7.
Adjusted DC electrical energy consumption on the combined label (Wh/mile) for small SUVs.
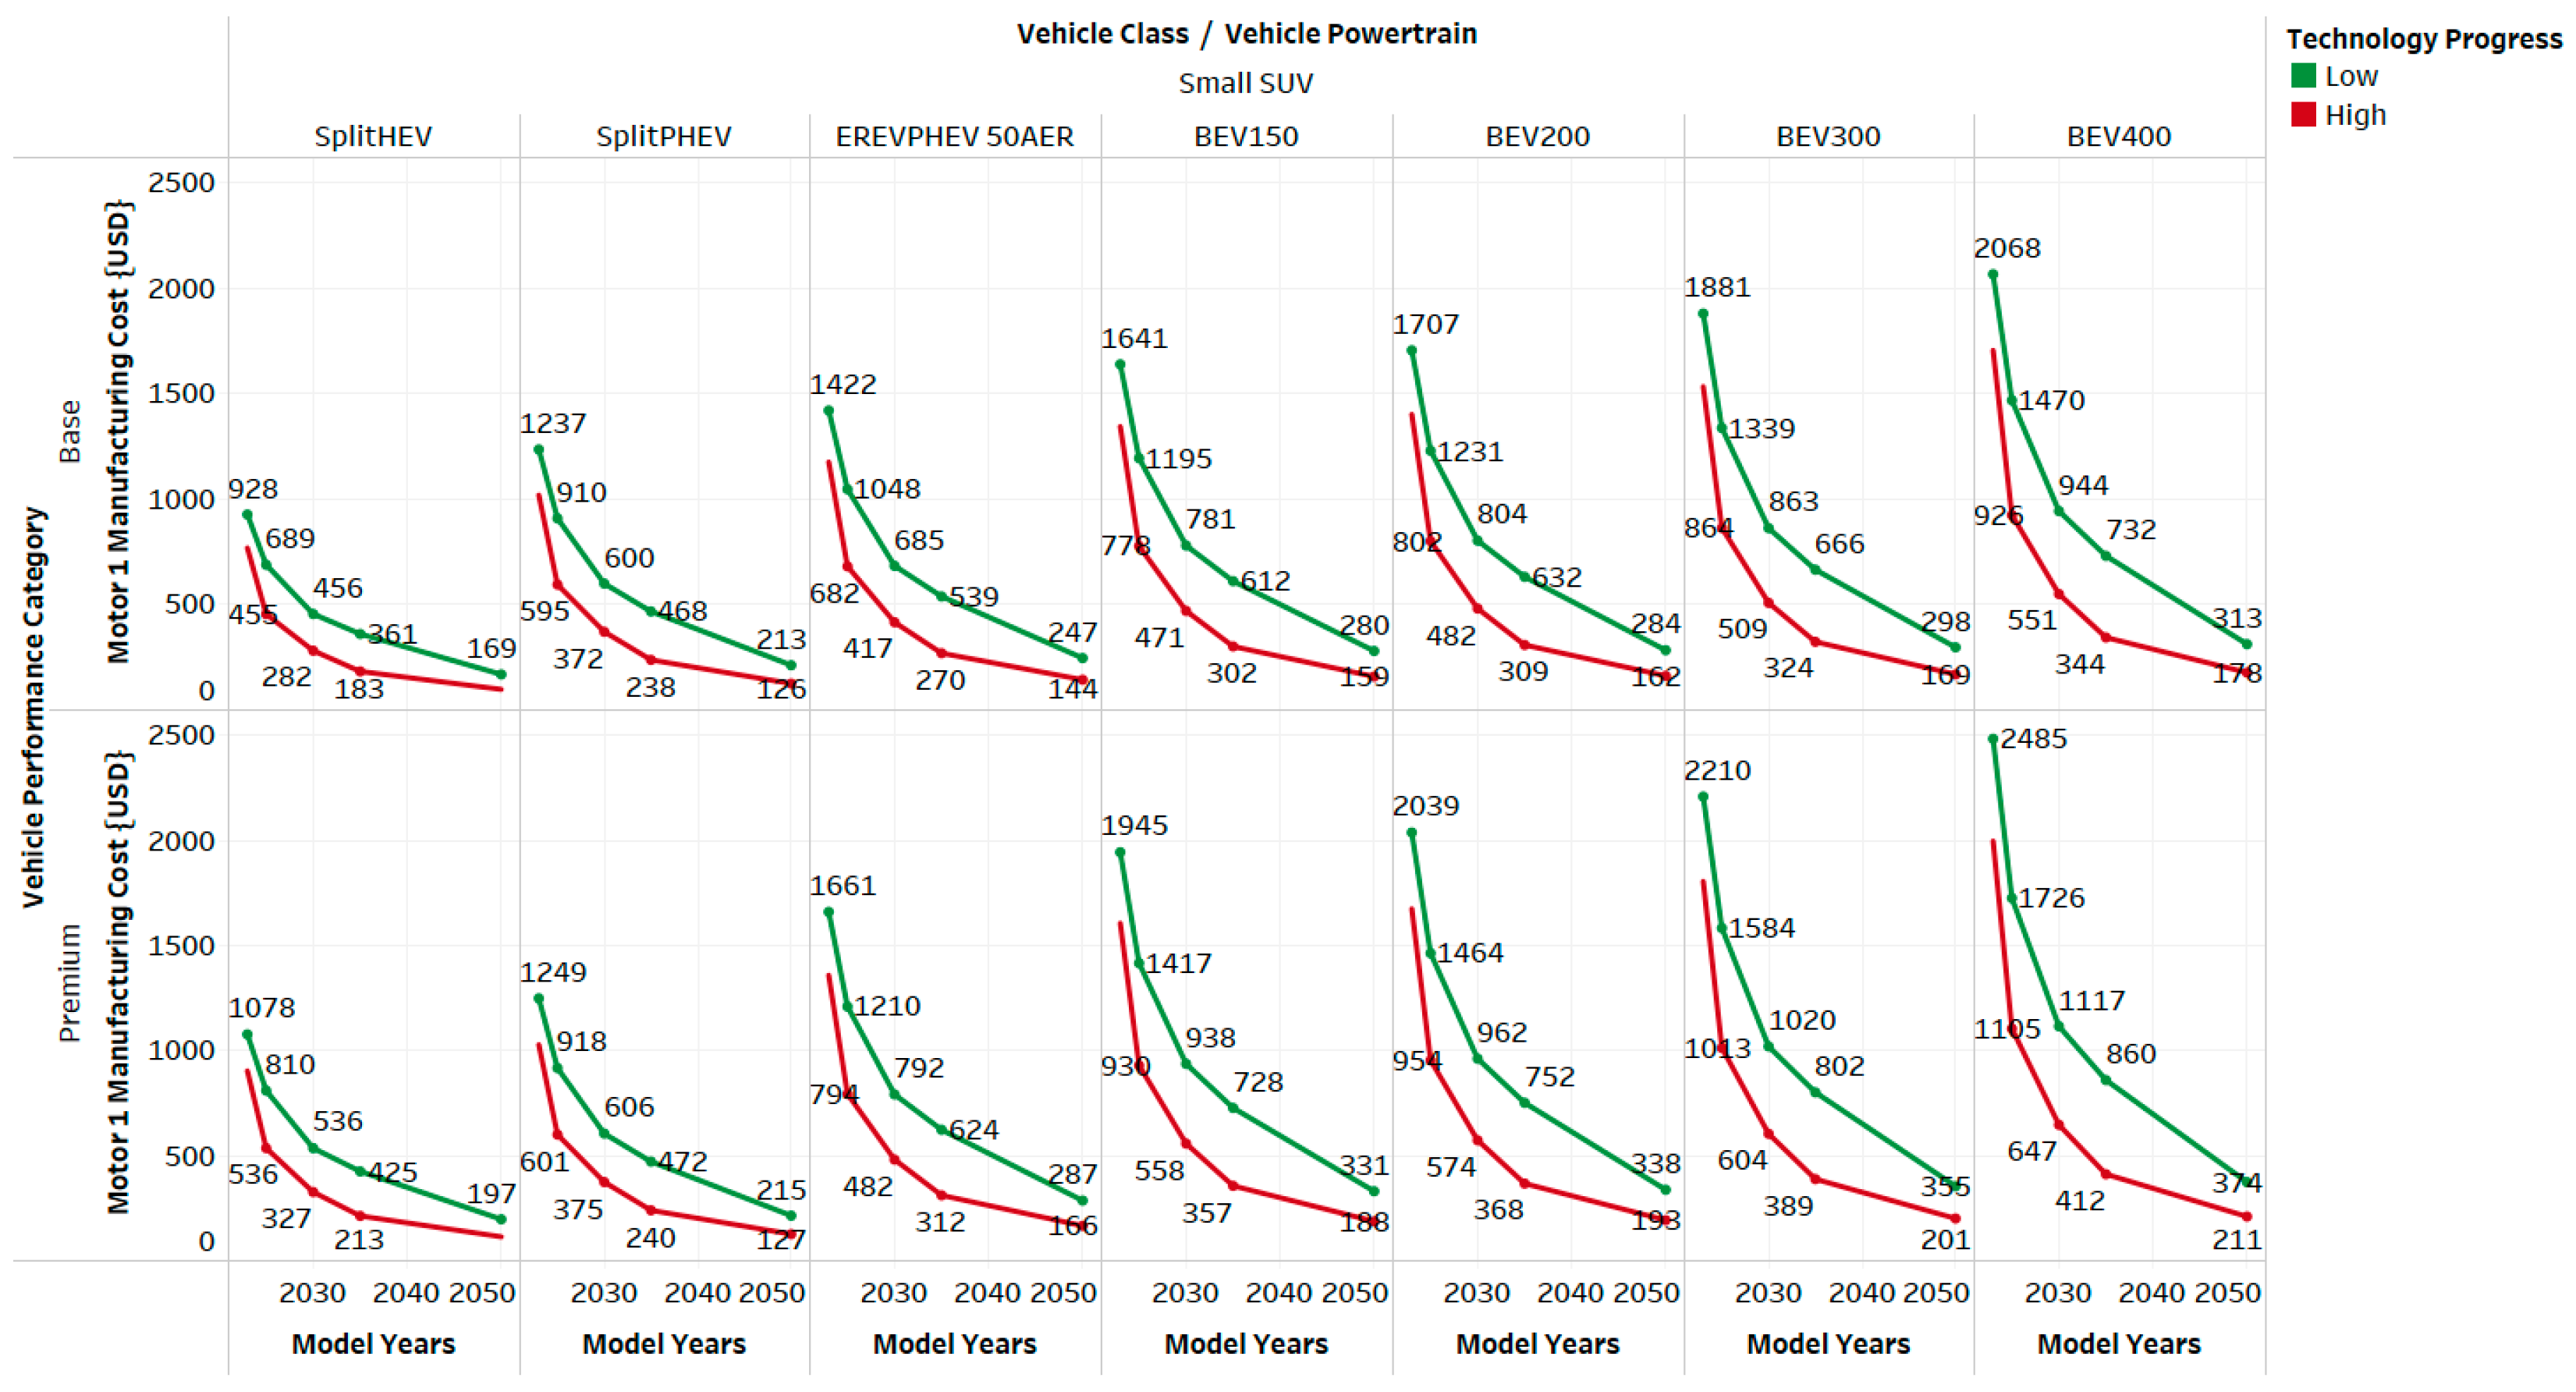
Motor cost of small SUVs.
Figure 8.
Motor cost of small SUVs.
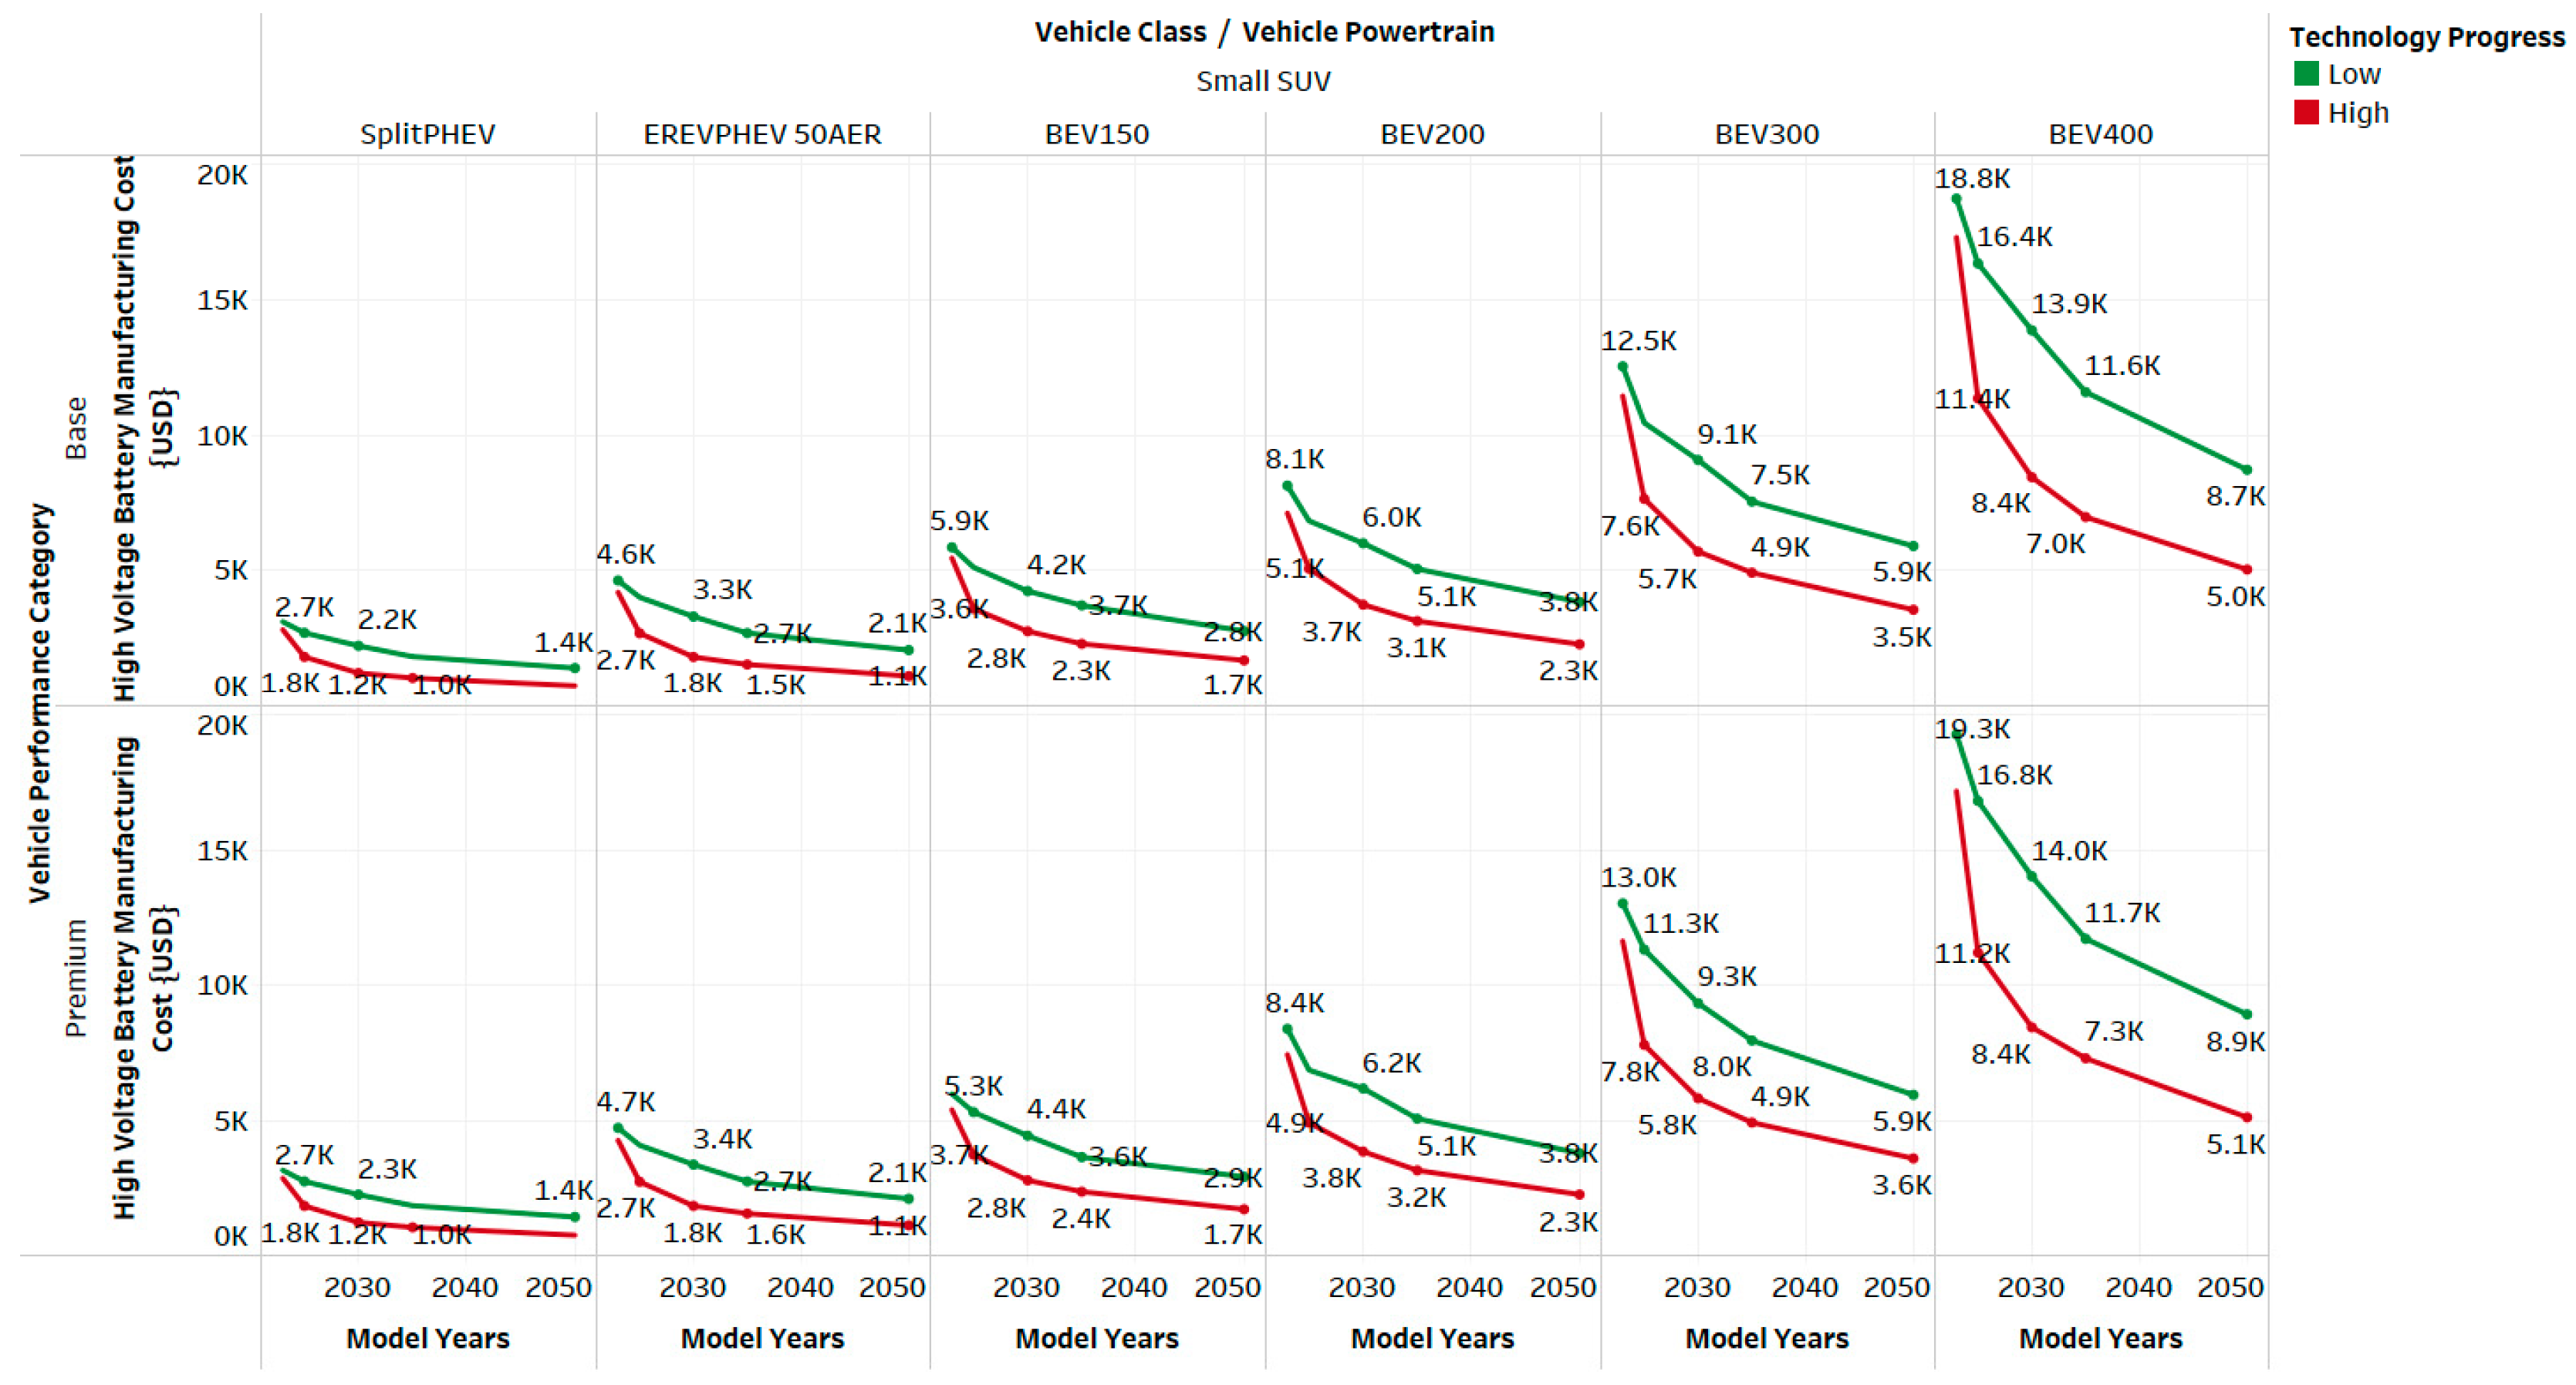
Battery cost for small SUVs.
Figure 9.
Battery cost for small SUVs.
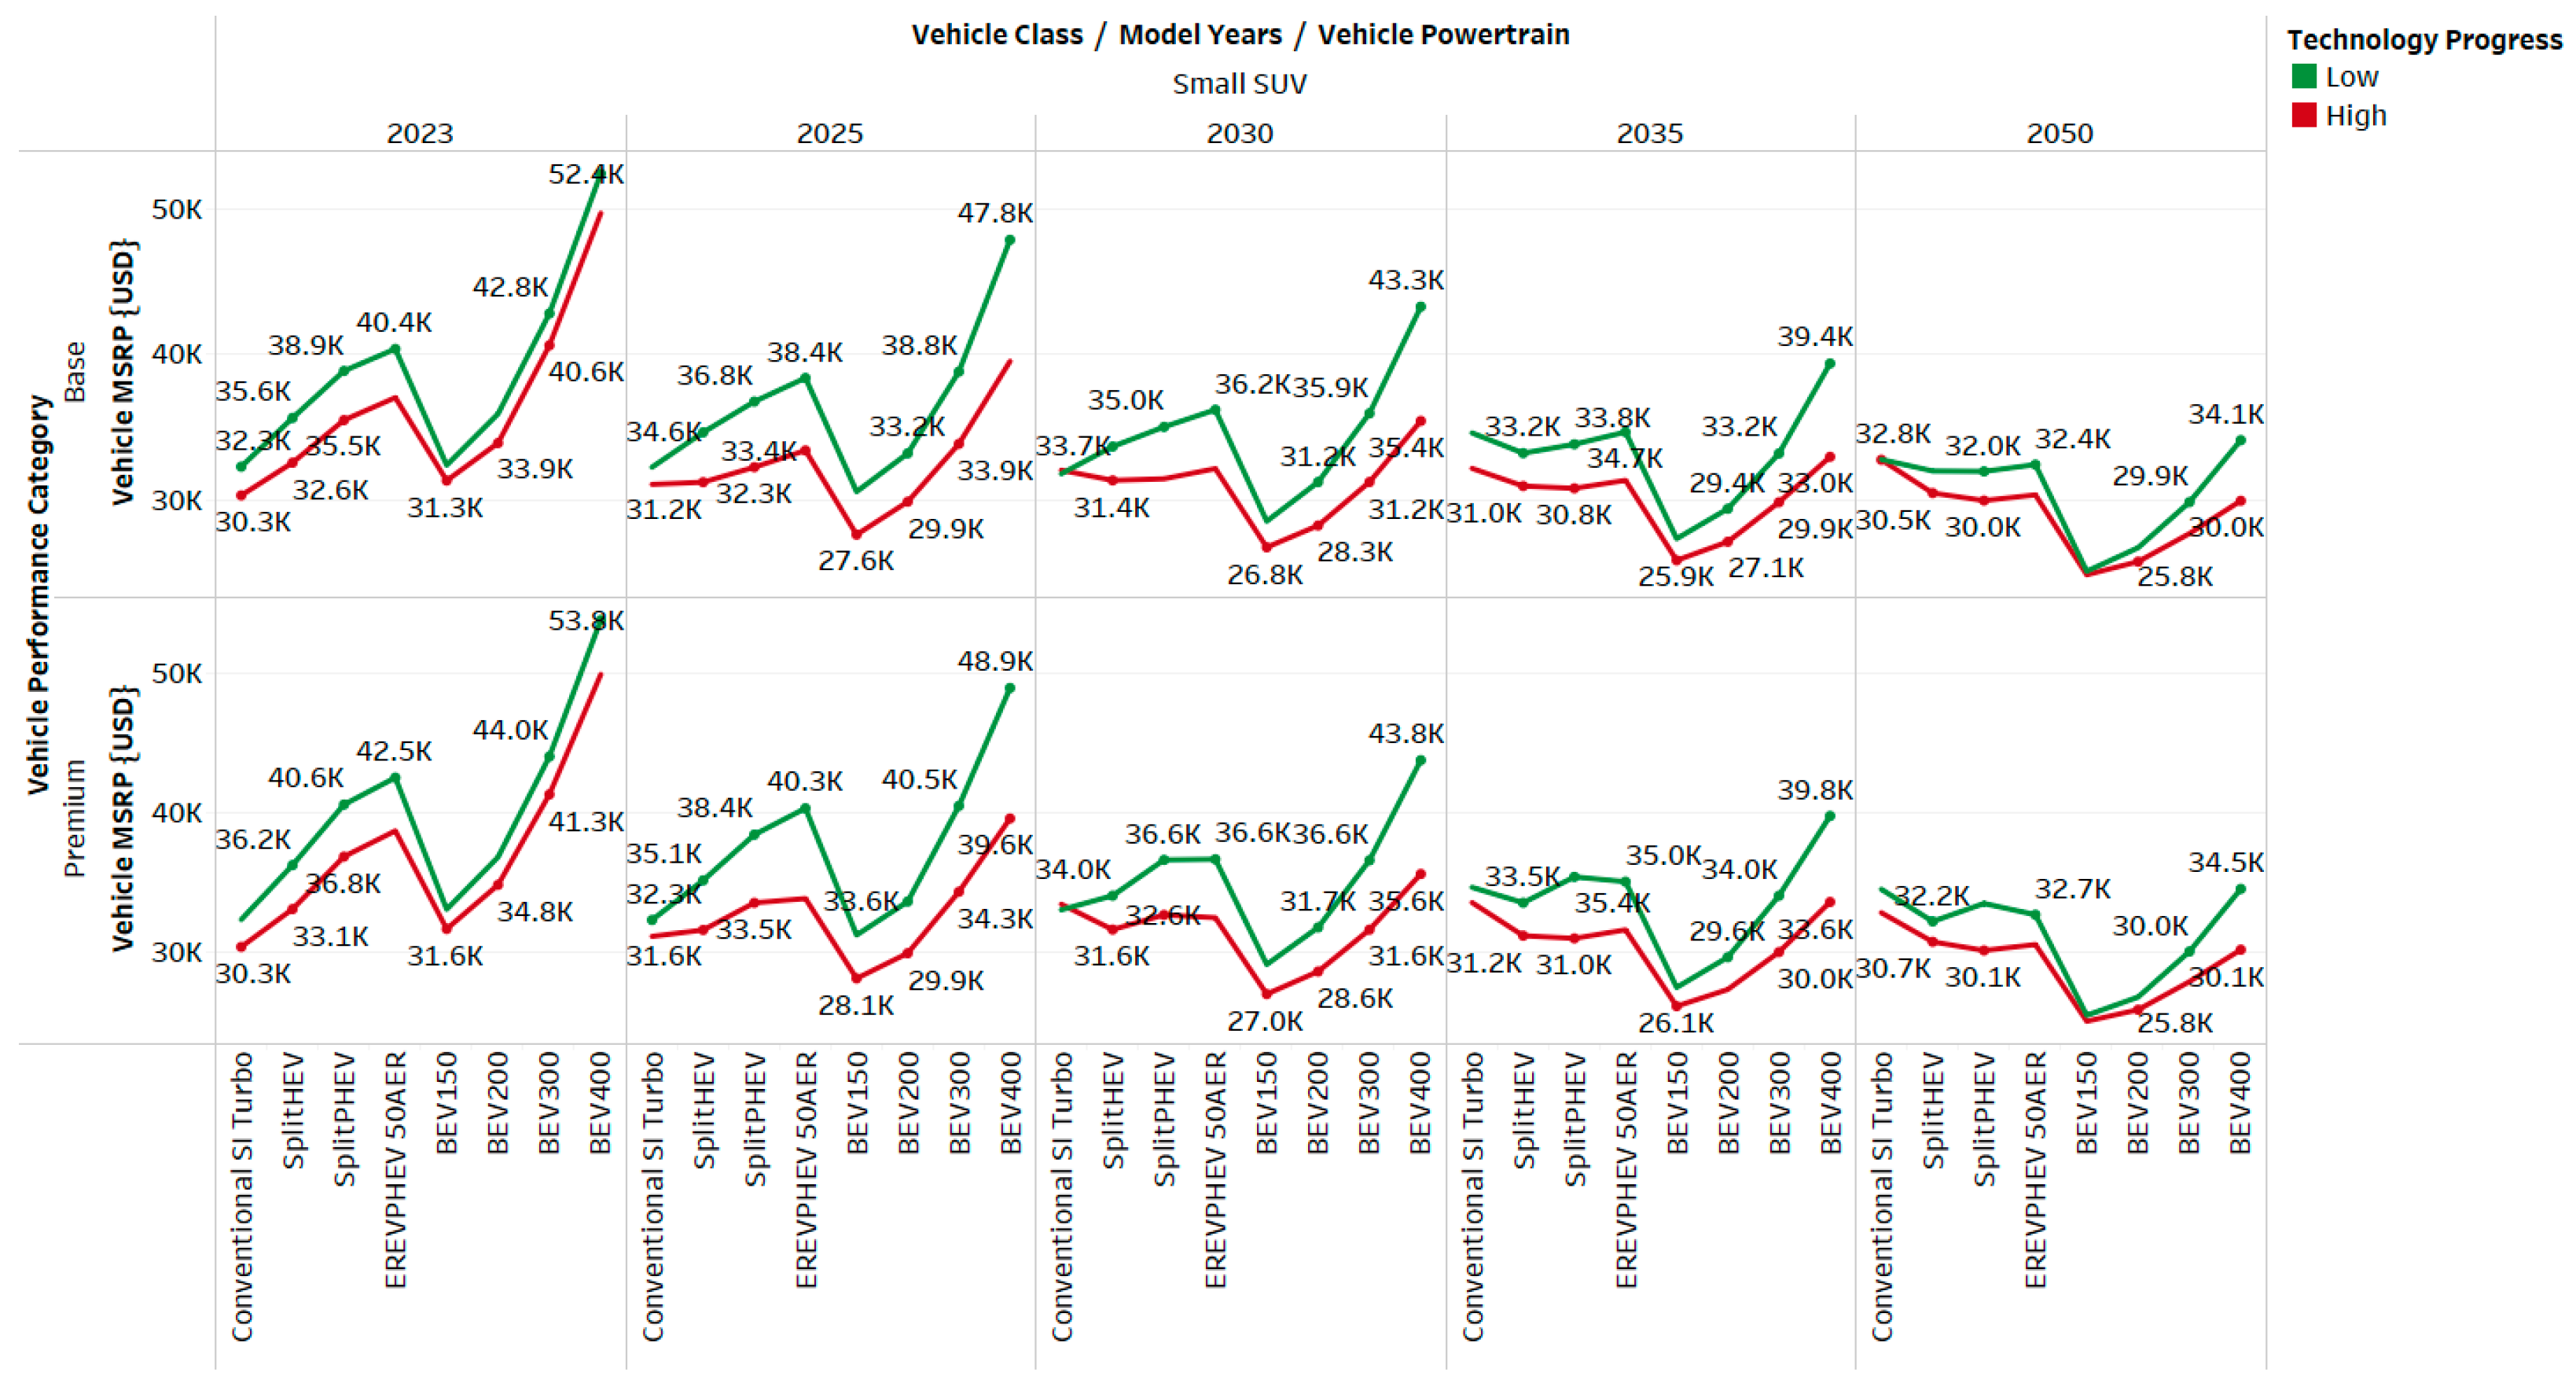
Vehicle MSRPs of small SUVs.
Figure 10.
Vehicle MSRPs of small SUVs.
Manufacturing cost vs. fuel consumption of conventional vehicles.
Figure 11.
Manufacturing cost vs. fuel consumption of conventional vehicles.
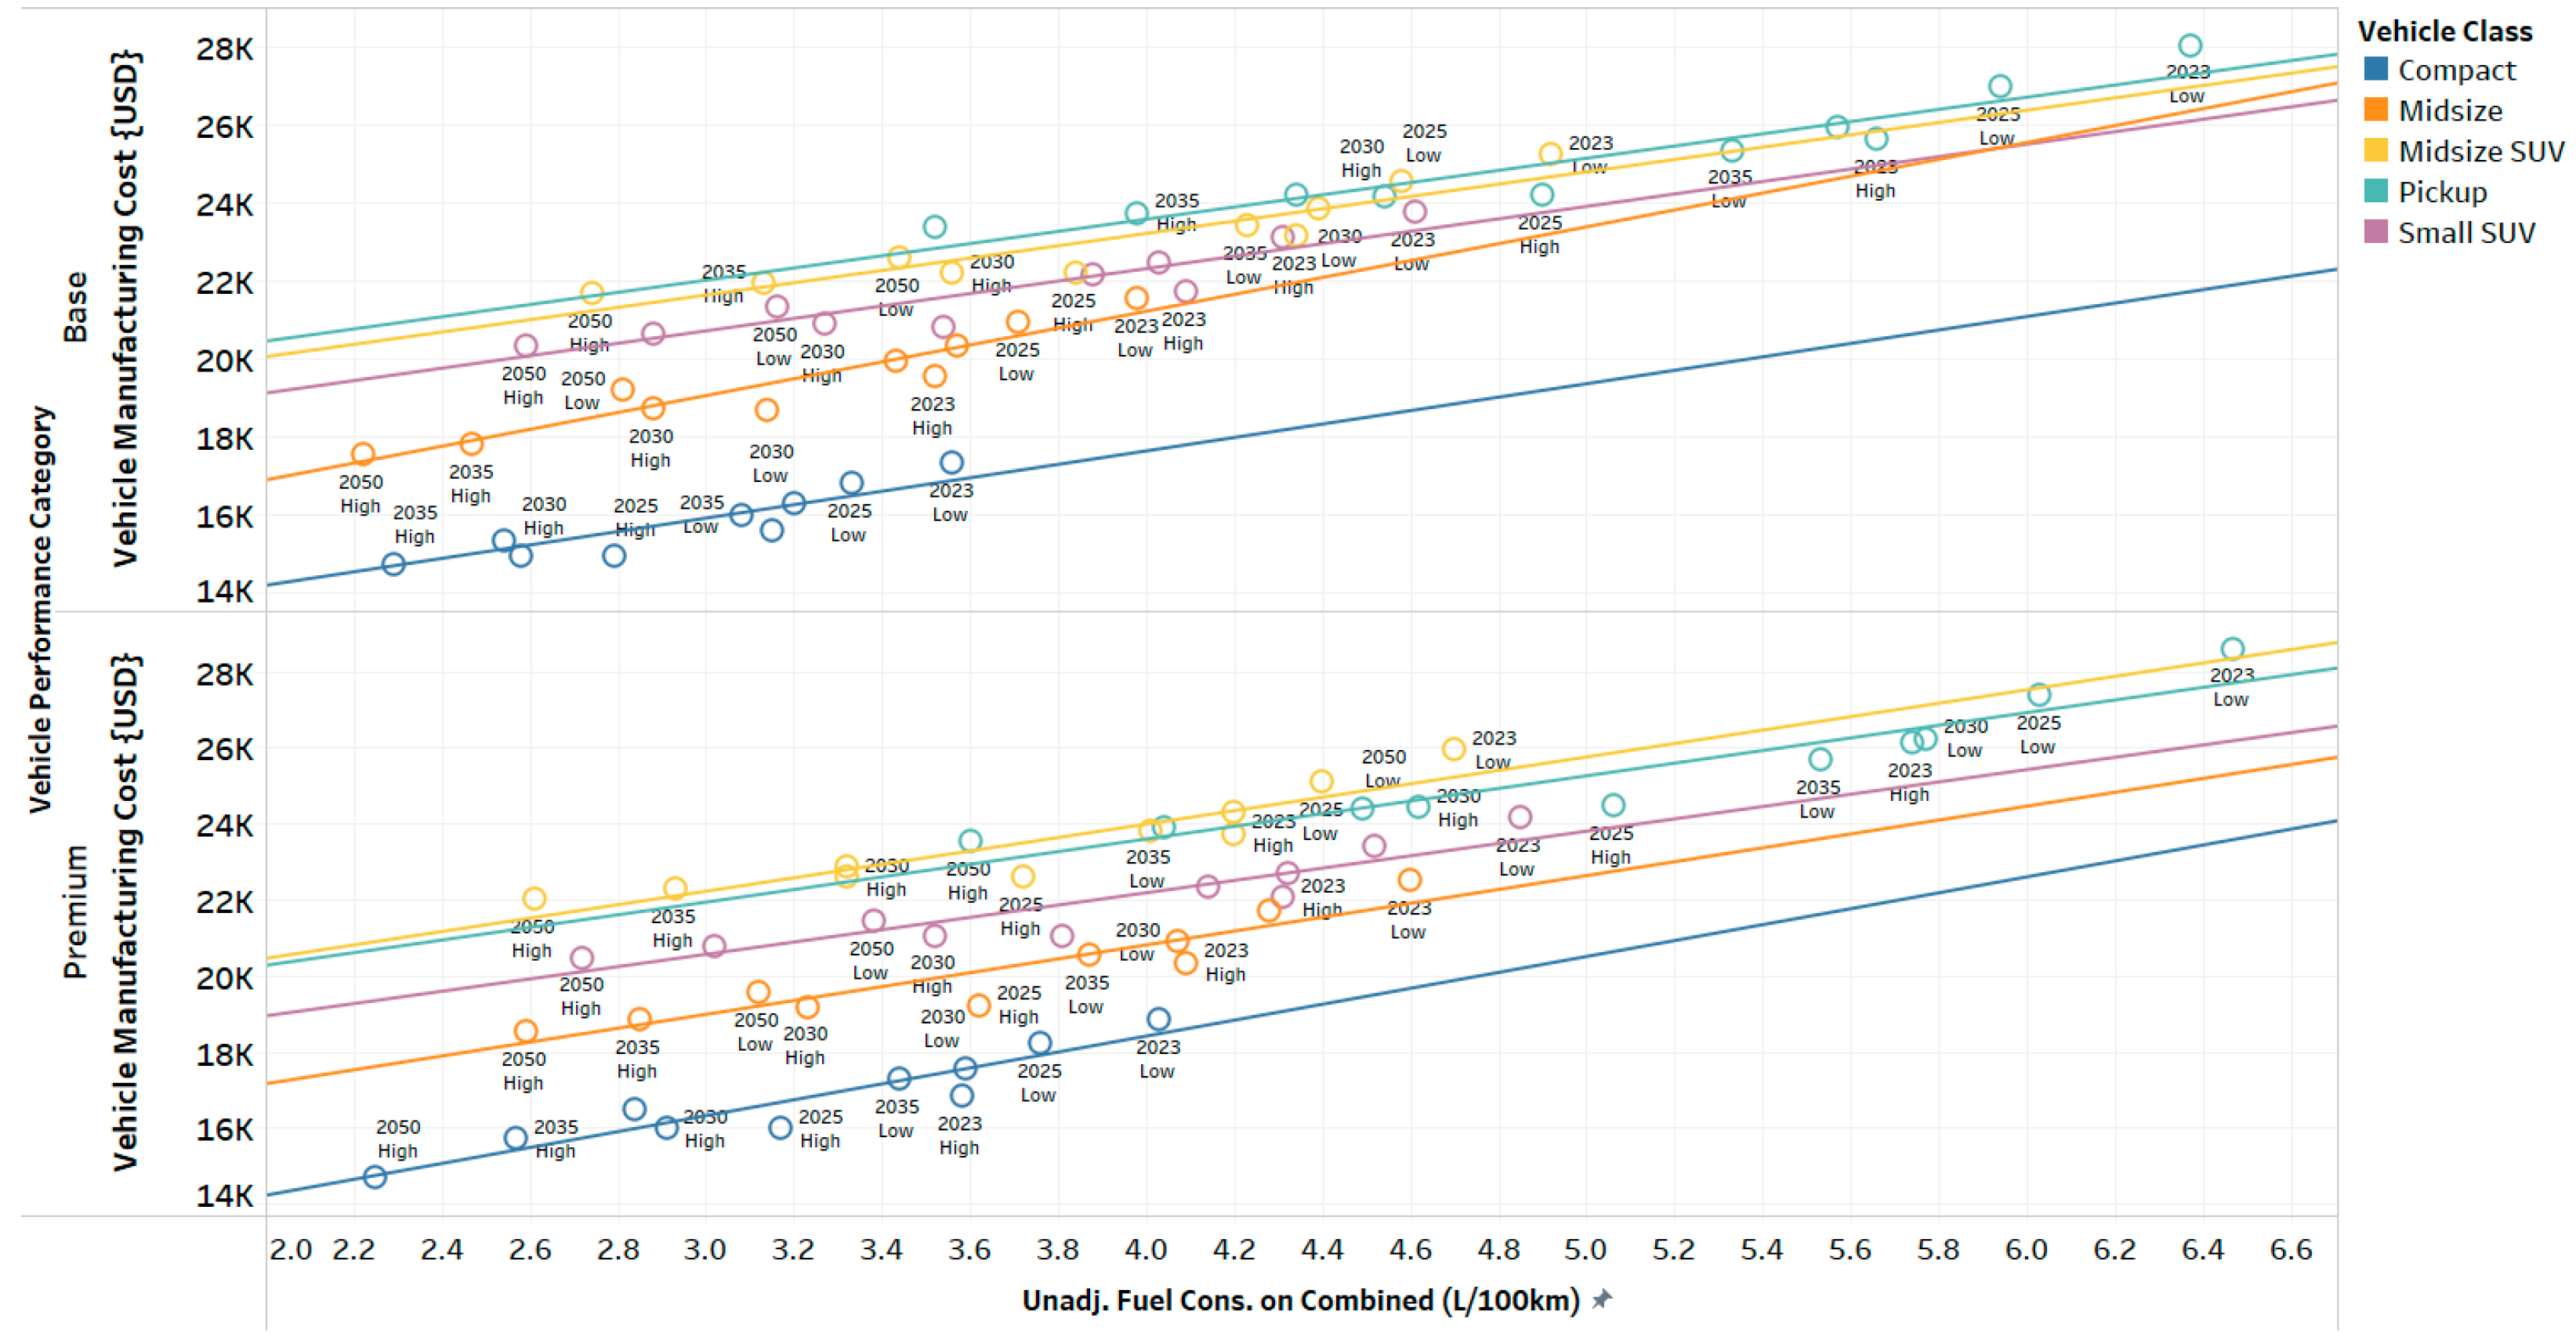
Manufacturing cost vs. fuel consumption of split HEVs.
Figure 12.
Manufacturing cost vs. fuel consumption of split HEVs.
Manufacturing cost vs. fuel consumption of PHEVs.
Figure 13.
Manufacturing cost vs. fuel consumption of PHEVs.
BEV manufacturing cost vs. electrical energy consumption.
Figure 14.
BEV manufacturing cost vs. electrical energy consumption.
Levelized cost of driving cost comparisons across different powertrains.
Figure 15.
Levelized cost of driving cost comparisons across different powertrains.
Total cost of ownership comparison across powertrains for small SUVs.
Figure 16.
Total cost of ownership comparison across powertrains for small SUVs.
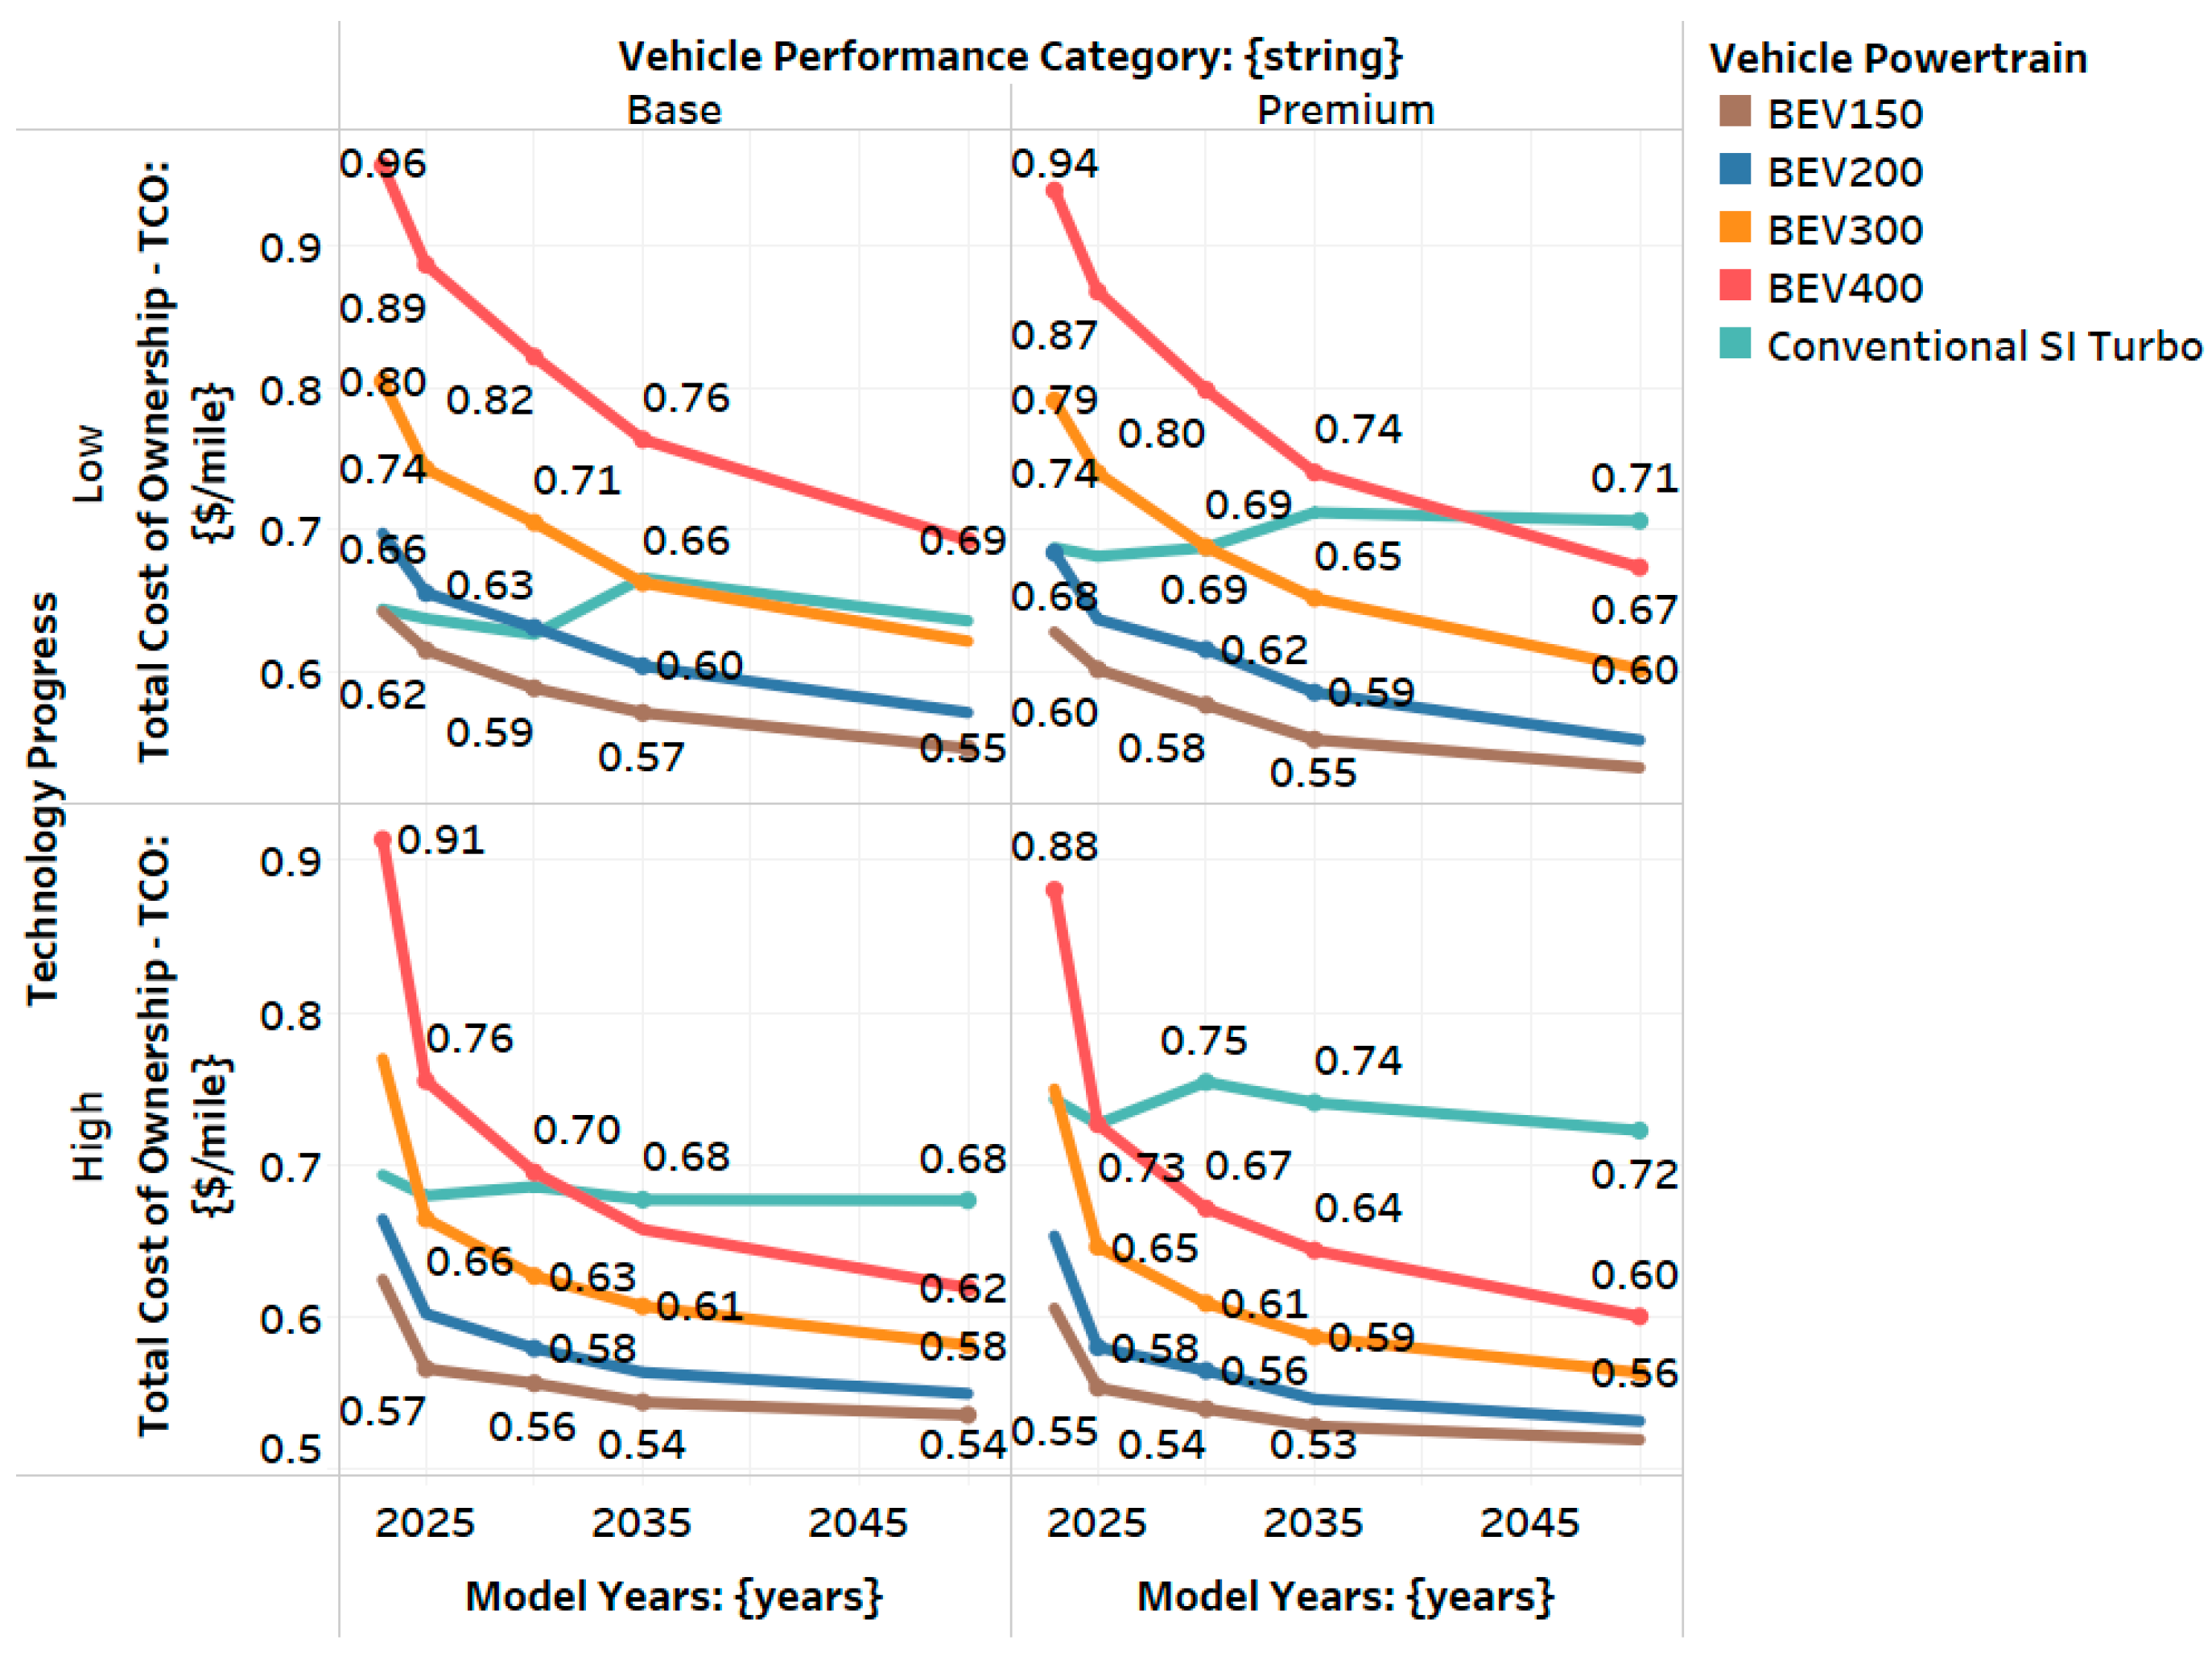
Table 1.
Technology assumptions.
Table 1.
Technology assumptions.
| 2023 | 2025 | 2035 | 2050 | ||||
|---|---|---|---|---|---|---|---|
| Low | Low | High | Low | High | Low | High | |
| Conventional Engine Peak Efficiency (%) | 36 | 38 | 43 | 42 | 45 | 44 | 47 |
| Hybrid Engine Efficiency (%) | 40 | 40 | 46 | 41 | 48 | 43 | 50 |
| Electric Machine Cost (USD/kW) | 12 | 9 | 6 | 4.8 | 3.2 | 2.25 | 1.5 |
| Specific Power @ 70% SOC—HEVs (W/kg) | 2750 | 3000 | 4000 | 4500 | 5500 | 5000 | 6000 |
| Battery Pack Energy Density—PHEV (Wh/kg) | 100 | 136 | 140 | 147 | 165 | 144 | 189 |
| Battery Pack Energy Density—BEV (Wh/kg) | 189 | 189 | 244 | 255 | 308 | 298 | 337 |
| Battery Pack Cost—HEVs (USD/kW) | 20 | 20 | 16 | 18 | 14 | 17 | 13 |
| Battery Pack Cost—PHEV (USD/kWh) | 200 | 150 | 110 | 90 | 75 | 70 | 60 |
| Battery Pack Cost—BEV (USD/kWh) | 140 | 128 | 95 | 90 | 70 | 70 | 60 |
Table 2.
Vehicle classification, performance categories, and characteristics.
Table 2.
Vehicle classification, performance categories, and characteristics.
| Vehicle Class | Performance Category | 0–60 mph Time (s) | Frontal Area (m2) | Drag Coefficient | Rolling Resistance |
|---|---|---|---|---|---|
| Compact | Base/Premium | 9/7 | 2.3 | 0.31 | 0.006 |
| Midsize | Base/Premium | 8/6 | 2.35 | 0.3 | 0.006 |
| Small SUV | Base/Premium | 8/6 | 2.65 | 0.36 | 0.006 |
| Midsize SUV | Base/Premium | 9/7 | 2.85 | 0.38 | 0.006 |
| Pickup | Base/Premium | 7/7 | 3.25 | 0.42 | 0.006 |
Table 3.
Energy consumption improvements across powertrain configurations and timeframes summary.
Table 3.
Energy consumption improvements across powertrain configurations and timeframes summary.
| Powertrain Type | 2023 | 2030 | 2050 | % Improvement (2023–2050) |
|---|---|---|---|---|
| Conventional | 6.6 L/100 km | 5.8 L/100 km | 3.4 L/100 km | 48% |
| HEV | 4.6 L/100 km | 4.0 L/100 km | 2.6 L/100 km | 43% |
| PHEV (Split PHEV) | 1.7 L/100 km | 1.6 L/100 km | 1.0 L/100 km | 41% |
| BEV (400) | 322 Wh/mile | 265.3 Wh/mile | 208.6 Wh/mile | 35% |
Table 4.
Projected cost reductions for batteries, motors, and vehicle MSRP for BEV 400 for small SUVs.
Table 4.
Projected cost reductions for batteries, motors, and vehicle MSRP for BEV 400 for small SUVs.
| Cost Component | 2023 | 2030 | 2050 | % Improvement (2023–2050) |
|---|---|---|---|---|
| Battery | 18,751 | 13,882 | 5036 | 73% |
| Motor | 2068 | 944 | 178 | 91% |
| Vehicle MSRP | 52,382 | 43,265 | 29,955 | 43% |
Disclaimer/Publisher’s Note: The statements, opinions and data contained in all publications are solely those of the individual author(s) and contributor(s) and not of MDPI and/or the editor(s). MDPI and/or the editor(s) disclaim responsibility for any injury to people or property resulting from any ideas, methods, instructions or products referred to in the content. |
Source link
Ehsan Sabri Islam www.mdpi.com