1. Introduction
Homeopathy is a widely used complementary medicine that has been practised for over 200 years. Homeopathic medicines have been used in the prevention and treatment of infectious diseases [
1,
2,
3,
4]. Oscillococcinum
® is traditionally used in the relief of influenza-like symptoms such as fever, headache, chills, and body aches. Patients with flu symptoms have shown a decline in symptoms 48 h after taking this homeopathic medicine [
5,
6]. Clinical studies show its efficacy in a population of Chronic Obstructive Pulmonary Disease (COPD) patients by reducing the frequency and the duration of Upper Respiratory Tract Infections (URTIs) during an outbreak of influenza [
7,
8]. In some cases, the severe form of infection by the influenza virus is accompanied by a cytokine/chemokine storm caused by an inflammatory response in the lungs [
9]. Cytokines are proteins secreted by cells that are essential for the communication between cells in the immune system and the resolution of infectious diseases. When the cytokines are intensively produced and uncontrolled, a cytokine storm is created, which causes damage to the cells and organs. This inflammatory state is closely related to oxidative stress. Under physiological conditions, the reactive oxygen species (ROS) are essential to regulate cell proliferation, migration, and apoptosis with the activation of various signalling pathways. An imbalance between the production of ROS and the antioxidant molecules leads to an increased level of oxidative stress. The over-production of ROS enhances the inflammatory state and damages biomolecules (proteins, nucleic acids, lipids), cell membranes, and organelles especially mitochondria [
10,
11].
Cellular mechanical properties, in particular stiffness, are critical for cellular processes such as migration, protrusion, division, and morphology [
12]. Actin filaments, part of the cytoskeleton, serve as the backbone for the intracellular force transmission and transduction of external mechanical signals via focal adhesion complexes [
13]. The assessment of cellular mechanical properties at a subcellular resolution is crucial for understanding these processes, with atomic force microscopy (AFM) being a commonly used approach [
14].
Microglial cells are the macrophage population present in the central nervous system. In a healthy brain, microglia are found in their ramified morphology, acting as sentinels, and maintaining homeostasis. They are activated by various stimuli caused by brain injury or disease [
15,
16]. When the cells are in an activated state, their morphology changes, and they move towards the damaged site via chemotaxis. It is clear that microglial cells play a key role in the pathophysiology of neurodegeneration [
17]. A brain injury results in a cascade of cellular responses which produce neuroinflammation. In rats, distinct subpopulations of microglial cells move directly to the damaged site [
18]. Primary microglial cells are good candidates for studying oxidative stress and homeopathic drugs because they are susceptible and reactive cells [
19].
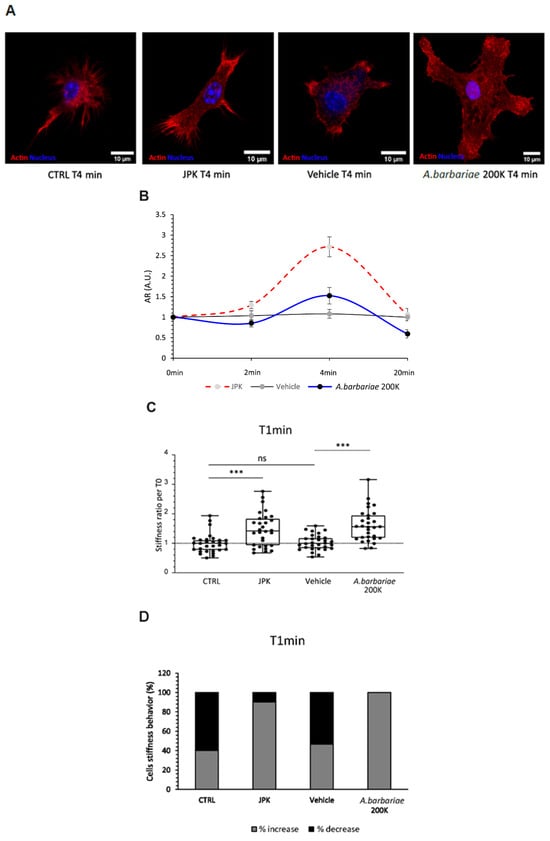
In the present study, we evaluated the activity of Anas barbariae 200K dilution in vitro in murine microglial cells focusing on the cell surface ultrastructure, the reorganisation of the cytoskeleton, and the antioxidant properties using atomic force microscopy and fluorescence microscopy techniques. This comprehensive approach promises to provide insights into the therapeutic potential and mechanistic actions of Anas barbariae 200K in modulating inflammatory responses.
3. Discussion
The results of our study shed light on the potential therapeutic effects of
A. barbariae 200K in modulating the inflammatory responses, particularly in the context of microglial cell mechanics. In resting microglial cells, our results suggest that
A. barbariae 200K induces a rapid increase in the cell stiffness, followed by a subsequent softening phase. This dynamic response highlights the complex interplay between
A. barbariae 200K treatment and the cellular mechanics over time. In the present study for ROS assessment, the microglial cells were firstly inflamed with LPS alone for 4 h and then treated with
A. barbariae 200K (CellROX experiments). In our previous study [
20], the microglial cells were treated with
A. barbariae 200K before the inflammation with LPS. The order of the treatments was irrelevant, as the effect of
A. barbariae 200K still remained the same. Regarding the stiffness, the results showed that
A. barbariae 200K increased the cell stiffness of resting cells and decreased it in inflamed cells. In Runel et al. [
20], we only investigated resting cells, and the same effect on the cell stiffness was found. Although different production batches of
A. barbariae 200K were used in both studies, we observed similar effects on the ROS production and cell stiffness. This present study reinforces and complements our previous results reported in Runel et al. [
20].
The increase in cell stiffness following
A. barbariae 200K treatment aligns with its known immunomodulatory properties. Previous studies have implicated microglial activation and subsequent inflammatory responses in the pathogenesis of several neurological diseases [
21]. LPS-induced immune activation led to changes in traction forces and increased the migration [
22]. Our results suggest that
A. barbariae 200K may exert its therapeutic effects by modulating the mechanical properties of microglial cells, potentially influencing their activation state and inflammatory phenotype. AFM is a recognised method to study the anti-inflammatory effects of drugs on inflamed macrophages. The authors demonstrated the morphological and ultrastructural change of the cells with LPS, DEX or quercetin using topography images [
23].
Interestingly, our results also demonstrate that
A. barbariae 200K treatment leads to cytoskeletal remodelling, as evidenced by the redistribution of filamentous actin towards the cellular extremities. This finding supports the notion that
A. barbariae 200K affects the morphology and function of microglial cells, potentially influencing their ability to respond to inflammatory stimuli. Fuselier et al. showed a reduction in stiffness in response to Ruta graveolens 9CH dilution using B16F10 melanoma cells [
24]. The stiffness behaviour of the cells with the treatment is highly specific regarding the cell type and the homeopathic preparation.
We also showed that
A. barbariae 200K decreased the total intracellular ROS production in LPS-inflamed microglial cells for both short and longer periods. This antioxidant effect was previously described with other homeopathic preparations [
25,
26]. Moreover, the antioxidant properties of drugs have been well documented in this primary cell model [
27].
Some studies have shown that LPS-inflamed microglial cells reduced significantly the ROS production in the presence of cannabinoids [
28,
29]. Knowing that ROS are mainly generated by mitochondria in cells [
30], we also found a rapid ROS production located in the mitochondria in microglial cells. It is well described that ROS and an actin cytoskeleton are closely linked. The production of ROS affects actin polymerisation and acts as a cellular defence mechanism [
31]. One hypothesis is that the decrease in ROS in inflamed microglial cells with
A. barbariae 200K could be explained by this actin reorganisation. Another possibility is the involvement of the extracellular vesicles (EVs) secreted by the cells with antioxidant capacity. These EVs contain mRNA, miRNA, and proteins and they can carry different antioxidant enzymes such as superoxide dismutase (SOD) and catalase, as well as reactive oxygen molecules, thereby regulating oxidative stress [
32,
33,
34]. It would be interesting to analyse the contents of EVs secreted by the inflamed microglial cells in response to homeopathic products, as the mechanism of action of homeopathic dilutions is currently not well understood.
Moreover, our study provides insights into the temporal dynamics of
A. barbariae 200K treatment on the cellular mechanics. The observed initial increase in the cell stiffness followed by softening suggests a biphasic response to
A. barbariae 200K, which may have important implications for its therapeutic efficacy. Moreover,
A. barbariae 200K treatment redistributed filamentous actin towards inflamed cells’ extremities. In inflamed microglial cells, the redistribution of actin is well described, and this shift of actin is correlated to a change in microglial behaviour. The cytoskeleton rearrangement via actin polymerisation and ROS have been shown to influence phagocytosis [
35,
36,
37]. Further investigation into the underlying molecular mechanisms driving these dynamic changes is warranted to fully elucidate the therapeutic potential of
A. barbariae 200K in diseases.
In conclusion, our study highlights the potential of
A. barbariae 200K as a therapeutic agent for modulating inflammatory responses. The mechanism of action is not yet well identified for homeopathic preparations. However, in the literature, there are several pieces of scientific evidence that homeopathic preparations have an effect on cell function such as oxidative stress, cell stiffness modulation and membrane organisation, neurite outgrowth, bioenergetic, gene expression, DNA damage, and inflammation [
24,
25,
26,
38,
39,
40,
41]. Our future studies will explore the molecular pathways involved in
A. barbariae 200K-mediated immunomodulation.
4. Materials and Methods
4.1. Homeopathic Solutions
The homeopathic solutions were prepared by Laboratoires Boiron (Messimy, France) in compliance with the European Pharmacopoeia (Ph. Eur.) monographs according to the monograph 2371 and 1038 [
42,
43].
Anas barbariae 200K (
A. barbariae 200K) is a patented preparation produced by Laboratoires Boiron. It is Hepatis et Cordis Extractum solution obtained from an autolysate of the liver and heart of the Barbary duck (Anas barbariae), diluted and potentised 200-fold using Korsakov’s method (200K). The same batch of sterile water (OTEC
® Laboratoires Aguettant, Lyon, France) was used as the vehicle in all the experiments. The homeopathic preparations were blinded and tested on cells to avoid experimental bias. The blinding was performed by a person not involved in the experiment. The decoding of the samples was revealed after the statistical analyses.
4.2. Primary Murine Microglial Cells
The protocol of microglial cell preparation and the cell seeding for the treatments were as previously described [
25]. Briefly, murine microglial cells were collected from whole brains of postnatal day 0 mouse pups. After manual dissociation and several centrifugation steps at 200 g for 5 min, the brain cell pellet was resuspended in a cell culture medium and plated in T-75 flasks. Then, the cells were cultured for 20 days to obtain a culture enriched in microglial cells.
4.3. Atomic Force Microscopy (AFM) Sample Preparations
The cells were seeded on polyethyleneimine PEI-coated Nunc® 35mm Petri dishes at a density of 250,000 cells/well. The next day, the entire culture medium was replaced to remove debris. Before adding the treatments, the stiffness of the cells was measured at T0. The cells were incubated with A. barbariae 200K (6% v/v), the vehicle (6% v/v) or JPK (25 nM), and the stiffness was measured after 1 min. The resting control cells corresponds to the condition without any treatment. All the experiments were performed in the complete culture medium at room temperature. The kinetic study of the cells aimed to investigate the cell stiffness, with AFM data recorded at intervals of 1 min, 2 min, 4 min, and 20 min after the addition of the treatment. Additionally, two other kinetics were conducted to identify the optimal time point for treatment-induced cell activation and the most responsive time point following treatment with A. barbariae 200K. For the LPS activation, five time points were examined at 2 h, 4 h, 6 h, 8 h, and 24 h compared to T0, with measurements taken randomly on ten cells. Similarly, the response time points for A. barbariae 200K treatment were assessed at 2 min, 4 min, and 20 min compared to T0, using the same number of cells.
AFM indentation experiments were carried out using a Resolve Bioscope (Bruker Nano Surface, Santa Barbara, CA, USA) that was mounted on an optical microscope (DMi8, Leica, Wetzlar, Germany) equipped with a 20× objective. A Nanoscope V controller with Nanoscope software version 8.15 was used. All the quantitative measurements were performed using standard pyramidal tips (ScanAsyst-Air, Bruker AFM probes, Inc., Camarillo, CA, USA). The tip radius given by the manufacturer was 8–12 nm. The spring constant of the cantilever was measured using the thermal tune method and was 0.4 N/m [
44]. The deflection sensitivity of the cantilever was calibrated against a sapphire wafer. The Petri dish was positioned on an XY motorised stage and held using a magnetic clamp. Then, the AFM head was mounted on the stage. Only isolated cells were used for the AFM measurements. Each AFM experiment consisted of acquiring a matrix of force-indentation curves. For each condition, the study was conducted on 30 isolated cells. Force curves were acquired using different modes depending on the experiments.
For comprehensive cell measurements and time-lapse studies, force curves were obtained using the Ramp mode. Each AFM measurement entailed acquiring 100 force-indentation curves, sampled from a 10 × 10 µm grid with indentation points spaced 200 nm apart, all on a single cell. A force of 100 nN was applied at a rate of 5 Hz, with a sampling of 2048 points per curve.
4.4. Atomic Force Microscopy (AFM) Analysis
For the global measurement and kinetic study, we used the Hertz–Sneddon model to extract quantitative data on the elastic modulus from each curve, covering an indentation range of 0 to 1 µm. This model is particularly suitable when the indentation depth is smaller than the sample thickness, which applies here, as our cell samples typically ranged between 5 and 10 µm thick, and the indentation depth remained below 1 µm [
45,
46].
The Hertz–Sneddon model assumes a rigid cone indenting a flat surface, with the force (F) from the force curve given by the formula:
F is the force from the force curve, E is the Young’s modulus, ν is the Poisson’s ratio, α is the half-angle of the indenter and δ is the indentation.
We assumed that our sample was perfectly incompressible, leading us to utilise a Poisson’s ratio of 0.5. However, due to the uncertainties regarding both the Poisson’s ratio and the exact shape of the tip, we only report an “apparent modulus” (Ea) in this study. Since the experimental conditions remained consistent across all the samples examined, Ea serves as a reliable metric for the comparisons with a high degree of confidence.
4.5. Confocal Microscopy
The cells were initially seeded onto PEI-coated Nunc® 35 mm Petri dishes at a density of 250,000 cells per dish. Subsequently, treatments were administered following the protocol outlined for the AFM experiments. Post-treatment, the cells underwent a sequential procedure: first, they were rinsed once with phosphate-buffered saline (PBS) and then fixed for 10 min at room temperature with a 3.7% formaldehyde solution in PBS. This fixation was performed at different time points 1 or 4 min after the treatments, depending on the experiment.
After the fixation, the cells were washed twice for 5 min in PBS buffer. Subsequently, actin filaments were stained using 2 µM Phalloidin–Tetramethylrhodamine and the nucleus was stained with 2 µM 4′,6-diamidino-2-phenylindole (DAPI) from Sigma-Aldrich-Merck (Saint-Quentin-Fallavier, France). Following the staining, the cells were rinsed twice with PBS 1X solution, and the medium was replaced with a PBS/glycerol mixture (50/50). Finally, coverslips were placed onto the Petri dishes. A homemade 3D-printed support was used to hold the dish on the microscope, and images were acquired using an LSM 980 confocal microscope (Carl Zeiss, Rueil-Malmaison, France) equipped with a ×63 objective (Plan-Apochromat 63×/1.40 oil M27 with a numerical aperture of 1.40 and a working distance of 0.19 mm). Image quantification was performed using the open-source Image J software (version 1.54f).
4.6. Viability Assay
XTT reduction assays (Cell Proliferation kit II, Roche Diagnostics, Meylan, France) were carried out to investigate the cell viability, as previously described [
25]. Microglial cells were seeded on a PEI-coated Nunc
® 96-well plate at the density of 50,000 cells/well. The next day, the cells were treated with 10 ng/mL LPS for 4 h and treated with
A. barbariae 200K (1%, 3%, 6%, and 12%
v/
v) or the vehicle (1%, 3%, 6%, and 12%
v/
v) for 20 h. Four hours before the end of the treatment, XTT labelled mixture (0.3 mg/mL final concentration) was prepared in accordance with the manufacturer’s instructions and was added to each well. The absorbance at 465 nm (formazan) and at 650 nm (reference wavelength) was quantified using the SPARK 10M microplate reader (Tecan). The absorbance values obtained were used to determine the cell viability. Wells without cells were performed and used as blank references. LPS-treated cells were considered as viability references (viability ratio = 1).
4.7. Measurement of the Total and Mitochondria-Derived ROS Level
The level of reactive oxygen species (ROS) was assessed using two different cell-permeant dyes: CellROX™ Deep Red (Invitrogen, Illkirch, France) and MitoSOX™ Red (Invitrogen, Illkirch, France). The probes are non-fluorescent while in a reduced state and exhibit bright fluorescence when CellROX Deep red is oxidised by multiple reactive oxygen species and MitoSOX red with anion superoxide. Fluorescence provides a direct measure of the ROS levels. For the CellROX assay, the microglial cells were inflamed with LPS (10 ng/mL, E. coli strain O111:B4, Sigma-Aldrich-Merck, Saint-Quentin-Fallavier, France) for 4 h and treated with A. barbariae 200K (6% v/v), the vehicle (6% v/v) or dexamethasone (DEX 0.63 µM, Sigma-Aldrich-Merck, Saint-Quentin-Fallavier, France). After 6 h or 20 h of LPS, the cells were stained with 10 μM CellROX™ Deep Red reagent for 30 min. For the MitoSOX assay, the cells were incubated for 4 h with LPS and then co-incubated with the same treatments described above for 2 h, except the DEX concentration was at 2.9 µM instead of 0.63 µM. Before the end of the treatments, the MitoSOX™ Red probe (2.5 µM) was added for 10 min. At the end of the incubations, the cells were washed with Dulbecco’s Phosphate Buffered Saline (DPBS) and fixed with 3.7% formaldehyde solution (Sigma Aldrich-Merck F1635) in DPBS before image acquisition. For each well, at least 3 images were randomly acquired with identical exposure parameters using an inverted fluorescence microscope (Zeiss, Axio Observer Z1) equipped with a Hamamatsu camera (Orca Flash 4.0) and an LD Plan-Neofluar 20× objective. The quantification of fluorescence was performed using the open-source ImageJ software (version 1.50i). The intensity of the fluorescence was proportional to the total ROS or mitochondrial superoxide anion level. The results are expressed as a fractional change in the fluorescence intensity relative to the baseline in the untreated cells without LPS stimulation.
4.8. Statistical Analysis
4.8.1. ROS
The statistical analyses were performed using GraphPad Prism 7 for Windows (GraphPad Software, San Diego, CA, USA). All the results are presented as the mean ± standard deviation (SD). Each result is representative of at least three independent experiments. The Shapiro–Wilk test was used to check if the analysed data were normally distributed. The Kruskal–Wallis test (nonparametric One-way ANOVA) was used to evaluate the statistical significance, as indicated by a * p < 0.05, ** p < 0.01, *** p < 0.001, **** p < 0.0001. A post hoc test was conducted using Tukey’s multiple comparisons test.
4.8.2. AFM
The statistical analyses were conducted on all the experimental data using R Studio. The normality was assessed using the Shapiro–Wilk test, while the homogeneity of variances was assessed using the Levene test. The comparisons of means were made using either the t-test or the Wilcoxon test, with significance levels denoted as follows: * p < 0.05; ** p < 0.005; *** p< 0.0005.