1. Introduction
Water supply systems are frequently subject to various failures that degrade service quality and cause complete disruptions in supply to consumers [
1]. In this context, decision-makers managing and planning water distribution networks (WDNs) must assess their resilience to minimize the potential impacts of such failure events [
2]. This analysis aims to enhance the capacity of the network to consistently provide water of adequate quantity and quality, ensuring that it meets the demands of its consumers effectively. Pipe failures can occur for several reasons [
3], including aging and poor pipe material quality, soil abrasiveness in contact with the pipeline, excessive pipeline load, quality of maintenance, and water hammer pressures [
4]. When a burst occurs, there is a significant water loss and the subsequent step involves isolating the location of the broken pipe for repair. These incidents incur direct costs such as pipe repair expenses, service interruptions, and a substantial loss of water resources that could have been supplied to consumers [
5]. Indirect costs may also arise. These are associated with some critical scenarios. For example, in firefighting situations, pipe bursts can cause flooding and road traffic disruptions that will impact delays in meeting demand requirements [
6]. Leaks in water pipelines are another urgent concern due to their potential to cause extensive environmental, economic, and safety damage [
7]. Such leaks are often the result of aging infrastructure, material defects, and external influences such as soil movements [
8].
In addition, water distribution networks (WDNs) face threats from natural disasters that require enhanced resilience. Nolz et al. [
9] developed an operations research model to optimize water distribution planning in disaster relief scenarios, balancing competing objectives like coverage and travel time through multi-objective metaheuristics. Quintana et al. [
10] reviewed resilience evaluation methodologies for critical infrastructure, particularly drinking water systems, and highlighted the multidimensional nature of resilience, incorporating technical, environmental, organizational, social, and economic factors. Expanding on this perspective, Balaei et al. [
11] analyzed social attributes influencing water supply resilience.The study examined seven social indicators—such as homicide and assault rates, trust in institutions, and education levels—within post-earthquake scenarios in Chile (2010) and New Zealand (2011). The findings revealed how variations in social dynamics help explain regional differences in water supply resilience.
Given the potential impacts of failures in WDNs and the ability of a complex network theory (CNT)-based approach to reduce the processing time in identifying critical zones [
12], this study aims to analyze the consequences of these failures to detect the most critical elements. These are elements whose failure is most likely to affect the most significant number of consumers, either through pressure variations or supply interruptions, as seen in cases of ruptures and leaks. Leaks in WDNs not only lead to significant water losses but also have substantial environmental impacts, including increased energy consumption for water extraction and distribution, and the potential for contamination of soil and groundwater [
13]. Addressing leaks is critical for achieving sustainability goals, as it directly contributes to the conservation of water resources and reduces the carbon footprint associated with water system operations [
14]. Analyses are performed using hydraulic simulations and metrics to assess critical elements within the complex network. To model a WDN as a complex network, this study follows established recommendations from the literature, incorporating factors such as the direction and weighting of the graph edges [
15] and differentiating the vertices that represent demand nodes from those that represent water sources (for example, reservoirs).
This research formalizes an integrated approach that combines hydraulic simulations with CNT to identify the most vulnerable elements in WDNs. Critical elements are defined as those whose failure could cause significant disruptions in service, such as major pressure drops or supply interruptions. CNT leverages a high computational efficiency to develop a novel approach that uses a single hydraulic simulation to weight the network graph. In contrast, traditional approaches purely based on hydraulic simulations require a separate simulation for each failure scenario, substantially increasing the computational time. While CNT speeds up the process, it is complemented by hydraulic simulations, ensuring the robustness and accuracy of the risk assessment. To enhance clarity and illustrate the methodological steps, flowcharts have been added to depict the sequence of steps for criticality analysis, mainly for pipe break and leak scenarios.
In this context, multi-criteria decision-making (MCDM) techniques are especially valuable for assessing the critical elements identified in the network. MCDM methods enable the consideration of a wide range of factors, which may sometimes conflict with one another, including environmental, social, technical, and economic aspects, even under conditions of uncertainty affecting input data [
16]. MCDM methods are particularly suitable for generating a comprehensive and informative ranking of critical elements because they consider diverse perspectives. This approach allows decision-makers to prioritize interventions based on a holistic assessment of risks and impacts [
17], ensuring that resources are directed to areas with the highest potential for failure-induced consequences.
For this reason, this paper integrates an MCDM-based procedure into the analysis to support effective decision-making. This paper is structured as follows: After presenting an overview of the challenges associated with WDN failures,
Section 2 reviews previous work on hydraulic simulations and CNT for network analysis.
Section 3 describes the dual approach that integrates hydraulic simulations with CNT metrics, detailing the methodological aspects of the MCDM procedures. This section explains how failures are modeled and how critical elements are identified and assessed.
Section 4 presents and compares the results of a case study on the Modena network, followed by a discussion of the findings. Finally,
Section 5 summarizes this study’s key conclusions and suggests potential directions for future research.
2. Literature Review
Leaks can allow contaminants to intrude into the WDN [
18], compromising the safety and quality of the supplied water, particularly under low-pressure conditions [
19]. In addition to affecting water quality, Huang et al. [
20] highlight that leaks cause water loss and increase energy consumption for pumping and treating water, thereby impacting finances through additional costs for producing and distributing the lost water. Lastly, leaks or pipe breaks significantly affect water systems’ resilience, increasing the risk of complete failure in the water distribution process [
21].
The study of network resilience under abnormal conditions (e.g., pipe bursts or leaks) requires simulating multiple failure scenarios to identify the most critical ones. These simulations form the basis for evaluating the potential impact of failures on network functionality and consumer safety [
22,
23,
24,
25]. For example, Zhao et al. [
26] studied the hydraulic vulnerability and risk assessment of water distribution systems, using EPANET as the hydraulic solver and Monte Carlo stochastic simulation to generate failure scenarios. More recently, modeling water network systems through CNT has emerged in the literature as a potential alternative to traditional hydraulic models [
2,
27,
28]. The application of CNT in WDNs has encompassed topics such as the optimal design of water systems [
29], leak detection [
30], network resilience [
2], optimal sensor placement for detecting contaminant intrusion [
31], and the impact of the expansion of water systems [
32]. Hydraulic simulation software like EPANET 2.2 [
33] facilitates steady-state simulations over extended periods, providing insights into the hydraulic behavior of WDNs. For example, Ulusoy et al. [
34] compared hydraulic simulations with CNT metrics to evaluate the effectiveness of this new methodology in identifying critical pipes. In hydraulic modeling, the computational time required often limits criticality analysis to a smaller subset of the system. Additionally, the authors highlighted that applying CNT metrics to the network is nearly two orders of magnitude faster than hydraulic modeling (30 min versus 30 h). Similarly, Boryczko et al. [
35] emphasized that scenario simulations are particularly effective in small water distribution systems. Recent advancements in the application of graph theory to water distribution systems (WDSs) have demonstrated significant potential in addressing computational challenges associated with water quality assessment. For instance, Sitzenfrei et al. [
28] proposed a novel complex network analysis-based approach to evaluate water quality in large-scale WDSs, achieving high computational efficiency and accuracy when compared to state-of-the-art models. The study highlights the model’s ability to identify design solutions exceeding water quality thresholds, with a correct identification rate between 96% and 100%. Marsili et al. [
36] investigated the use of connectivity metrics to assess the impact of topological changes, such as district metered area creation or branching, on the transient response of WDNs. Their study demonstrated that these metrics could effectively capture the network’s dynamic pressure behavior caused by maneuvers on devices like pumps or hydrants, as well as user activity.
CNT incorporates a set of metrics designed to evaluate the behavior and structure of complex networks [
37], including degree distribution, clustering coefficient, centralities [
27,
38], and shortest path-related measures [
39]. These metrics are beneficial for analyzing various types of networks and are widely used to enhance the understanding of the internal structure of complex systems. For instance, Nazempour et al. [
30] applied CNT to optimize sensor placement for contaminant detection by analyzing the water network’s complex topology and dynamics. Similarly, Hajibabaei et al. [
40] reconstructed missing information about pipe diameters in WDNs. They utilized CNT metrics to infer the missing diameters based on the topological (e.g., connectivity) and hydraulic (e.g., pressure) properties of edges with known information.
Considering the risk analysis and impact of failures on water distribution systems, Ulusoy et al. [
34] conducted hydraulic simulations to determine the maximum portion of demand that the network could meet under pipeline rupture scenarios. Additionally, they developed a CNT-based metric to identify critical sections for network resilience. However, this metric could not accurately model the system’s hydraulic behavior or assess the extraordinary demand that the network could handle. Rokstad et al. [
41] proposed a novel network generation procedure based on the C-town benchmark network, creating 296 networks with similar structures but distinct topological features. These networks were subjected to stress tests involving various substance intrusion scenarios. Their performance was evaluated and ranked using a set of resilience metrics. A correlation analysis examined the relationship between network design and resilience, focusing on topological attributes. The findings revealed that specific topological attributes, particularly those associated with branched network designs, demonstrated greater resilience to quality-related failures.
The use of MCDM methods has proven particularly relevant to the study of WDNs [
42], as multiple potentially conflicting objectives, such as minimizing leaks, reducing operational costs, and improving network resilience, must often be addressed simultaneously [
43]. These methods have also supported group decision-making on critical WDN-related issues, such as implementing effective rehabilitation strategies [
44]. Techniques like the “preference ranking organization method for enrichment evaluations” (PROMETHEE) and the “technique for order preference by similarity to ideal solution” (TOPSIS) have been widely used and integrated to rank alternatives based on diverse criteria. For instance, Fontana et al. [
45] addressed the challenge of rehabilitating aging urban water distribution networks, focusing on maximizing the repair of leakage points while minimizing costs under budget constraints. They applied PROMETHEE to help decision-makers select the best repair options based on predefined criteria and constraints. Similarly, Farias et al. [
46] used a variant of TOPSIS to evaluate the overall performance of water supply systems, aggregating multiple performance indicators into a single global index to aid decision-making and applying the model to Brazilian companies. Cunha et al. [
47] developed a framework for long-term strategic WDN planning under uncertainty by combining MCDM, specifically PROMETHEE and TOPSIS, with optimization techniques. This approach generated and ranked flexible design alternatives based on costs, carbon emissions, resilience, and reliability. Among these methods, TOPSIS is particularly well suited for addressing WDN-related challenges [
48]. It excels in ranking alternatives by evaluating their distance from an ideal solution, making it especially effective for problems such as leak detection [
32] and optimal sensor placement [
49], where intervention strategies and network nodes need prioritization. TOPSIS provides a balanced evaluation of trade-offs, and its ease of interpretation [
50] makes it a compelling option for decision-makers in water utilities, delivering clear, actionable insights that align closely with operational goals. Its application in this research could support integrating hydraulic and topological data into a cohesive decision-making framework, offering a more effective way to manage WDNs under various risk conditions.
3. Integrated Hydraulic and Network-Based Methodology
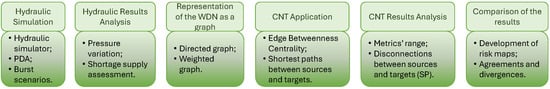
The proposed methodology is organized into four stages. The first stage involves hydraulic simulations, where failure scenarios are implemented and their impacts are analyzed. This includes evaluating the network’s supply capacity reduction by examining pressure decreases at consumption nodes. In the second stage, the WDN is modeled as a graph, and a set of CNT metrics is calculated for each scenario. The third stage compares the results from the first two stages through the development of risk maps, enabling a comprehensive and systematic analysis of the criticality of each element in the system. For a better illustration of the methodology,
Figure 1 and
Figure 2 are presented.
The methodology is implemented in the Python programming environment, utilizing the Water Network Tools for Resilience (WNTR) [
51] and NetworkX libraries [
52]. Finally, the fourth stage applies the TOPSIS method to achieve the final ranking of critical elements.
3.1. Hydraulic Simulations
The affected pipe is set to “closed” for the entire simulation duration to simulate a single pipe break in a hydraulic system. This approach represents the isolation of pipes during a failure and reflects a loss of connectivity. It simplifies real-world pipe failures by excluding the process leading to the break, such as the initial large leak that might occur. As a result, water loss before the pipe’s isolation is not included in the simulation. The broken pipe is assumed to be isolated immediately after the break. Once the pipe break scenarios are created, pressure-driven simulations are performed. This approach provides a more accurate analysis of pressure changes and the resulting partial or complete water supply disruption. The simulation results are then evaluated by calculating the percentage reduction (
) in pressure at the network nodes compared to the pressure values at the nodes under normal conditions without any pipe breaks, as presented in the following Equation (
1):
where is the pressure reduction at node i when a pipe j is simulated as broken, is the pressure at node i under the original scenario, with all pipes working properly, and is the pressure at node i when pipe j is simulated as broken.
After calculating the percentage pressure drop, the total number of nodes experiencing a pressure reduction greater than 5%, 10%, and 15% compared to normal network conditions (failure-free) is summed for each pipe break simulation. Each pipe is then assigned a value corresponding to the total number of instances where any node experienced a pressure reduction exceeding the specified percentage during the 24 h simulation period.
The first step in the leak analysis methodology, similar to the pipe break analysis, is based on running pressure-driven hydraulic simulations. In this stage, leak scenarios are created by introducing a leak at each demand node in the network. Leakage flows (
q) are introduced at each node (
i) and calculated using the standard equation from EPANET 2.2. This is done by setting the emitter coefficient (
) according to the emitter Equation (
2),
To compare the effects of leaks on pressure drops, the average pressure at each node in the network is calculated, and the emitter coefficient (
) is estimated accordingly. This approach ensures that the flow rate remains approximately constant, regardless of the leak’s location. Subsequently, pressure-driven hydraulic simulations are conducted, and the pressure reduction is calculated using the same method described in Equation (
1).
3.2. Complex Network Theory Application
Given the common approach to hydraulic modeling of water networks, where nodes are connected by links, these systems can easily be represented as graphs. Mathematically, a graph G is a set of vertices (), which are connected by edges () and expressed as . The edges’ direction can be defined according to specific features of the problem, such as the flow of the network during a certain operation time. In this work, the graphs are directed and weighted based on the flow at the maximum consumption time, representing the most critical scenario to pressure reduction in the system. In a matrix notation, a graph can be defined by an adjacency matrix A, where each element represents the connection between two nodes i and j.
Pipe breaks and leakages are modeled in this work based on the weighted and directed graph built on scenarios without anomalies. For pipe bursts, failure scenarios are created by disconnecting the edge corresponding to the broken pipe in the weighted adjacency matrix. The value of the element , which was previously equal to the flow rate of the broken pipe, indicating a connection between nodes i and j, is set to 0, which means that those nodes are no longer connected. It is important to note that i and j correspond, respectively, to the upstream and downstream nodes of the pipe based on the initial flow direction of the network. An analysis is then conducted on the increase or decrease in the shortest paths, as well as the disconnection of nodes from their sources when the distance between them becomes infinite. CNT metrics are applied to identify the most important or most connected vertices that influence a larger area. The vertices of the graphs are labeled as water sources and demand nodes. For each scenario, the shortest path between water sources and demand nodes is calculated, forming a matrix, with the sum of the edge weights belonging to the shortest path. Regarding leaks, this action is not performed differently from the rupture scenario where the edge corresponding to the broken pipe is removed from the graph. During the network characterization by CNT, the graph remains with all its edges and vertices.
The Floyd–Warshall and the Dijkstra algorithms are used to calculate the shortest paths. On the one hand, the Floyd–Warshall algorithm creates matrices to determine the shortest paths between all pairs of edges, investigating the paths that pass through specific nodes based on the application of Equation (
3) [
53]. The path length between two edges is defined as the sum of the edge weights along the path. Equation (
3) represents the decision logic of the algorithm, which updates the shortest path between two vertices by comparing the previously found value
with the new value of a path that passes through an intermediate vertex
.
On the other hand, the Dijkstra algorithm calculates the shortest path between a source and a demand node, starting from an initial node and ending at a target node. It systematically explores neighboring nodes until the shortest path is identified. The algorithm begins by assigning a distance of 0 to the initial node, while all other nodes are set to an infinite distance. It then selects the node with the smallest distance (initially the starting node) and examines its neighboring nodes. The algorithm calculates the distance from the initial node for each adjacent node and updates the shortest path if a shorter one is found. This process continues until all nodes have been evaluated or the shortest path to the target node is identified [
54].
Water distribution systems typically rely on a main transmission line, the trunk network, to supply users located further from water sources [
55]. This trunk network comprises the most critical and interconnected nodes and pipes, responsible for transporting larger volumes of water. These volumes are distributed through smaller-diameter pipes with lower flow capacities, which are less significant and less interconnected within the overall system. Establishing a hierarchy involves using water sources as the initial nodes and normalizing the weights assigned to each pipe. Pipes connected to the sources are considered more important based on the number of nodes they serve. The edges (pipes) are weighted by factors such as the highest flow rates and the shortest paths between sources and demand nodes [
56]. Pipes that appear in most of the shortest paths are identified and ranked as critical network components. A trunk network can be selected for further analysis using a percentage defined by stakeholders.
This is a CNT-based metric that measures the centrality between two vertex groups. It is used in this work to compute the centrality between water sources (reservoirs) and demand nodes, being calculated by Equation (
4):
where S is the set of sources, Z is the group of targets, and s and z are nodes from these groups, respectively. This centrality is computed as the sum of the shortest paths between s and z that pass through vertex v over all the shortest paths between s and z. Similarly, for edge betweenness centrality, there is a variation called source–demand edge betweenness centrality, which calculates the importance of an edge by the number of shortest paths that include the edge [28].
3.3. Map of Normalized Criticality and Similarity Analysis
Maps of normalized criticality are generated to compare the results of hydraulic simulations with those of CNT applications. For each modeled failure (such as a pipe break or leak), the pressure reduction
calculated from Equation (
1)) is summed across all simulated time steps. The total PR for each element in the network (pipes for pipe breaks and nodes for leaks) is then normalized on a scale from 0 to 1, where 1 represents the highest
sum. This identifies the most critical element in the event of a failure. The same normalized criticality concept is applied to the shortest path and betweenness centrality. For each simulation of a pipe break, the shortest path among sources and consumption nodes is calculated, and the sum of the shortest path is associated with a pipe. Finally, this sum is normalized between 0 and 1, with 1 as the highest sum corresponding to the more critical link. To assess the similarity between the hydraulic-based and CNT-based approaches, a quantitative analysis is performed with the help of two complementary indicators, the Pearson correlation coefficient and Dynamic Time Warping (DTW), which offer distinct yet synergistic perspectives on the relationship between the two approaches.
The Pearson correlation coefficient helps explore the linear relationship between normalized betweenness centrality values and hydraulic parameters, focusing on nodes influenced by pressure drops during pipe failures. This approach highlights how each pipe failure affects system performance, emphasizing its hydraulic significance. The analysis assesses the degree to which high centrality values align with notable hydraulic impacts. A strong positive correlation would demonstrate that CNT metrics effectively capture hydraulic criticality, suggesting that network theory could serve as a reliable alternative to hydraulic simulations.
Dynamic time warping, in turn, investigates the similarity of the two approaches by comparing sequential patterns of their criticality rankings. While the Pearson correlation focuses on a linear relationship, DTW will capture the shapes of series, shifts, variations, and time lags. For this very reason, DTW becomes so effective at finding non-linear correspondences and examining disagreements between hydraulic- and CNT-based ranking. DTW aligns the ranking sequences of the critical pipes. In addition, it gives the “cost” necessary to transform one sequence into another. A lower DTW cost means a closer similarity; hence, CNT metrics are close to hydraulic outcomes. The higher the cost, the higher the divergence, and one needs to investigate further to determine why the differences exist.
Together, these indicators provide a comprehensive evaluation of how well CNT-based metrics emulate the criticality insights derived from hydraulic simulations, offering both validation and a pathway for deeper analysis of mismatches.
3.4. TOPSIS for Final Ranking Formalization
TOPSIS is herein suggested to assess and rank various alternatives based on multiple criteria. This method is recommended because it accounts for the best- and worst-case scenarios, offering a clear and balanced comparison of the analyzed alternatives. The methodological steps for implementing TOPSIS are highlighted below.
Building the input decision matrix X, whose elements represent the performance values of each alternative i under each criterion j, which can be either quantitative or qualitative. This matrix is the foundation for the subsequent calculations.
Computing the normalized weighted matrix
U, whose elements
represent the normalized evaluations
of alternative
i under criterion
j multiplied by the weight of the correspondent criterion
. Criteria weights are numerical values assigned to each criterion to reflect its relative importance in the decision-making process, meaning that criteria that are considered more important are attributed higher weights. In comparison, less significant criteria receive lower weights, with the sum of all weights normalized to 1. Specifically, we first normalize the elements of the input decision matrix
X as follows:
We consequently apply the weights to the normalized values, reflecting the importance of each criterion. The weighted normalized values
of matrix
U are computed as follows:
Obtaining the ideal positive solution
and the ideal negative solution
from the normalized weighted matrix
U. Specifically, the ideal positive solution
includes the highest values for criteria to be maximized and the lowest values for criteria to be minimized. For example, in evaluating alternatives, criteria representing benefits such as performance or reliability should be maximized, while cost or processing times should be typically minimized. Conversely, the ideal negative solution
contains the lowest values for criteria to be maximized and the highest values for criteria to be minimized. Mathematically, they are defined as follows:
Here, refers to the set of criteria that need to be maximized, while includes criteria to be minimized. These two ideal solutions are reference points to assess how close or far each alternative is from the optimal and worst possible scenarios, as explained in the following step.
Computing the distances between each alternative in the dataset and each of the ideal solutions previously obtained. The distances
and
represent how close or far each alternative is from the ideal positive solution
and the ideal negative solution
, respectively. These distances are calculated for each alternative
i using the following formulas:
Here, represents the ideal positive solution for each criterion j, and represents the ideal negative solution for each criterion j. indicates how far an alternative is from achieving the ideal scenario across all criteria, while quantifies its closeness to the worst-case scenario. Alternatives with a smaller and a larger are considered more favorable, since they are closer to the ideal positive solution and further from the ideal negative solution.
Calculating the closeness coefficient
for each alternative
i as follows:
The closeness coefficient quantifies how close each alternative is to the ideal positive solution , relative to the ideal negative solution . A higher value of indicates that the alternative is closer to the ideal positive solution and further from the ideal negative solution, making it a more desirable option.
Ranking alternatives based on their closeness coefficient, with the highest values associated to the best alternatives.
The TOPSIS algorithm integrates failure scenarios and ranks the pipes in the system, offering a systematic method for guiding maintenance decisions. The ranking relies on CNT results, which serve as criteria for multi-criteria decision-making. Combining metrics from both leakage and pipe break scenarios, the algorithm assesses each pipe’s criticality in terms of its impact on network connectivity, hydraulic performance, and overall system resilience. This method ensures a well-rounded evaluation, helping decision-makers prioritize maintenance efforts effectively.
4. Case Study: Modena Network
The first network used in this study is the Modena reference network, composed of 268 nodes, 317 pipes, and supplied by four reservoirs [
57]. This network has a notable number of loops, demonstrating complex behavior and a hydraulic system of a network with multiple water sources. As recorded by Bolognesi et al. [
58], the required pressure for full operation is 20 m. Additionally, the tested network shows an elevation difference of only 11.44 m.
A pipe is considered critical from a hydraulic perspective when its closure results in a substantially affected area. This impact can be quantified by calculating the supply disruption, whether partial or total.
Figure 3 displays the risk maps developed to assess the criticality of the pipes, both from a hydraulic perspective and based on CNT.
Upon analyzing the criticality maps in
Figure 3, it is worth mentioning that both analyses identify the same pipes as critical, with most of them connected to the reservoirs. However, differences arise in specific cases, such as the pipes near reservoir 271, which are identified as critical in the CNT modeling but not in the hydraulic simulations. This discrepancy occurs because the hydraulic simulations include reverse flow direction, causing the demand points originally supplied by reservoir 271 to be served by other reservoirs, thereby avoiding a critical supply disruption. Additionally, pipes 157 and 158 are not considered critical in the CNT modeling due to two parallel sections serving as alternative paths. Removing the corresponding edges does not significantly impact the shortest path connections between sources and demand nodes. In contrast, the hydraulic simulations highlight these pipes as critical because they carry high flow rates, leading to significant pressure reductions at some nodes during a failure.
Figure 4 compares hydraulic-driven analysis and CNT metric for pipe break risk assessment. Critical pipes identified by the application of CNT are compatible with the trunk network comprising 10% of the pipes, corroborating the importance for supply.
Figure 5 compares the most critical pipes based on CNT and the classical trunk network analysis. Additionally, it was shown that pipes connected sequentially, starting from reservoir 269, are more critical than pipes directly connected to the other reservoirs. Finally, the two risk analysis methods, hydraulic simulations and CNT, showed good convergence in pipe break hydraulic analysis results.
On the other hand, in the first stage of the leakage methodology, calculating the number of unsupplied nodes, involves individual simulations of leak insertion, each lasting 24 h. The hydraulic-based evaluation is then compared with the approach based on graphs, applying the betweenness centrality source–demand metric. This metric assesses the importance of a node based on the number of shortest paths it intermediates.
Figure 6 compares both approaches. From the pressure results at the nodes, obtained hourly during the simulations of each scenario, a matrix is generated that records the nodes impacted by the leaks and quantifies the number of times a node experienced supply disruption conditions over the 24 h. When comparing the two criticality maps presented in
Figure 6, notable compatibility in the results is observed. They show the same critical regions in the network, highlighted by circles, which coincide with regions that are close to the reservoirs.
4.1. Ranking Pipes for Maintenance Strategy
The TOPSIS algorithm is applied to the Modena network, chosen as the case study due to its realistic yet medium size and relatively simple topology, which facilitates interpretation and makes the results more understandable. Applying TOPSIS to this network enables the assessment of pipe criticality based on results obtained from complex network theory for both leakage and pipe break scenarios. The Modena network’s topology provides a suitable framework to evaluate how multi-criteria decision-making integrates information from various failure scenarios into a final ranking for pipe maintenance.
The algorithm is implemented using equal weighting for both leakage and pipe break scenarios as a baseline. In addition, the analysis explores the impact of varying the scenario weights to address uncertainties and test the sensitivity of the results to the weighting scheme. Specifically, the following three configurations are evaluated:
EW, where equal weights are assigned to both scenarios;
C1, where the pipe break scenario is given a higher weight;
C2, where the leakage scenario is assigned greater importance.
Figure 7 illustrates the results for each alternative TOPSIS application, highlighting how the ranking of critical pipes changes under different weighting schemes. This analysis provides insight into how the variation in the relative importance of the scenarios affects the prioritization of maintenance actions.
The analysis shows that the pipes identified as the most critical for maintenance are those associated with higher flow rates, emphasizing their essential role in the operational dynamics of the Modena network. Pipe 335, for instance, supplies more than 60% of the total inflow on average, which is subsequently distributed through pipes 290, 291, and 292, as shown in
Figure 5. These pipes are crucial for maintaining the network’s hydraulic performance, making them top priorities for inclusion in the maintenance and replacement schedule. Their criticality highlights the importance of preserving high-flow pipelines’ structural integrity and operational reliability to minimize the risk of significant service disruptions. This analysis ensures that key infrastructure components are identified and effectively managed, supporting the long-term resilience and reliability of the water distribution system.
Following the criticality of pipe 335 and pipes interconnected with 335, the analysis shifts focus to another reservoir, which is the second most significant water source in the Modena system. The pipe connecting this reservoir to the network and the pipes directly linked to this primary source appear as critical components. These elements are instrumental in the distribution of water from the reservoir to downstream sections of the network. The strategic importance of these pipes plays again a key role in maintaining the functionality of the system, particularly during periods of high demand or in the event of service interruption to the primary reservoir.
4.2. Discussion of Results
The case studies presented in this paper demonstrate the application of hydraulic simulations and CNT to assess criticality in WDNs. The Modena network provides contrasting scenarios in terms of network complexity and scale, allowing for a robust evaluation of the methodologies. In the case study, hydraulic simulations identified critical pipes based on flow rates and the extent of service disruption resulting from pipe breaks or leaks. The simulations showed that pipes near reservoirs or those carrying higher flow rates were more critical, a pattern echoed by the CNT analysis. A comparison of criticality maps revealed a strong alignment between hydraulic simulations and CNT results, particularly in identifying key elements such as trunk pipes. The consistency between these two methods underlines CNT’s potential as a fast, reliable alternative for criticality assessment, particularly in large and complex networks where computational efficiency is paramount.
In certain instances, CNT overestimated the criticality of pipes that hydraulic simulations did not identify as high-risk, largely due to differences in how reverse flows and alternative paths were handled. This underscores the need to refine CNT models to better account for specific hydraulic behaviors, such as flow reversals, which are not fully captured by topological metrics alone. Both case studies emphasized the importance of integrating hydrauli- and network-based approaches to achieve a more comprehensive risk assessment. The use of CNT demonstrated significant advantages, particularly in reducing processing time, making it feasible to model criticality across entire systems rather than being limited to smaller network sections, as is often the case with purely hydraulic approaches. Representing the network as a graph structure enables CNT to compute critical elements rapidly, facilitating full-scale analysis of the entire system. This efficiency broadens the scope of the analysis, allowing for exploring more failure scenarios in less time. Consequently, decision-makers can better understand system vulnerabilities without being constrained by time or computational resources. The methodology outlined in this work leverages CNT to prioritize inspections, repairs, and preventive actions according to criticality, making it compatible with existing maintenance scheduling techniques. Its computational efficiency allows for quick identification of high-risk areas, complementing hydraulic models as an initial screening tool. This combined approach promotes more effective resource allocation and strategic planning, improving system resilience and aligning with contemporary asset management strategies.
5. Conclusions
This study emphasizes the novelties and benefits of integrating complex network theory (CNT) with traditional hydraulic simulations for assessing the criticality of water distribution networks (WDNs). Validated using the Modena network, the proposed methodology introduced a structured dual-method approach to identify critical pipes and nodes. The results showed strong correlations between hydraulic- and CNT-based criticality metrics, demonstrating the reliability of this combined framework. CNT provided a computationally efficient alternative to hydraulic simulations, reducing processing times and enabling the analysis of the entire network, rather than focusing on smaller sections. This integration supports the evaluation of multiple failure scenarios and highlights key infrastructure components essential for maintaining reliable service. The proposed approach equips operators with practical tools to prioritize maintenance and rehabilitation efforts, enhancing network reliability and resilience under various operational conditions.
This study also demonstrates that the CNT-based framework is applicable across different network configurations. Its ability to analyze network topology effectively and identify critical components makes it particularly useful for large and complex systems, where traditional hydraulic methods may require significant computational resources. The methodology ensures a balance between computational efficiency and reliability, providing decision-makers with actionable insights to address immediate challenges and plan long-term maintenance strategies. The methodology is particularly suited for urban and large-scale WDNs, where computational efficiency and rapid decision-making are critical. Moreover, its ability to incorporate several scenarios, such as pipe failures or contamination events, highlights its versatility for addressing real-world challenges, making it a tool to evaluate the resilience and sustainability of water supply systems.
Future research should explore the inclusion of real-time monitoring data within the CNT framework to dynamically update criticality metrics, improving the adaptability of the methodology to changing network conditions. Another promising direction involves integrating machine learning techniques with CNT metrics to estimate failure probabilities and design optimized intervention strategies using historical data. Furthermore, new developments can address uncertainties such as demand variations and environmental impacts on modeling water distribution systems by dynamically integrating demand forecasting models and environmental impact assessments. These models could update nodal demands or network topology in real time, enabling the framework to better account for stochastic changes in network conditions. Technologies such as IoT-enabled sensors, smart meters, and advanced SCADA systems could provide continuous data on critical parameters like pressure, flow rates, and water quality. These real-time inputs could be processed using adaptive algorithms, including machine learning models or data assimilation techniques, to dynamically update network metrics and criticality assessments. Such integration would enhance the framework’s applicability to dynamic conditions, enabling more proactive and responsive water distribution network management. Such extensions would not only improve the adaptability and robustness of the methodology but also make it more applicable to real-world scenarios where uncertainties play a significant role in decision-making for water distribution network management.
Expanding the framework to account for multi-hazard scenarios, such as simultaneous pipe failures and contamination events, would allow for a more comprehensive assessment of system vulnerabilities. Additionally, further validation on larger networks with diverse structures and operational characteristics is necessary to confirm the scalability and versatility of the approach. These advancements would enhance the practicality and effectiveness of the CNT-based methodology for WDN management.