This evaluation phase aimed to test the study’s hypotheses and validate the proposed theoretical framework. The researchers conducted SEM analyses using Mplus (version 8.3) software to examine both direct path and mediation effects. The detailed results of these analyses are presented in the subsequent subsections.
4.4.1. Path Hypothesis Testing
The SEM path analysis results, presented in
Table 9, reveal significant relationships between packaging design colour elements and PI. The first level of colour element, monochromatic harmony, demonstrated a significant positive effect on PI (β = 0.254,
p = 0.000) relative to the average of all levels. Similarly, the second level, analogous harmony, showed a significant positive effect (β = 0.192,
p = 0.004) compared to the level average. Conversely, the third level of colour element, contrast harmony, exhibited a significant negative effect on PI (β = −0.446,
p ≈ 0.000) when compared to the average of all levels.
The analysis of graphics elements’ effects on PI yielded varied results. The first level of graphics element, figurative, demonstrated a significant positive effect on PI (β = 0.153, p = 0.009) relative to the average of all levels. In contrast, the second level, abstract, showed a significant negative effect (β = −0.095, p = 0.021) compared to the level average. The third level of graphics element, hybrid, did not demonstrate a statistically significant effect on PI (β = −0.058, p ≈ 0.473) when compared to the average of all levels.
The analysis revealed that none of the logo elements demonstrated statistically significant effects on PI. The first level, logomark, showed no significant effect relative to the average of all levels (β = 0.085, p = 0.079). Similarly, the second level, logotype, demonstrated no significant effect (β = 0.000, p = 0.993) compared to the level average. The third level, combination mark, also failed to show a statistically significant effect on PI (β = −0.085, p ≈ 0.206) when compared to the average of all levels.
The analysis of typography elements revealed varying effects on PI across different typeface styles. The first level, Chinese character print typeface, showed no statistically significant influence on PI (β = 0.013, p = 0.811) relative to the average of all levels. The second level, calligraphy typeface, demonstrated a significant positive effect (β = 0.126, p = 0.019) compared to the level average. The third level, artistic typeface, did not reach statistical significance in its effect on PI (β = −0.139, p ≈ 0.063) when compared to the average of all levels.
The analysis of layout elements revealed diverse effects on PI across different design arrangements. The first level, bilateral symmetry, demonstrated a significant positive effect on PI (β = 0.127, p = 0.010) relative to the average of all levels. In contrast, both the second level, grid (β = −0.123, p = 0.007), and the third level, centralised (β = −0.164, p = 0.000), showed significant negative effects compared to the level average. The fourth level, diagonal layout, did not reach statistical significance in its effect on PI (β = 0.160, p ≈ 0.053) when compared to the average of all levels.
4.4.2. Mediation Effect Testing
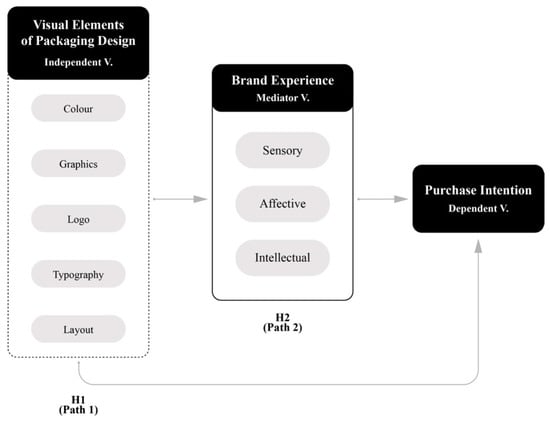
Based on our conceptual model, we constructed the model using BE as a mediating variable. We calculated direct, indirect, and total effects following established procedures (
Hayes, 2022;
Kline & Little, 2023;
J. Wang & Wang, 2020). Direct effects were estimated as standardised path coefficients in the structural model. Indirect effects were calculated as the product of path coefficients (a × b) connecting VEPD to PI through BE. The total effect comprised the sum of direct and indirect effects.
We employed the bootstrap method to estimate the mediating effect. While the Sobel test is common, it can lack accuracy with small samples or non-normal distributions. The bootstrap method provides more precise confidence interval estimates (
Hair et al., 2017;
Taylor et al., 2008), particularly when the statistic’s behaviour is ambiguous, complex, or highly dependent on specific sampling scenarios (
Hayes, 2022). We conducted 5000 replicate samples to estimate BE’s mediating effect value and its 95 percent confidence interval. A confidence interval excluding zero indicated statistical significance in the mediation effect.
Table 10 presents the direct, indirect, and total effects of the overall mediation model. The analysis of the VEPD revealed a significant direct effect on PI, with an estimated value of 0.229 and a 95 percent confidence interval of [0.097, 0.413]. As this confidence interval excludes zero, it confirms the significance of the direct effect.
The indirect effect through BE demonstrated an estimated value of 0.844, with a 95 percent confidence interval of [0.527, 1.205]. The exclusion of zero from this confidence interval establishes statistical significance, confirming that BE serves as a significant mediator in the relationship between packaging design visual elements and PI.
The analysis revealed both significant direct and indirect effects, indicating partial mediation in the relationship between VEPD and PI. The total effect of VEPD on PI showed an estimated value of 1.073, with a 95 percent confidence interval of [0.759, 1.399]. The exclusion of zero from this interval confirms the overall significant effect of VEPD on PI.
These findings support H2, validating the inclusion of BE in the theoretical model. Specifically, the results demonstrate that VEPD influences PI both directly and indirectly through BE, confirming the partial mediating role of BE in this relationship.
As shown in
Table 11, the analysis of colour elements revealed significant direct and indirect effects through BE. The direct effect of colour elements on PI showed an estimated value of 0.461, with a 95 percent confidence interval of [0.288, 0.617]. The exclusion of zero from this interval confirms the significance of the direct effect, supporting H1a.
The indirect effect through BE demonstrated an estimated value of 0.134, with a 95 percent confidence interval of [0.067, 0.253]. As this confidence interval excludes zero, it establishes the significance of BE as a mediator in the relationship between colour elements and PI. Given the significance of both direct and indirect effects, the results indicate partial mediation, with colour elements influencing PI through both pathways. The total effect of colour elements on PI showed an estimated value of 0.595, with a 95 percent confidence interval of [0.455, 0.753]. The exclusion of zero from this interval confirms the overall significant effect of colour elements, with the indirect benefit representing a substantial proportion of the total effect, as indicated by the significant R value. These findings support H2a, and the final model of packaging design colour elements at different levels is illustrated in
Figure 3.
The analysis of graphics elements revealed a different pattern of mediation effects compared to colour elements. The direct effect of graphics elements on PI showed an estimated value of 0.052, with a 95 percent confidence interval of [−0.036, 0.151]. As this interval contains zero, it indicates no significant direct effect, failing to support H1b.
The indirect effect through BE demonstrated an estimated value of 0.041, with a 95 percent confidence interval of [0.009, 0.096]. The exclusion of zero from this interval establishes the significance of the indirect effect, confirming BE as a significant mediator in the relationship between graphics elements and PI. The total effect of graphics elements on PI showed an estimated value of 0.093, with a 95 percent confidence interval of [0.003, 0.177]. The exclusion of zero from this interval confirms the overall significant effect. Given the non-significant direct effect but significant indirect effect, the results indicate full mediation, suggesting that graphics elements influence PI entirely through BE. These findings support H2b, and the final model of packaging design graphics elements at different levels is illustrated in
Figure 4.
The analysis of logo elements revealed a complex pattern of mediation effects. The direct effect of logo elements on PI showed an estimated value of 0.085, with a 95 percent confidence interval of [−0.005, 0.181]. As this interval contains zero, it indicates no significant direct effect, failing to support H1c.
The indirect effect through BE demonstrated an estimated value of −0.062, with a 95 percent confidence interval of [−0.137, −0.028]. The exclusion of zero from this interval confirms a significant negative indirect effect, establishing BE as a significant mediator in the relationship between logo elements and PI. The total effect of logo elements on PI showed an estimated value of 0.023, with a 95 percent confidence interval of [−0.070, 0.107]. The inclusion of zero in this interval indicates no significant total effect. However, the significant R value suggests that the indirect path through BE may have been counterbalanced by unmeasured influence paths, resulting in the non-significant total effect. This finding underscores the importance of examining mediating mechanisms beyond total effects. These results support H2c, highlighting the crucial role of BE in mediating the relationship between packaging design logo elements and PI. The final model of logo elements at different levels is illustrated in
Figure 5.
The analysis of typography elements revealed a distinct pattern of effects compared to other design elements. The direct effect of typography elements on PI showed an estimated value of 0.143, with a 95 percent confidence interval of [0.056, 0.223]. The exclusion of zero from this interval confirms a significant direct effect, supporting H1d.
The indirect effect through BE demonstrated an estimated value of −0.004, with a 95 percent confidence interval of [−0.035, 0.027]. As this interval contains zero, it indicates no significant indirect effect through BE. The total effect of typography elements on PI showed an estimated value of 0.140, with a 95 percent confidence interval of [0.062, 0.221]. The exclusion of zero from this interval confirms a significant overall effect. These results indicate that typography elements influence PI primarily through the direct path, with no significant mediating effect through BE. These findings do not support H2d, suggesting that BE does not serve as a mediator in the relationship between typography elements and PI. The final model of typography elements at different levels is illustrated in
Figure 6.
The analysis of layout elements revealed significant effects through both direct and indirect pathways. The direct effect of layout elements on PI showed an estimated value of −0.201, with a 95 percent confidence interval of [−0.321, −0.077]. The exclusion of zero from this interval confirms a significant negative direct effect, supporting H1e.
The indirect effect through BE demonstrated an estimated value of 0.048, with a 95 percent confidence interval of [0.005, 0.116]. The exclusion of zero from this interval establishes the significance of the indirect effect, confirming BE as a significant mediator in the relationship between layout elements and PI. The total effect of layout elements on PI showed an estimated value of −0.153, with a 95 percent confidence interval of [−0.269, −0.039]. The exclusion of zero from this interval confirms a significant overall effect. The significant R value indicates that the indirect benefit represents a substantial proportion of the total effect. Given the significance of both direct and indirect effects, the results demonstrate partial mediation, with layout elements influencing PI through both pathways. These findings support H2e, and the final model of packaging design layout elements at different levels is illustrated in
Figure 7.