1. Introduction
Beef is a commonly consumed meat product in developed nations, making up 21% of global meat product intake in 2022, and has potentially large impacts on human health [
1,
2]. It serves as an important dietary protein source that contains essential nutrients, including fatty acids and numerous vitamins and minerals [
3]. However, the nutrient composition of beef can be altered by the methods used to feed cattle prior to slaughter [
4]. Attention has been brought to how the method of cattle-feeding may impact the health outcomes associated with consuming beef. In particular, organic grass-fed (GRA) has been compared to conventional (CON) cattle-feeding systems [
5]. One of the main differences between GRA and CON beef is that GRA cattle experience a longer period of time with access to forage/grass in their lifespan [
6]. This difference in the diet has been shown to influence the protein, nutrient, and fatty acid composition of the resulting meat product [
7]. These nutritional differences and coinciding health impacts make cattle-feeding systems a point of interest when considering dietary choices.
Some of these differences and how they can impact health are known, but there are additional differences between GRA and CON that may induce metabolic changes not previously characterized. For instance, GRA beef has been shown to contain fewer monounsaturated fatty acids (MUFA), as well as more n-3 fatty acids compared to CON beef [
4,
5]. MUFAs have been associated with healthier glycemic control while n-3 fatty acids can combat inflammation [
8,
9]. GRA and CON cattle-feeding systems have also been shown to impact the muscle tissue metabolism of the cattle. CON-fed cattle appear to adapt to their abundant energy sources and produce larger fat deposits while GRA cattle adapt to a lower intake of energy by maintaining greater amounts of oxidative enzymes such as succinate dehydrogenase [
10]. This was also confirmed via metabolomic analysis demonstrating significant variation in metabolite profiles between pasture and feedlot cattle muscle tissue, specifically greater amounts of ATP and fumarate in pasture-raised cattle [
11]. Cattle-feeding systems also have been shown to impact muscle tissue protein content. Significant differences in total protein content have been observed between GRA and CON beef [
12]. It has also been shown that CON beef has greater amounts of the essential amino acids leucine and methionine than GRA beef [
11]. Essential amino acids are required in the diet and play a vital role in anabolic reactions, especially in aging adults [
13]. Lastly, micronutrients like B vitamins, riboflavin, and thiamine have been found in greater amounts in GRA beef [
14]. B vitamins are important mediators in cellular mechanisms related to cognitive function and microbiome health [
15,
16]. This variety of research describes the impact of cattle-feeding systems of whole beef samples and the possible related health implications; however, the human postprandial metabolomic responses to consuming GRA and CON beef are underdeveloped [
11].
Postprandial metabolic events induced by the consumption of beef are important to understand because the postprandial state is closely related to overall health [
17]. Beef intake, in comparison to other dietary protein sources (plant-based and fish), has been shown to increase postprandial branched-chain amino acid (BCAA) levels and increase satiety, as well as increase 2-aminoadipic acid [
18,
19]. Postprandial BCAA and 2-aminoadipic acid levels have been associated with increased insulin secretion, making red meat intake an important consideration for consumers with glycemic control concerns [
20,
21]. Satiety induced by dietary protein sources is also an indicator of body weight maintenance, benefiting metabolic health [
22]. This demonstrates the importance of postprandial measurements of beef intake-induced metabolite changes.
There is a dynamic transition from a fasted state to a fed state that is difficult to capture; however, metabolomics has become an accurate and sensitive form of analysis to assess these small and large changes that can occur [
23,
24]. The use of metabolomics in human nutrition research provides important insight into the connections between the foods we eat and how they contribute to changes in diet-associated biomarkers during a postprandial period [
25]. This does not come without challenges, as the metabolomic profile of individuals not only contains diet-related metabolites, but non-nutrient metabolites as well [
23,
26]. Given how vital it is to maintain a phenotype that is dynamic and flexible, it is imperative to characterize and identify biomarkers reflective of diet [
27].
Metabolites, the substrates and products of metabolism provide key insight into essential cellular functions such as signal transduction, energy production, and energy storage [
28]. Untargeted metabolomics is a strong analytical method to detect a wide variety of metabolites. Therefore, changes in metabolite abundance or within specific conditions of metabolites provide a powerful tool for identifying and tracking biomarkers reflective of complex physiological responses [
28,
29]. Untargeted metabolomic analyses aim to characterize all endogenous metabolites in a given matrix with an overall goal of capturing global changes in physiological status, biochemical pathways, or sites of perturbation [
30]. Thus, metabolomic analyses provide key information on the metabolic transition from fasting to a fed state. Additionally, the inherent sensitivity of metabolomics enables subtle changes or alterations in biochemical pathways, specifically those changing in response to a nutritional challenge, to be detected [
31].
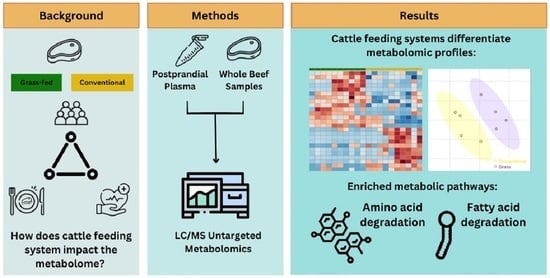
This study aimed to characterize metabolic responses to ingestion of beef and measure metabolic similarities and differences associated with CON- and GRA-fed beef—both within the steaks themselves as well as in the response of human consumers. It was hypothesized that cattle-feeding systems would induce unique metabolomic changes in the composition of beef from these production systems that are reflected in the postprandial metabolic responses as well.
4. Discussion
To investigate metabolomic differences between GRA and CON beef, evaluation of the metabolites in samples of beef, as well as the postprandial metabolomic profiles after human consumption, were measured. We observed significant differences in metabolomic profiles of whole beef samples from GRA and CON. Metabolites that contributed to this difference in whole beef samples that were confidently identified included a greater abundance of L-threonine in GRA and a greater abundance of Proionylcarnitine in CON. We also show that GRA and CON beef samples led to distinct postprandial metabolomic profiles in consumers. Metabolic changes were observed in a number of amino acid and fatty acid-associated pathways, along with a greater abundance of L-valine in CON plasma samples. These results, measured for the first time in consumers, indicate that feeding systems cause differences in the metabolomic profiles of beef and alter the postprandial metabolism of consumers.
The hypothesis that GRA and CON cattle-feeding systems lead to different metabolomic profiles of whole beef samples was confirmed using metabolic pathway enrichment analysis. Metabolomic pathway enrichment analysis predicts functional activity by leveraging metabolic network organization, thereby bypassing metabolite identification steps [
36]. By utilizing
p-values from a
t-test,
m/
z features are mapped to potential metabolites with consideration of adducts and protons [
36]. These compounds are then mapped to the reference organism, and the number of features belonging to a specific pathway is reflected in the pathway enrichment analysis. The predicted pathways were corroborated metabolite identifications made as a result of the MSE data. The main pathways involved in this differentiation were valine, leucine, and isoleucine degradation; ubiquinone and other terpenoid-quinone biosynthesis; nicotinate and nicotinamide metabolism; propanoate metabolism; and beta-alanine metabolism. BCAAs (valine, leucine, and isoleucine) are essential amino acids particularly important for muscle protein synthesis and the production of Acyl-CoAs for energy production [
38]. The enrichment of the BCAA degradation pathway is indicative that these amino acids play an important role in the protein makeup of CON and GRA beef. Other work has also confirmed that cattle-feeding practices do alter BCAA abundance [
39,
40,
41,
42]. Visualization of BCAA metabolism is shown in
Figure S9 Other metabolites that play roles in these enriched pathways and were significantly altered included threonine, tryptophan, histamine derivatives, leucyl phenylalanine, and serine. Threonine, serine, histamine derivative, and leucyl phenylalanine were in significantly higher abundance in GRA compared to CON whole beef steaks. These metabolic pathways imply changes in protein metabolism reflective of the cattle-feeding systems. This concurs with findings that feeding systems impact protein metabolism [
11,
43].
In addition to protein metabolism, differences between GRA and CON whole beef_steak samples in pathways relating to differences in energy metabolism and buffering were identified. Several species of carnitines and fatty acids were found to be significantly impacted by the different cattle-feeding systems (
Table 2). Carnitines play a vital role in the transportation of long-chain fatty acids into the mitochondria where they are then oxidized to produce ATP [
44]. Visualization of the role carnitines play in fatty acid transportation is provided in
Figure S10. This observation has been noted in another study examining cattle-feeding systems and may suggest that grazing systems affect fat content and/or deposition; however, further evaluation of carnitines and long-chain fatty acids is required to appreciate this relationship between feeding systems and metabolism in cattle [
45]. Carnitine metabolites are also biomarkers of red meat consumption and increased cardiovascular disease (CVD) risk [
46]. Proionylcarnitine was found to be in higher abundance in CON whole beef samples. This metabolite would need to be specifically measured in plasma samples to associate cattle-feeding systems with increased CVD risk. Our finding that beta-alanine metabolism was a pathway differentiating GRA and CON whole beef steak samples is consistent with other findings in beef steak metabolomic analyses [
45]. Beta-alanine functions by combining with histidine to generate carnosine, a scavenger of reactive oxygen species, pH buffering capabilities, and metal-ion chelation, and is considered a building block of protein in the body [
47,
48]. Additionally, it can increase the acetylation of histones, thus regulating gene expression at the epigenetic level [
49]. Therefore, the presence of this pathway in the differential analysis of CON versus GRA steaks may be reflective of differences in the need for protein and energy. This may be further supported by the presence of nicotinamide metabolism in this study. Nicotinamide (NAM) is the precursor for the coenzyme nicotinamide adenine dinucleotide (NAD). NAD is an active participant in energy metabolism as it plays roles in oxidation–reduction reactions [
50]. Although intriguing, more research is required to formulate robust conclusions.
Functional pathway enrichment analysis revealed that throughout the postprandial time course, pathway enrichment fluctuated, reflective of digestive timing and differentiated metabolites between conditions. This is the first time that metabolic profiles and related metabolic pathways have been measured in response to the consumption of beef. An hour after the consumption of steaks, various amino acid and fatty acid metabolism pathways were enriched. The timing of this coincides with another study observing protein and lipid digestion at one and two hours post-consumption [
12]. BCAA metabolism was an enriched pathway for the majority of the postprandial time period (hours 1.5–4) (
Figure 3). Saturated fatty acid (SFA) beta-oxidation was also an enriched pathway at multiple timepoints (0, 1, 3, and 4 h). It is not consistently reported whether GRA or CON beef has a greater content of SFA [
4,
5]. SFAs have been associated with increased systemic inflammation and heart disease but are also physiologically important to cellular functions such as N-terminal myristoylation and the transcription of lipogenic genes [
51,
52,
53]. SFAs are most commonly consumed from meats and milk, and the enrichment of this pathway suggests that cattle-feeding systems are impacting the prevalence of SFAs being metabolized [
54]. Caffeine metabolism was also an enriched pathway at hours 0, 2, 2.5, and 4. Participants were offered caffeinated black tea during the study visits to mitigate caffeine withdrawal symptoms. Knowing that caffeine was given to participants validates the sensitivity and strength of the analysis carried out.
Analysis of human plasma samples also showed that postprandial metabolomic profiles of GRA and CON significantly differed from each other. Between conditions, Calamendiol was found to be one of the differentiating metabolites (
Table 3). Calamendiol is a sesquiterpenoid compound and a known metabolite of the plant
Acorus calamus L. [
55]. This compound has been found to have anti-inflammatory potential, indicating its potential as a health-promoting biomarker from cattle exposed to this plant [
56]. It was determined that condition differences contributed most to significant differences in metabolomic profiles compared to time or the interaction of condition and time. This is indicative that cattle-feeding systems do have an impact on the human metabolome, as it did in the whole beef samples. L-valine, a BCAA, was found to be in greater abundance in CON (
Figure S9). L-valine is a metabolite of valine that can be produced by fermentation of
Escherichia coli and
Corynebacterium glutamicum [
57,
58]. Increased plasma concentrations in humans of L-valine have been associated with increased oxidative stress [
59]. Excessive oxidative stress can be harmful to a person’s health and plays a role in the development of cardiovascular and neurological diseases due to the resulting cellular damage [
60]. BCAAs have also been associated with increased CVD risk due to the role they can play in the development of type 2 diabetes [
46]. L-valine was also found to be a differentiating metabolite between conditions according to the ASCA (
Table 3). Along with BCAA metabolism, alanine, aspartate, asparagine, lysine, tryptophan, arginine, and tyrosine metabolism were among the enriched pathways. This shows that metabolites with metabolic are impacted by CON and GRA beef.
This study demonstrates new advancements in the measurement of metabolic responses to consuming beef; however, human participant research includes some limitations. The participant population used in this clinical trial included both men and women of a healthy BMI with no preexisting conditions. This population was chosen to establish a baseline for postprandial response to consuming these specific types of beef, as this is one of the first studies to investigate this response. Male and female participants were not expected to have different responses to consuming beef, based on previous research, which was confirmed by the results as well [
61]. The fasting metabolomic profiles, as shown in
Figure S4, did show the separation of metabolites by treatment, contrary to the expected mixed variation between subjects rather than within subjects. Efforts to control differences within subjects between study visits included instructions to fast for 12 h prior to the time of blood draws and to consume the same meals in the 24 h prior to each study visit (visits 2 and 3). Despite these instructions, caffeine metabolism was one of the most enriched pathways present at fasting per the functional analysis. This could also be a carryover from the previous day, particularly if caffeine was consumed later in the day, as the half-life of caffeine is 3–10 h [
62]. This does show the strength and sensitivity of the functional analysis methods and detection of features related to caffeine metabolism with LC/MS since we can link this finding back to the enriched caffeine metabolism at hours 2 and 2.5 resulting from the ingestion of black tea around hour 0.5. With human nutrition research, errors related to participants compliance are always possible and our results may indicate a deviance by participants from the instructed protocol. The sample size of the study, 10 participants, also may contribute to the unexpected variations within subjects during the 2-week testing period. Each subject accounts for 10% of the total data, as it was a crossover design and data were collected from each subject on two occasions. Daily variations in the human metabolome are expected, so the sample size may amplify these natural variations despite the efforts to control for these [
63]. Interpretation of the human plasma metabolic profiles can be generalized to individuals who represent the study population of healthy men and women with no preexisting conditions and a healthy BMI. Natural limitations of untargeted metabolomic analysis exist; for instance, the large sample size and thousands of observed features hinder the ability to identify the majority of features [
64]. Further targeted analysis needs to be conducted to elucidate specific metabolites that differentiate metabolic profiles seen after consuming GRA and CON beef that were shown in these data. We did not assess total protein, albumin, urea, or creatine in this study. We acknowledge that future research in this area would benefit from the addition of these measures to gain insight into the link between protein, glucose, and fat metabolism [
65]. In both PCA and PLS-DA visualization, two conditionings independent of CON and GRA conditions are apparent at all timepoints. This was not due to the separation of male and female participants or baseline participant anthropometrics and diet. This could be the result of batch effects; however, this does not seem to confound the results. Manual inspection and alignment of the raw MS data were performed in an attempt to minimize this possibility. Since the separation lies within the 95% confidence intervals of each condition, we are confident that it is not majorly contributing to the separation between CON and GRA that was observed. A strength of these findings is that participants were fed an unseasoned steak, not combined with a multi-component meal. This supports our findings that the beef itself is what caused the separation in metabolomic profiles, and not confounding biomarkers from other foods.