3.1. Characteristics of the Spatial Distribution of Ecological Vulnerability in Qinghai and Tibet
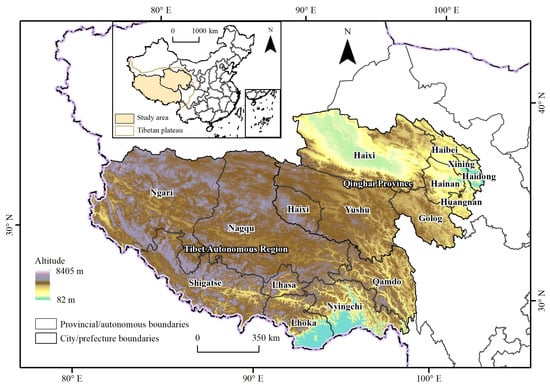
Among the 15 prefecture-level city administrative units, only 2 cities/prefectures in Qinghai Province, Golog and Huangnan, have slightly vulnerable ecosystems. There are 10 cities/prefectures with moderate levels or above of ecological vulnerability, accounting for 33.3% of the total; Xining and Haidong have intensive levels of ecological vulnerability; and the ecosystems of Haixi, Ngari, and Shigatse have severe levels of ecological vulnerability. These indicate that the area with ecosystem vulnerability levels above medium is relatively large, and the ecosystems of Qinghai and Tibet are susceptible to changes due to disturbances from external factors.
The ecological vulnerability levels of Qinghai and Tibet are affected mainly by natural and geographical conditions. Among the 13 indicators, the human disturbance index has the highest degree of effect on the ecological vulnerability of Lhoka, Lhasa, Shigatse, Qamdo, Nyingchi, Golog, Ngari, and Huangnan; the slope factor has the most substantial effect on the ecological vulnerability of Hainan, Xining, and Nagqu; and the potential evapotranspiration factor has the most critical impact on the ecological vulnerability of Haibei and Yushu. In addition, the ecological vulnerability of Haidong is affected mainly by two topographic factors: elevation and slope. Haixi is strongly affected by the human disturbance index and slope. The ecological vulnerability of Nagqu is predominantly determined by the slope and human disturbance index.
3.2. Spatial Distribution Characteristics of Economic Development in Qinghai and Tibet
Among the 11 indicators, the fixed asset investment growth rate index has the greatest obstacle to Haidong, Haixi, and Xining. The per capita fiscal income index has the greatest impact on the economic development levels of Shannan, Shigatse, Qamdo, and Nyingchi. The proportion of tertiary industry to GDP has the greatest impact on Hainan and Yushu. Total tourism revenue has the most severe influence on the level of economic development in Golog, Haibei, and Huangnan. In addition, the economic development level of Haibei is affected by two main factors: the proportion of secondary industry to GDP and total tourism revenue. Haixi is greatly affected by two factors: the fixed asset investment growth rate and the proportion of tertiary industry to GDP. The level of economic development in Lhasa is determined mainly by the growth rate of per capita fiscal income and fixed asset investment.
3.4. Models and Strategies of Development
According to the results of ecological vulnerability, the 15 cities/prefectures in Qinghai and Tibet were divided into two categories, low ecological vulnerability and high ecological vulnerability; furthermore, they were also divided into two categories, economically underdeveloped and economically developed, with an evaluation value of 0.4 for medium and high development levels. Therefore, the 15 cities/prefectures in Qinghai and Tibet can be divided into four types: low ecological vulnerability and economically developed type, low ecological vulnerability and economically underdeveloped type, high ecological vulnerability and economically developed type, and high ecological vulnerability and economically underdeveloped type.
(1) Low ecological vulnerability and economically developed type: As many as 5 of the 15 cities/prefectures have low ecological vulnerability and a high level of economic development, with a high CCD between the two, accounting for 33.3% of the total, indicating that the ecological and economic systems of these 5 cities/prefectures have a benign relationship between coordinated development and mutual promotion. This development type is the best for all cities/prefectures, and its past development paths and patterns can be modeled for other cities/prefectures. Moreover, in future development, it is crucial to avoid the environmental degradation that may result from rapid socioeconomic growth. By comparing the average economic indicators of Type (3), it is evident that it significantly surpasses Type (1) in terms of per capita retail sales of consumer goods, urbanization rate, and tourism revenue. The increase in these indicators might impact the regional natural environment to some extent. Therefore, the five cities/states of Type (1) should mitigate these impacts on the natural environment during their development. They should maintain the current environmental health while continuously improving their industrial structure, focusing on promoting green economic growth, and fostering the harmonious and sustainable development of both ecological and economic systems.
(2) Low ecological vulnerability and economically underdeveloped type: Three cities/prefectures have low ecological vulnerability and economic development levels, accounting for 20% of the total. The interdependence between the economic system and the ecosystem in Shannan is high, while the dependence between Yushu and Qamdo is low. However, the overall economic development levels of the three cities/prefectures still have room for development and improvement under the current ecosystem conditions. Further comparison of economic indicators for cities in low ecological vulnerability areas shows that compared to the average levels of Type (1) cities, Type (2) cities with lower coupling coordination have generally lower economic indicators. Specifically, their per capita GDP, investment growth rate, and tourism revenue are significantly lower than the average of Type (1) cities, although their primary industry proportion is higher. Therefore, this type of city/prefecture needs to continue to increase its industrial and economic strength in future development and further improve the level of social and economic development to maintain its ecological quality and the health and stability of the ecosystem.
(3) High ecological vulnerability and economically developed type: There are three cities/prefectures with low economic development levels but high ecological vulnerability levels; compared with what is required for a good social and economic development status, the degree of ecological environmental protection and attention is slightly insufficient. Among them, the higher degree of dependence between Lhasa and Xining indicates that the socioeconomic development of these two cities/prefectures may have somewhat affected the ecosystem, while the lower CCD in Haixi indicates that more attention should be given to the ecosystems when carrying out socioeconomic development. Furthermore, more attention should be given to increasing the resilience and adaptability of the ecosystem to minimize the continuous consumption of resources and increase the benign interaction between the two systems.
(4) High ecological vulnerability and economically underdeveloped type: The other four cities/prefectures have high ecological vulnerability and low levels of economic development; this type needs to be the focus of future development processes. Among them, the dependence between the two systems in Haidong is greater, probably because ecosystem vulnerability constrains its socioeconomic development. The dependence between the two systems in Nagqu, Shigatse, and Ngari is smaller. In the future, more attention should be given to their socioeconomic development. Comparing Type (4) with Type (1), most socioeconomic indicators of Type (4) are similar to those of Type (1). However, the investment growth rate and urbanization rate in Type (4) are significantly lower than in Type (1), and there is also a notable gap in tourism revenue. Considering that most cities in Type (4) are located in the western regions of Qinghai and Tibet, the socioeconomic development of these areas is constrained by regional natural conditions. Its future requires more financial support from the State and the Government, while prioritizing the development of the ecotourism industry based on the protection of the natural environment. In the process of increasing the urbanization rate, it is essential to maintain a balance with ecological conservation.
Source link
Jie Wang www.mdpi.com


