1. Introduction
This paper constructs an emergency environmental monitoring system. The system comprises three components: a portable emergency environmental monitoring device, a UAV-mounted LoRa gateway, and backend analysis software. The portable monitoring device can collect critical environmental parameters such as wind speed and direction accurately in real-time. The UAV-mounted LoRa gateway expands the data transmission coverage of ground monitoring devices through aerial relay communication. The backend analysis software provides data analysis capabilities, supporting emergency decision-making.
2. Development of the Emergency Environmental Monitoring Device
2.1. Mechanical Structure Design
2.2. Circuit and Component Integration Design
2.3. Design Principles
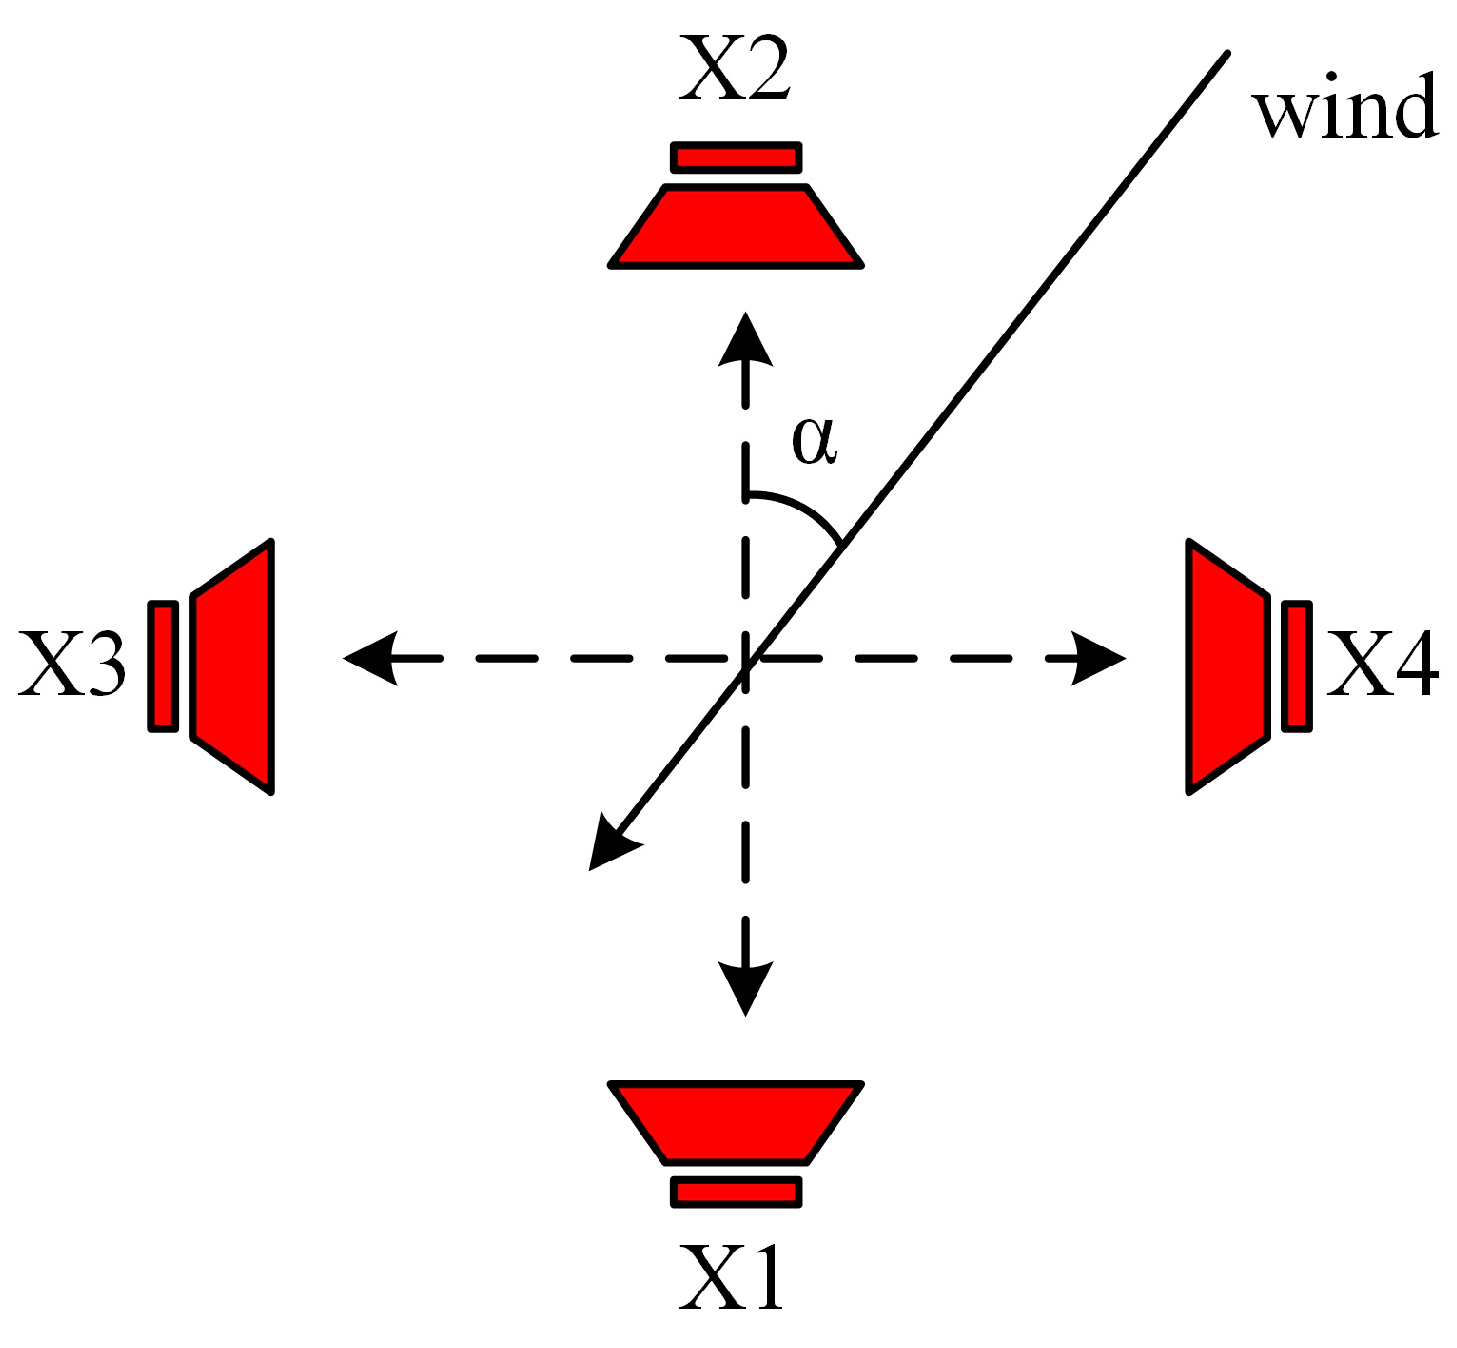
Principles of Wind Speed and Direction Measurement
2.4. Software Design
3. Data Transmission Design
3.1. Characteristics and Advantages of LoRa Communication
3.2. Data Transmission Design Architecture
Ground Equipment: The sensors in the ground equipment collect environmental data, such as wind speed and wind direction, which are then modulated by the LoRa module. Using Chirp Spread Spectrum (CSS) technology, the LoRa module converts the digital signals into spread-spectrum signals. The LoRa module represents different digital signal values by altering the frequency of linear frequency modulation, thereby completing the signal transmission. These spread-spectrum signals are subsequently transmitted via LoRa to the LoRa gateway mounted on the UAV. Upon receiving the signals, the gateway uses reverse spread-spectrum modulation to demodulate the signals and performs decoding and verification to ensure the integrity and accuracy of the data.
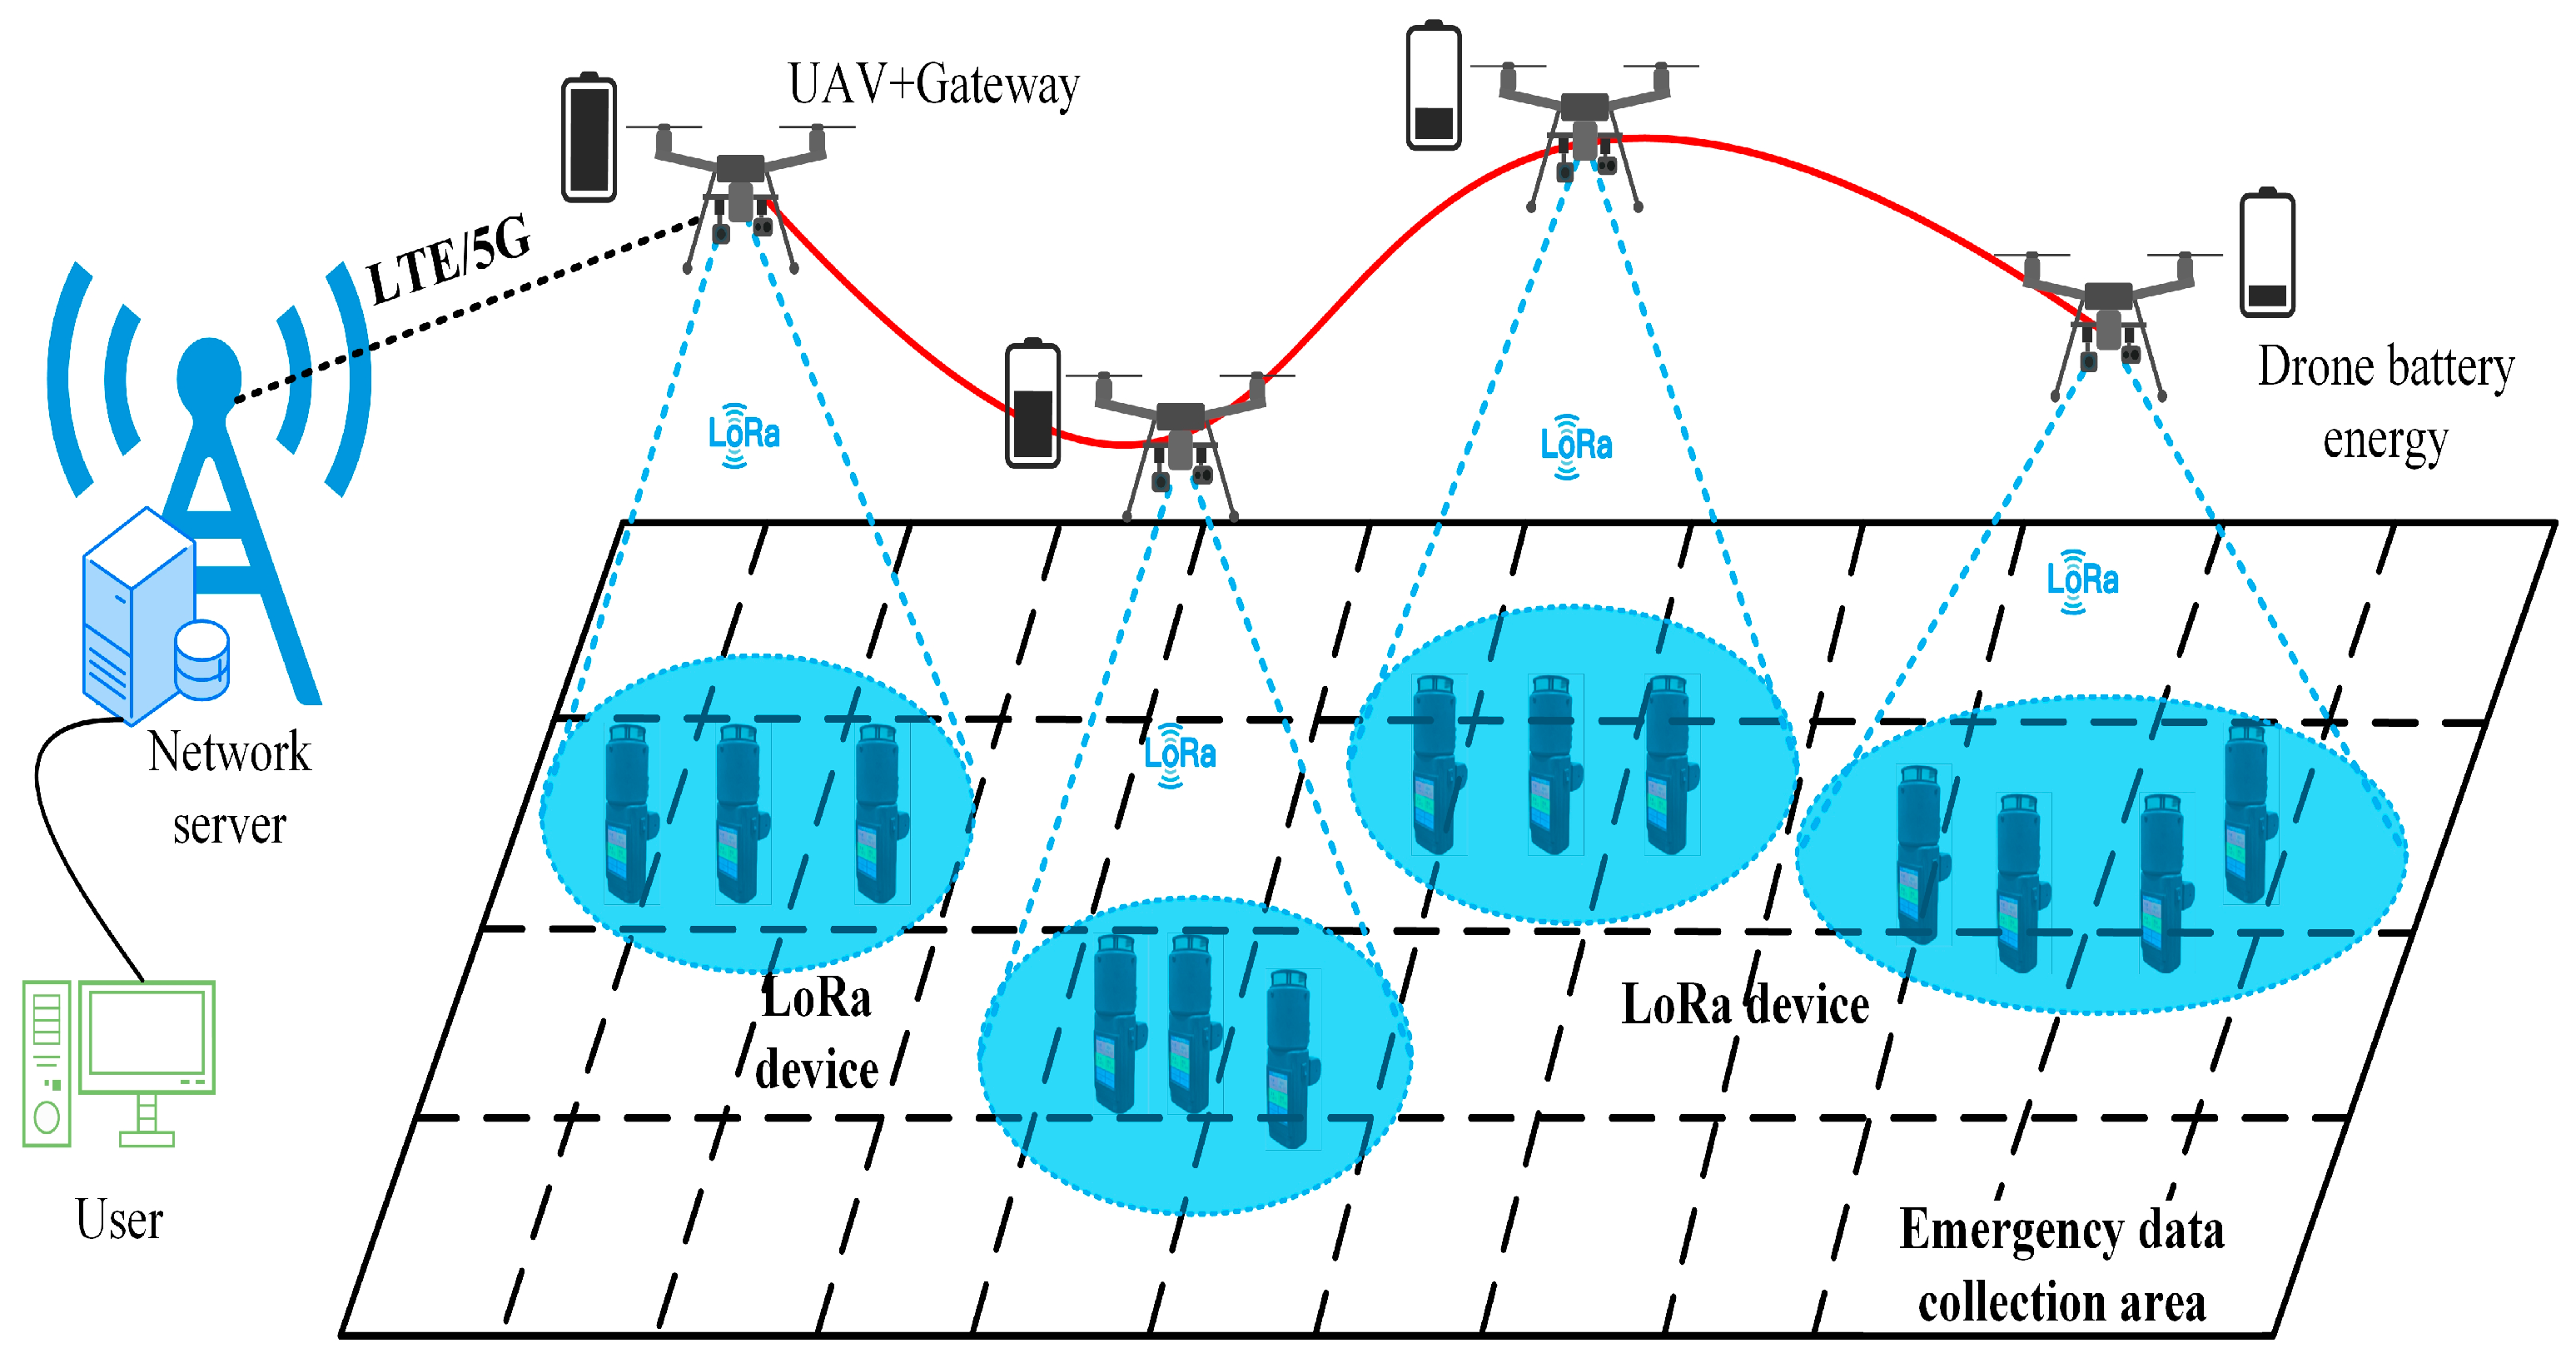
UAV Relay: The UAV is equipped with a LoRa gateway (Model: E90-DTU) manufactured by Ebyte, which is responsible for receiving data from ground monitoring devices. After receiving the LoRa data, the gateway utilizes its built-in functionality to complete the conversion from the LoRa protocol to the TCP/IP protocol, including data demodulation, decoding, verification, and encapsulation. The converted data are then uploaded to the network server via the LTE/5G network, ensuring the reliability and integrity of data transmission. Additionally, by adjusting the UAV’s flight altitude and position, the transmission distance and signal strength can be further optimized, thereby enhancing the overall communication performance.
Network Server: All collected data are transmitted to the server for analysis and storage after the UAV relays.
3.3. Transmission Reliability and Fault Tolerance Mechanism
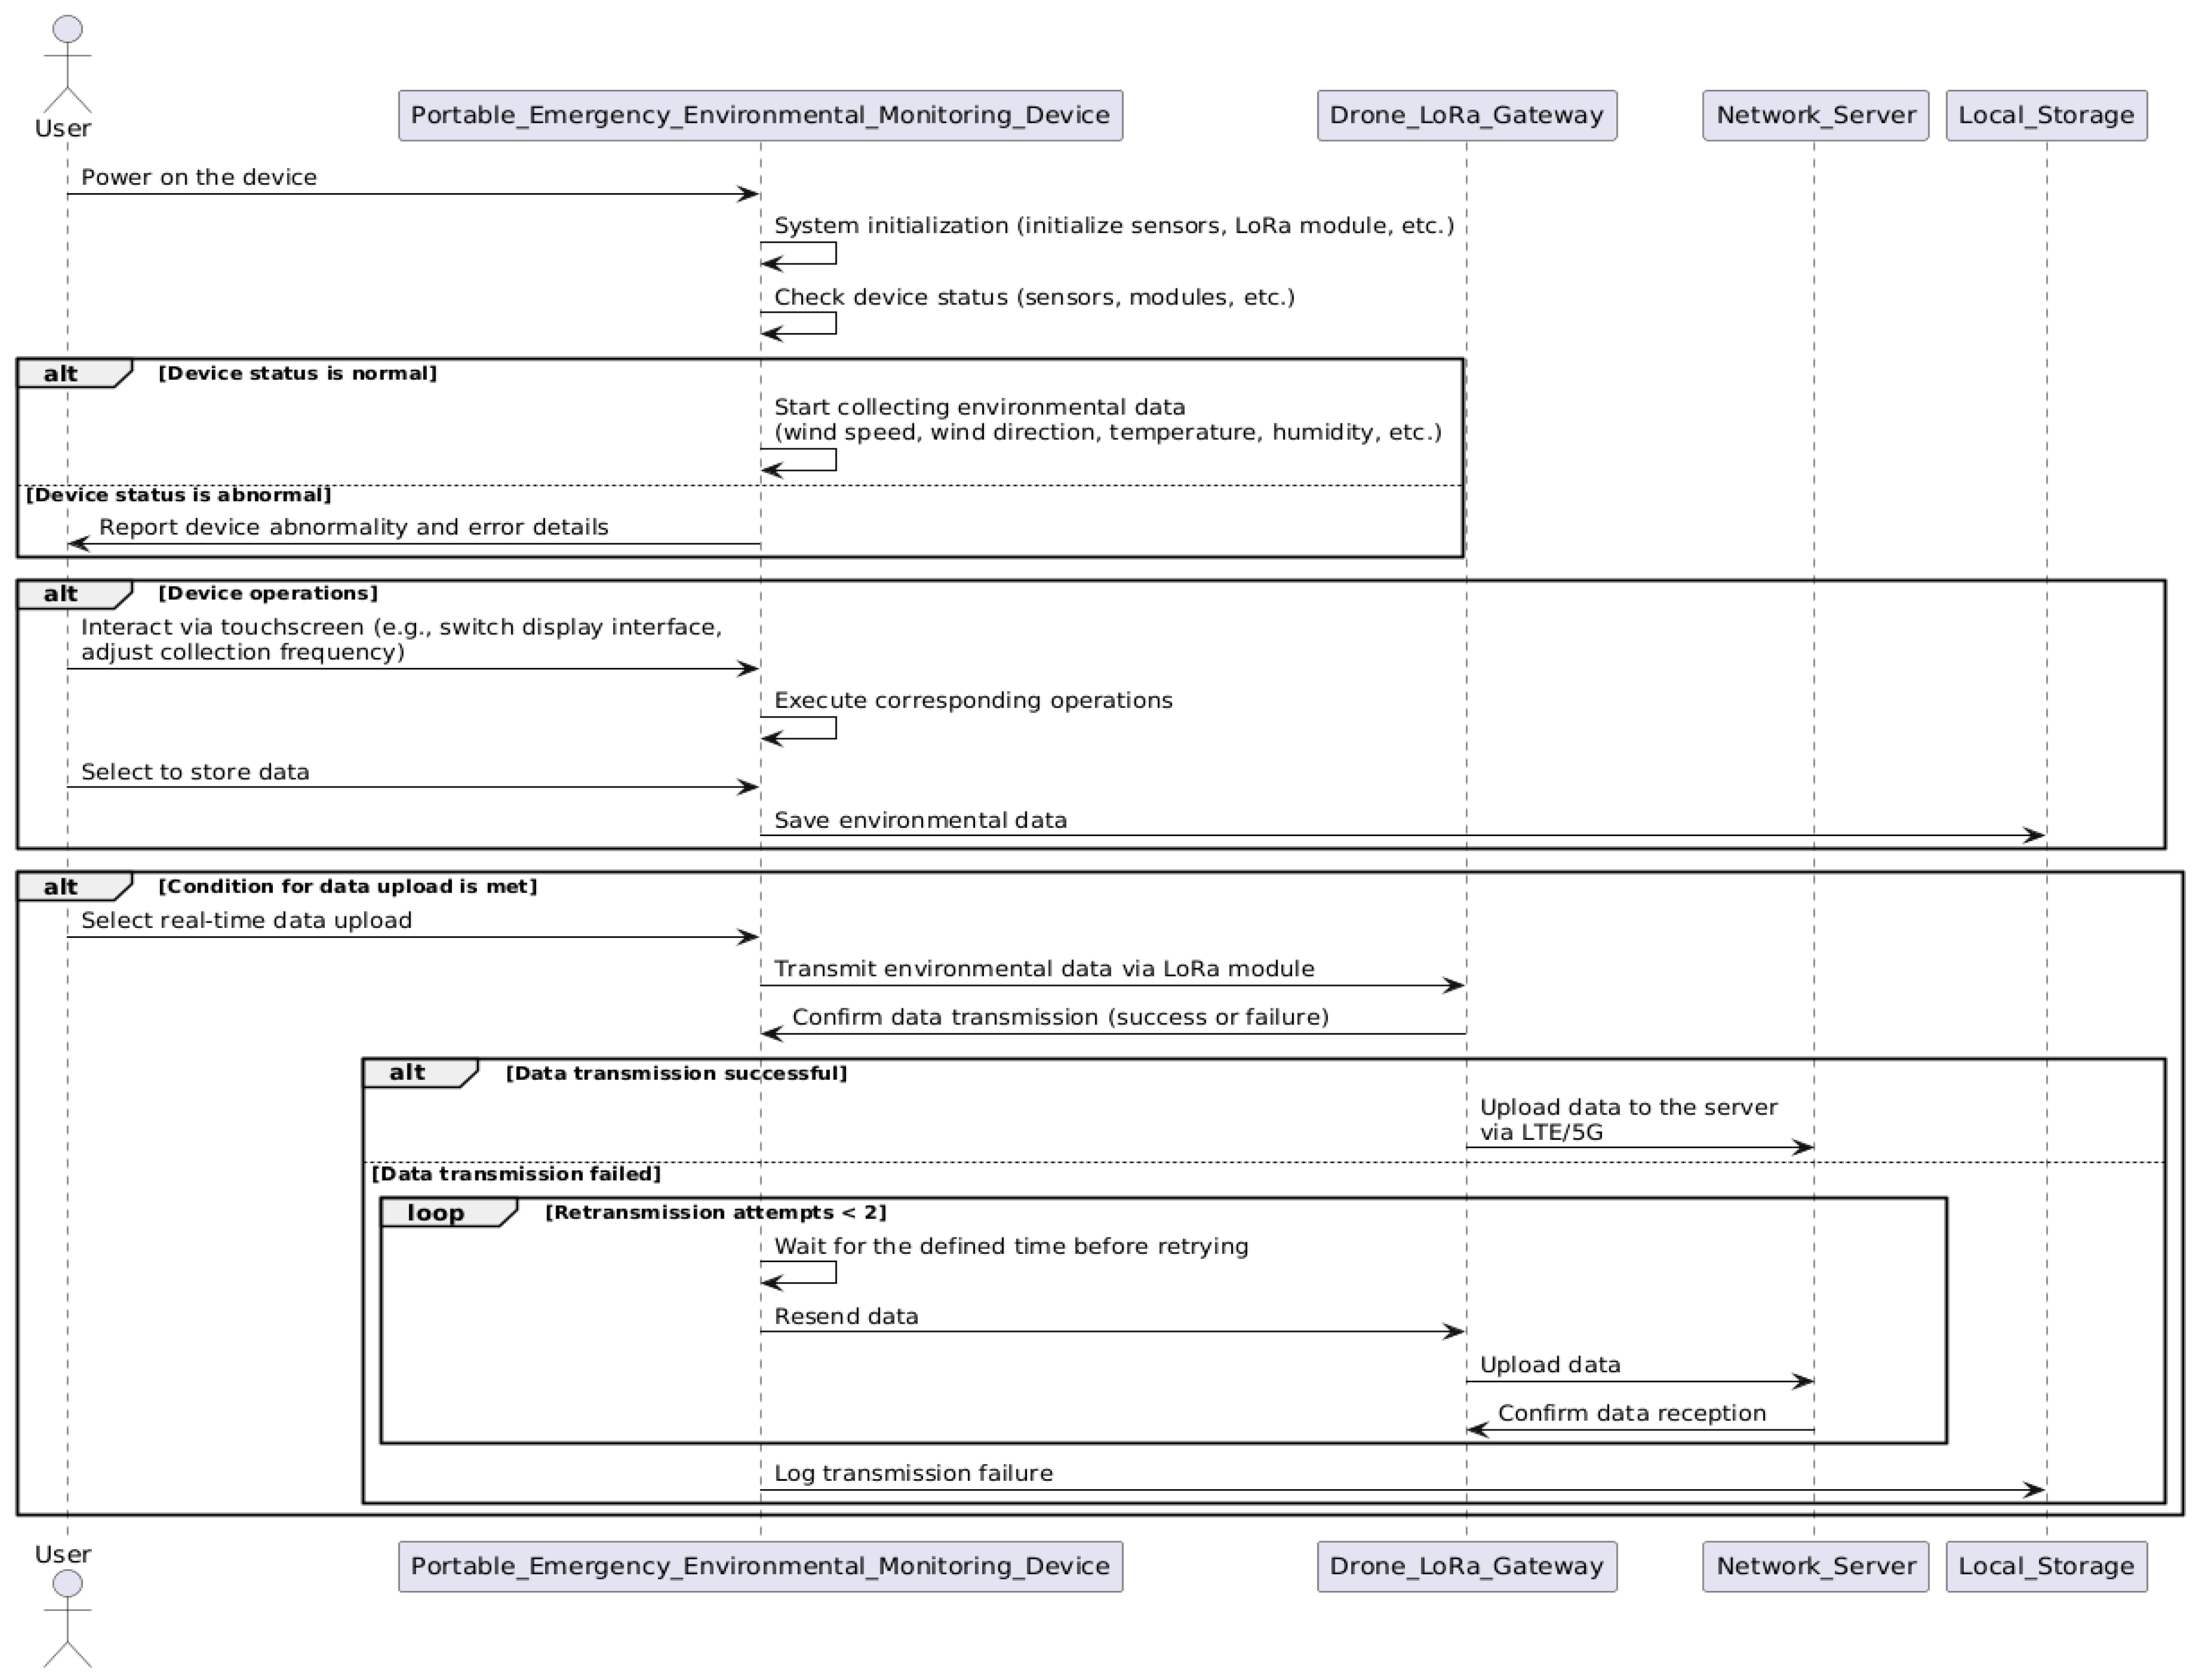
In complex emergency environments, data transmission encounters challenges such as signal interference and obstruction by physical barriers. The system incorporates redundant data transmission and automatic retransmission mechanisms to ensure transmission reliability. When data are lost or corrupted during transmission, the device can automatically detect errors in data packets and retransmit until the complete data are successfully received. This design effectively mitigates the risk of data loss. The specific implementation process is as follows:
After each data packet is sent, the device waits for an acknowledgment signal (ACK) from the LoRa gateway. If no ACK is received within the specified time, the device triggers an automatic retransmission mechanism, with up to two retransmissions to minimize the risk of data loss. This design effectively adapts to signal interference in complex environments, while ensuring the reliability of data transmission and minimizing the device’s energy consumption.
Based on the characteristics of the LoRa protocol, communication parameters were optimized to meet the transmission requirements in complex environments. Specifically, a higher spreading factor (SF) was set to enhance the signal’s anti-interference capability for long-distance transmission or under signal obstruction conditions. The channel bandwidth was optimized to reduce network congestion caused by the insufficient bandwidth. Additionally, the transmission power was dynamically adjusted to ensure signal coverage while minimizing device power consumption. These optimization measures further improve the system’s adaptability and transmission performance in complex emergency environments.
4. Experimental Design and Validation
4.1. Device Evaluation
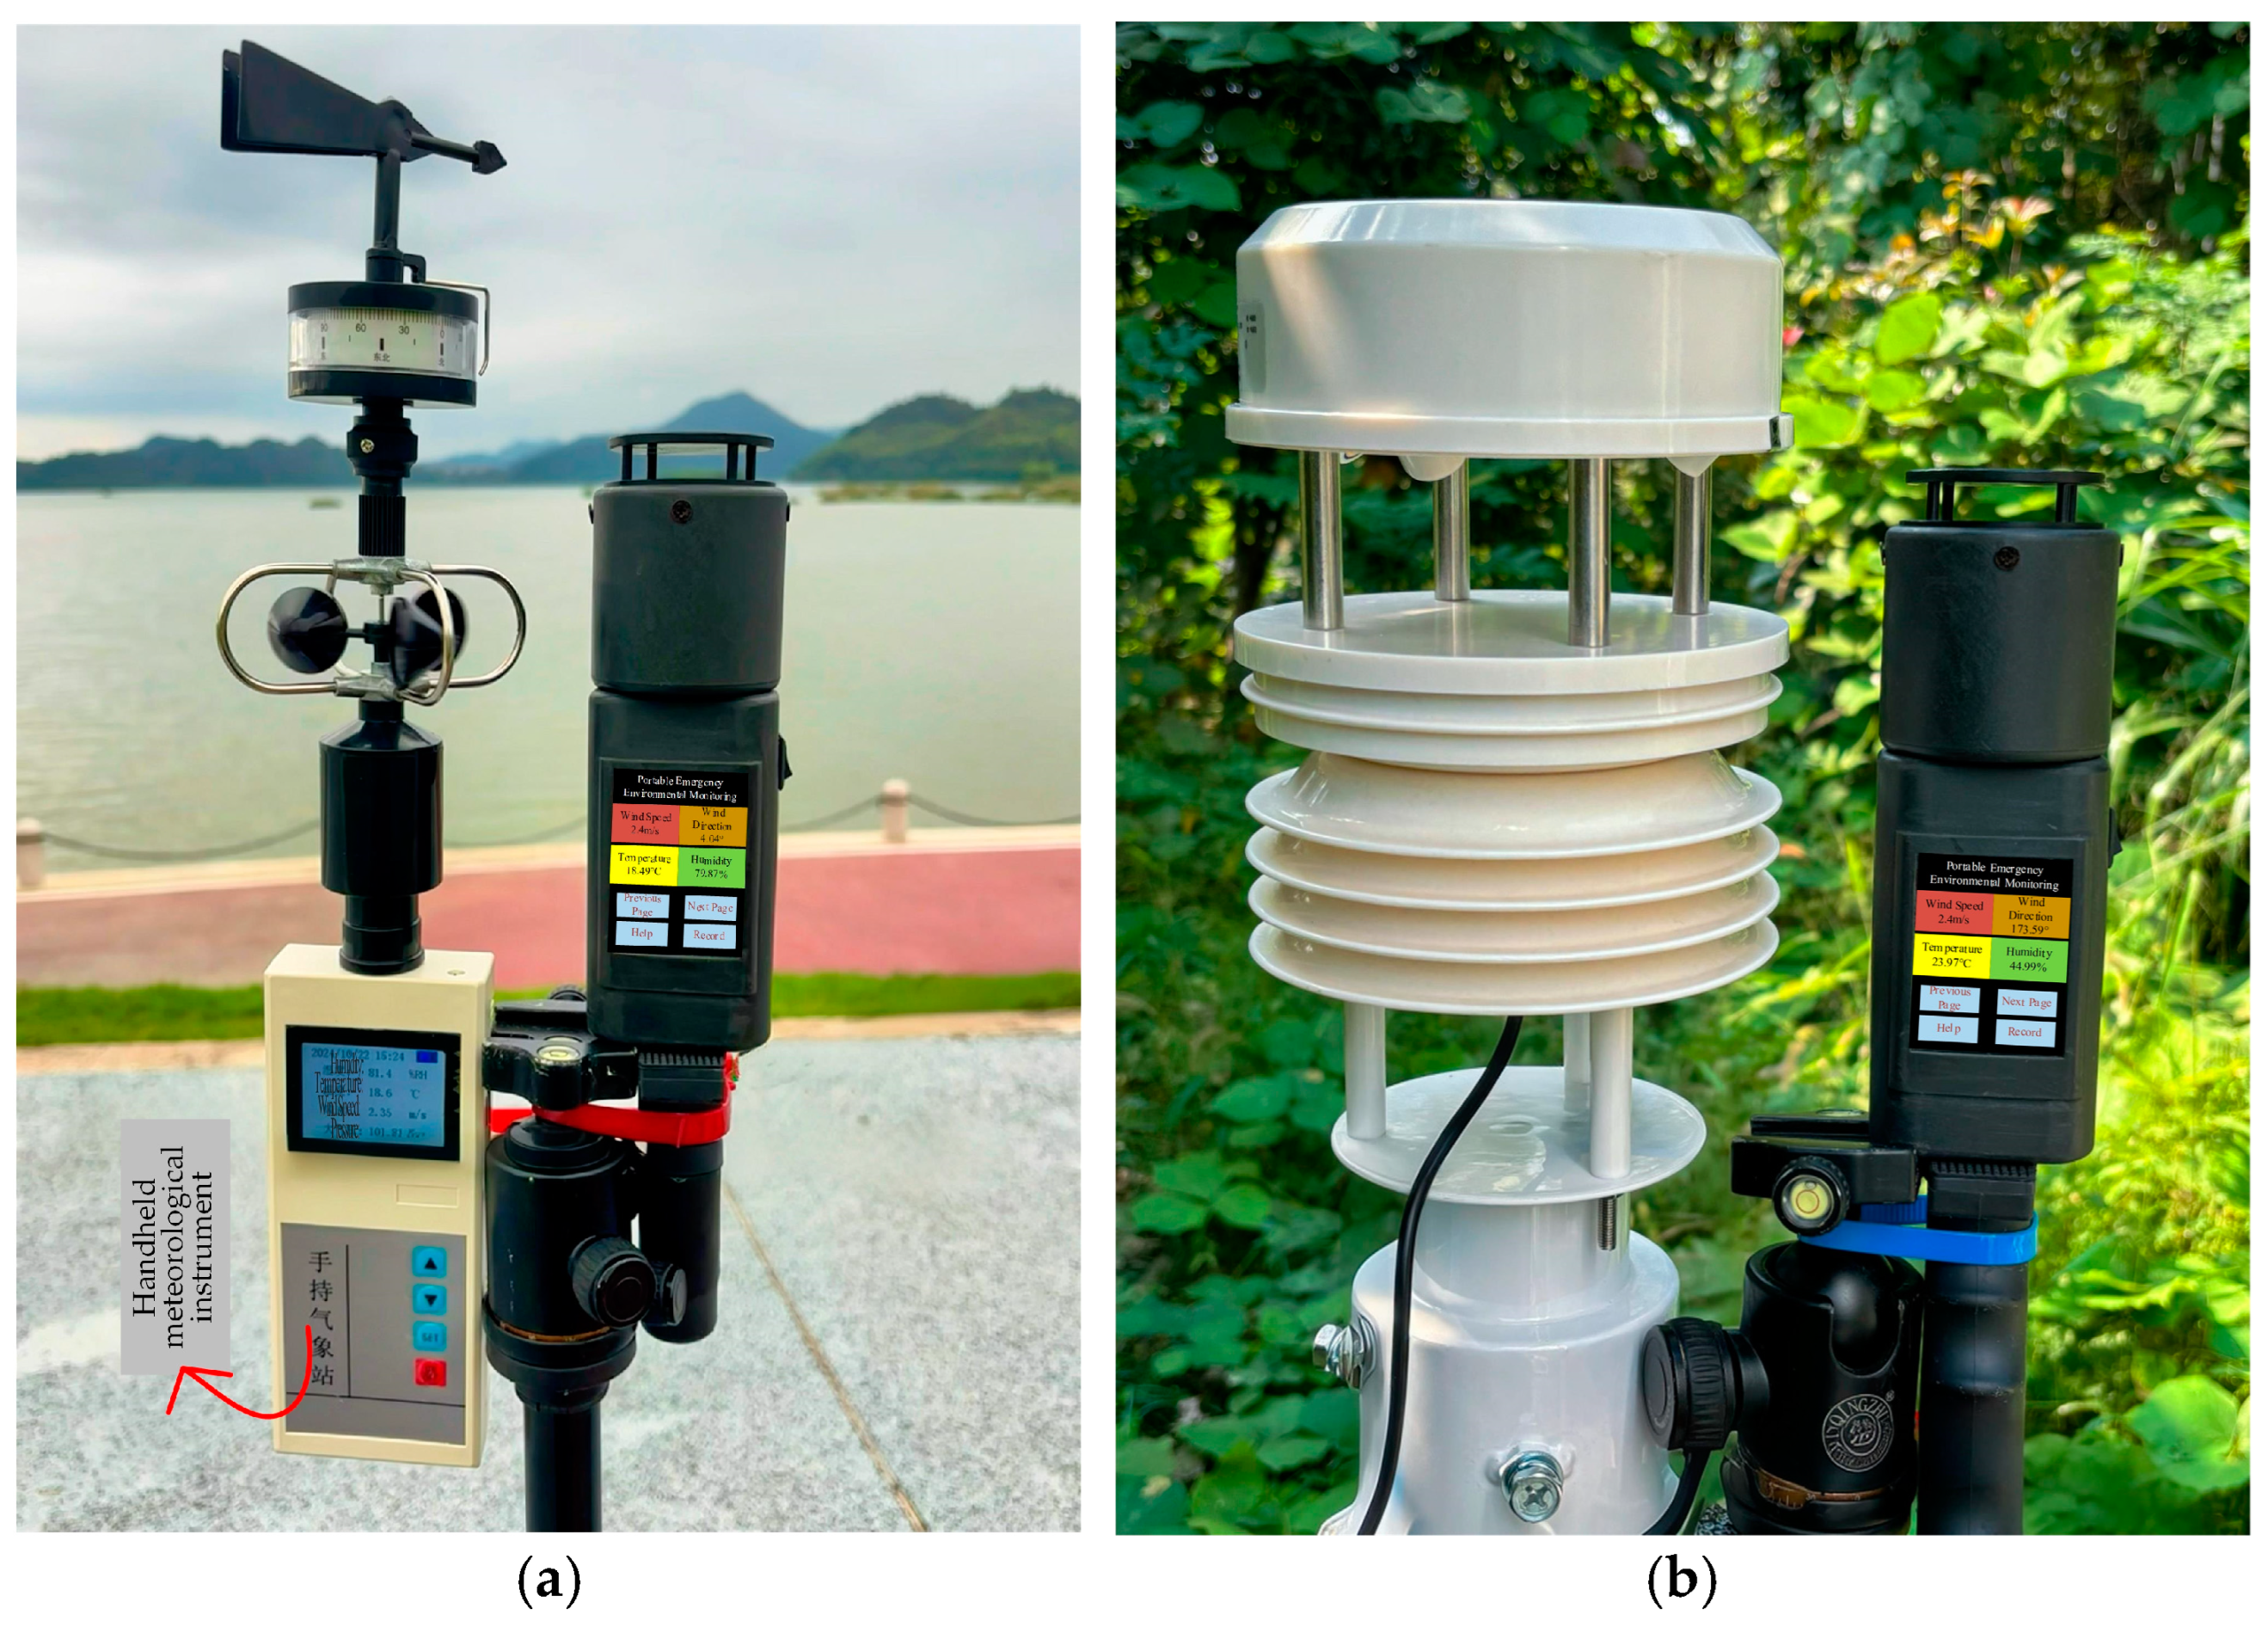
To verify the accuracy of data collection by the developed monitoring device, a handheld meteorological instrument (developed by Shandong Fengtu Internet of Things Technology Co., Ltd., Weifang, China) and an ultrasonic integrated meteorological station (developed by SIN Electronic Technology Co., Ltd., Jinan, China) were used for comparison. Experiments were conducted at the Donghu campus of Zhejiang Agriculture and Forestry University and in the surrounding mountains and forests. Parameters such as wind speed, wind direction, temperature, and humidity were measured in various environments to assess the performance of the developed monitoring device in complex real-world conditions.
Data Accuracy Evaluation
In the equation above, Zi represents the measurement value of the comparison device, represents the measurement value of this device, and n represents the number of data points.
4.2. Data Transmission Evaluation
This study conducted multiple outdoor experiments to evaluate the long-range data transmission capability of LoRa technology in environments without infrastructure, particularly in complex terrains such as forests and dynamic environments. The experimental site was at the Donghu campus of Zhejiang Agriculture and Forestry University in Hangzhou, Zhejiang Province, and the surrounding mountains and forests. This area features a complex environment with numerous natural barriers.
4.2.1. Ground Test
This study performed ground tests in two distinct environments:
- (1)
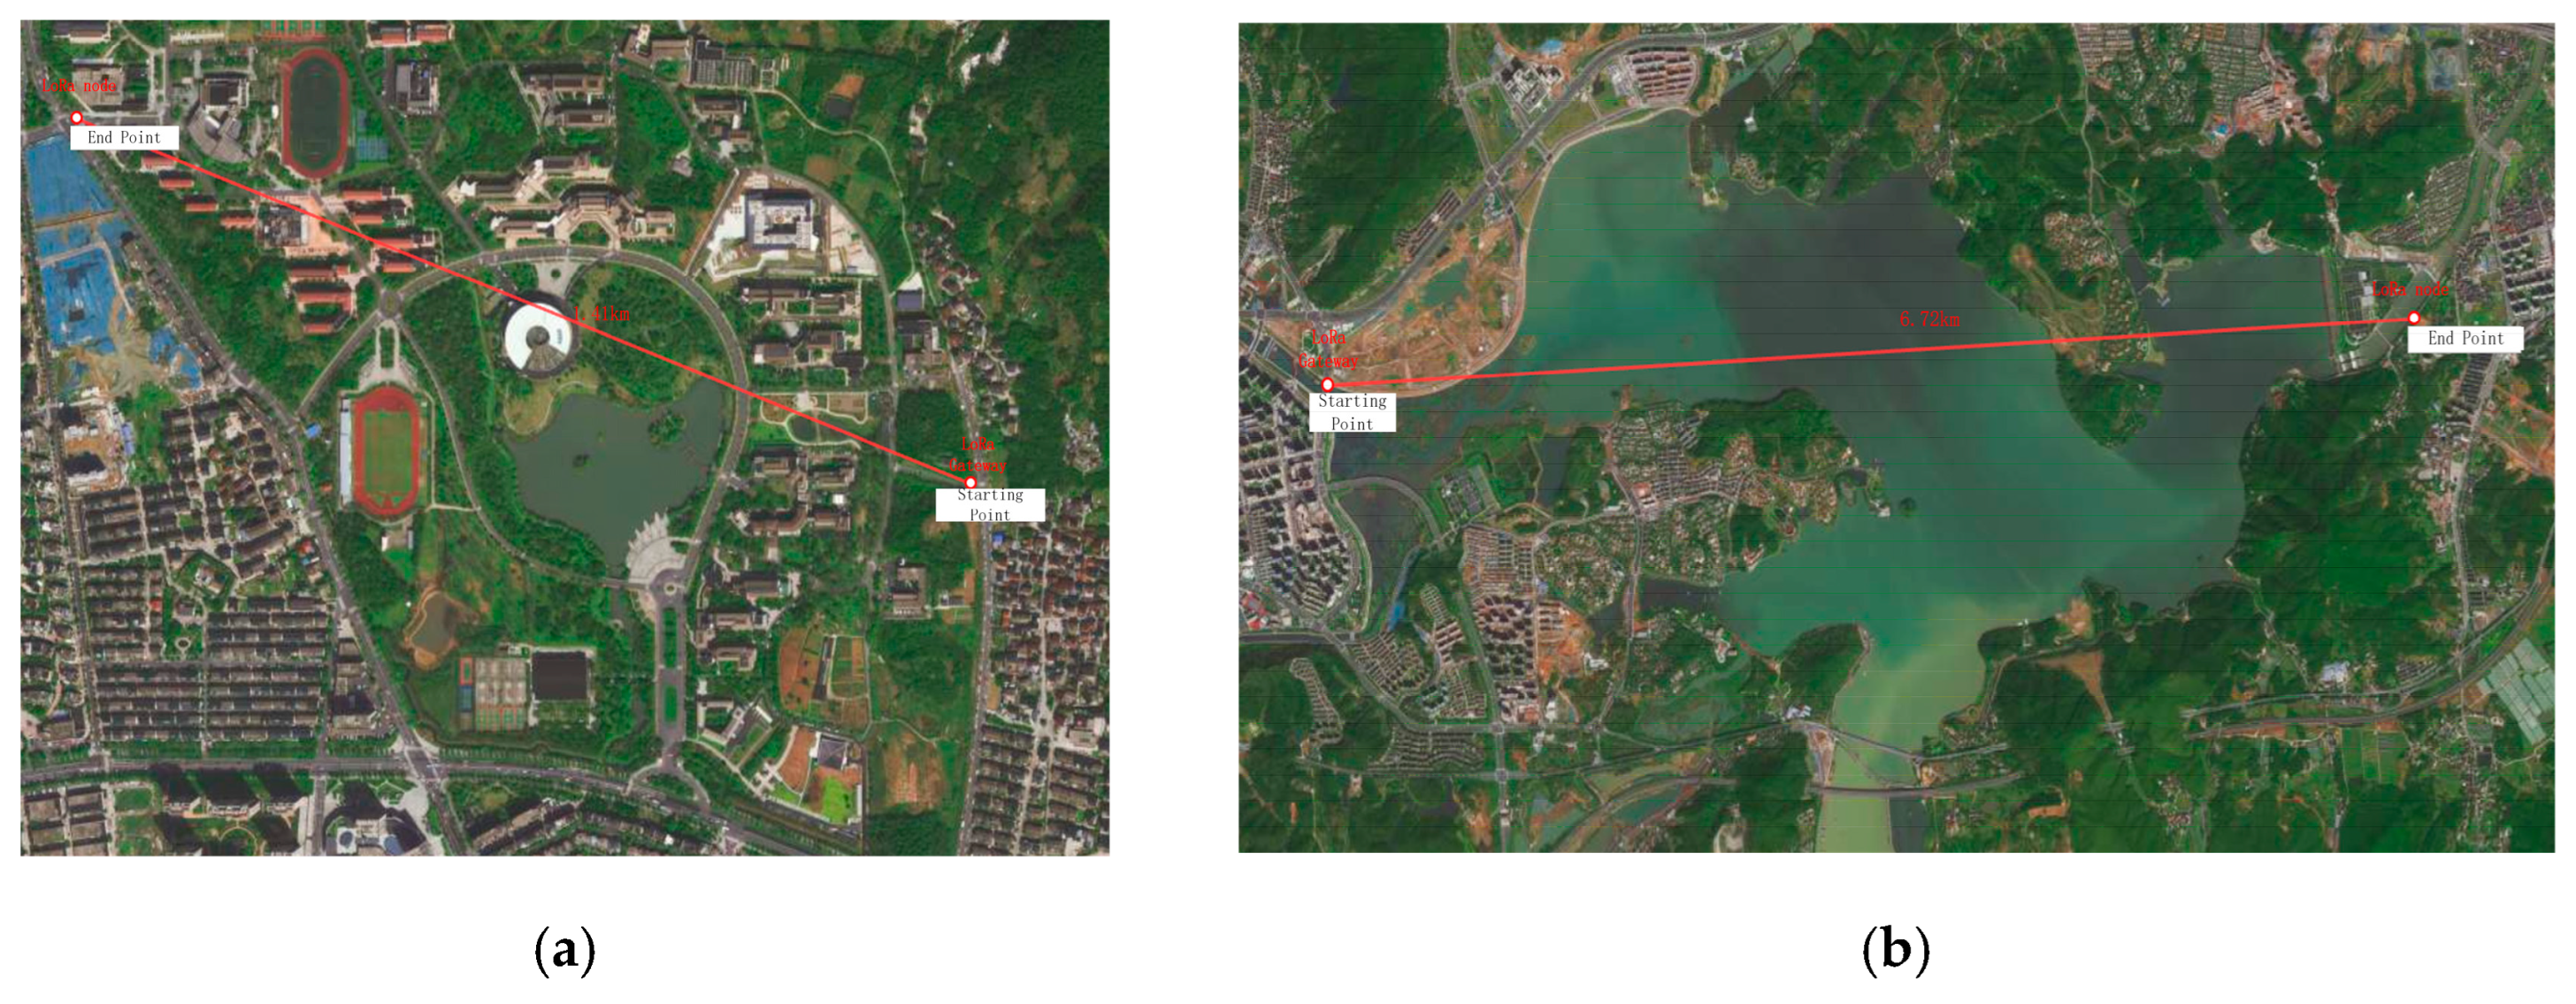
- Environment with many obstacles (such as buildings, hills, and trees): Test 1 was carried out on the eastern side of the campus, where the LoRa gateway was fixed at the east gate, and the LoRa module was carried by the staff, moving around the perimeter of the campus. The results indicate that, in this complex environment, the maximum communication distance reached 1.41 km (Figure 11a).
- (2)
- Environment with fewer obstacles: Test 2 was carried out at the artificial lake near the school, where the LoRa gateway was fixed at one end of the lake, and the LoRa module moved along the lakeside track. The results indicate that the maximum communication distance in an open environment with fewer obstacles can reach 6.71 km (Figure 11b).
4.2.2. UAV Ground Test
4.2.3. Communication Tests at Various Heights and Distances
To further evaluate the communication performance of the UAV-mounted LoRa gateway at different heights and distances, an experiment simulating a forest environment was conducted at the Zhejiang Agriculture and Forestry University East Lake Campus Botanical Garden (N 30°15′ E 119°43′). The settings of the LoRa gateway and LoRa module are identical to those in the previous tests. The experiment analyzed the communication performance between the UAV at heights of 50 m, 100 m, and 200 m and the ground LoRa device over distances ranging from 100 to 1800 m. The ground device monitored environmental parameters, including temperature, humidity, carbon monoxide, wind speed, and wind direction, and transmitted the data to the UAV-mounted LoRa gateway via the LoRa module. The gateway then uploaded the data to the server through the cellular network.
4.2.4. Experimental Results and Analysis
The transmission range of the transceiver was verified through testing. The test involved the portable environmental monitoring device transmitting data packets via the LoRa module, which were received by the LoRa gateway carried by the unmanned aerial vehicle (UAV).
At 50 m altitude: The signal rapidly attenuates beyond 500 m, with significant degradation occurring, especially at distances of 1000 m and beyond, where the signal strength drops to the threshold level, making stable communication nearly impossible.
At 100 m altitude: At a height of 100 m, the signal remains stable, with the RSSI value staying relatively constant even at a distance of 1000 m. This suggests that moderately increasing the flight altitude can effectively mitigate the impact of obstacles.
At 200 m altitude: Signal attenuation is minimal, and even at a distance of 1800 m, the RSSI value remains around −70 dBm. The increased flight altitude effectively reduces signal reflection and loss, resulting in better long-distance communication performance than lower altitudes.
5. Results
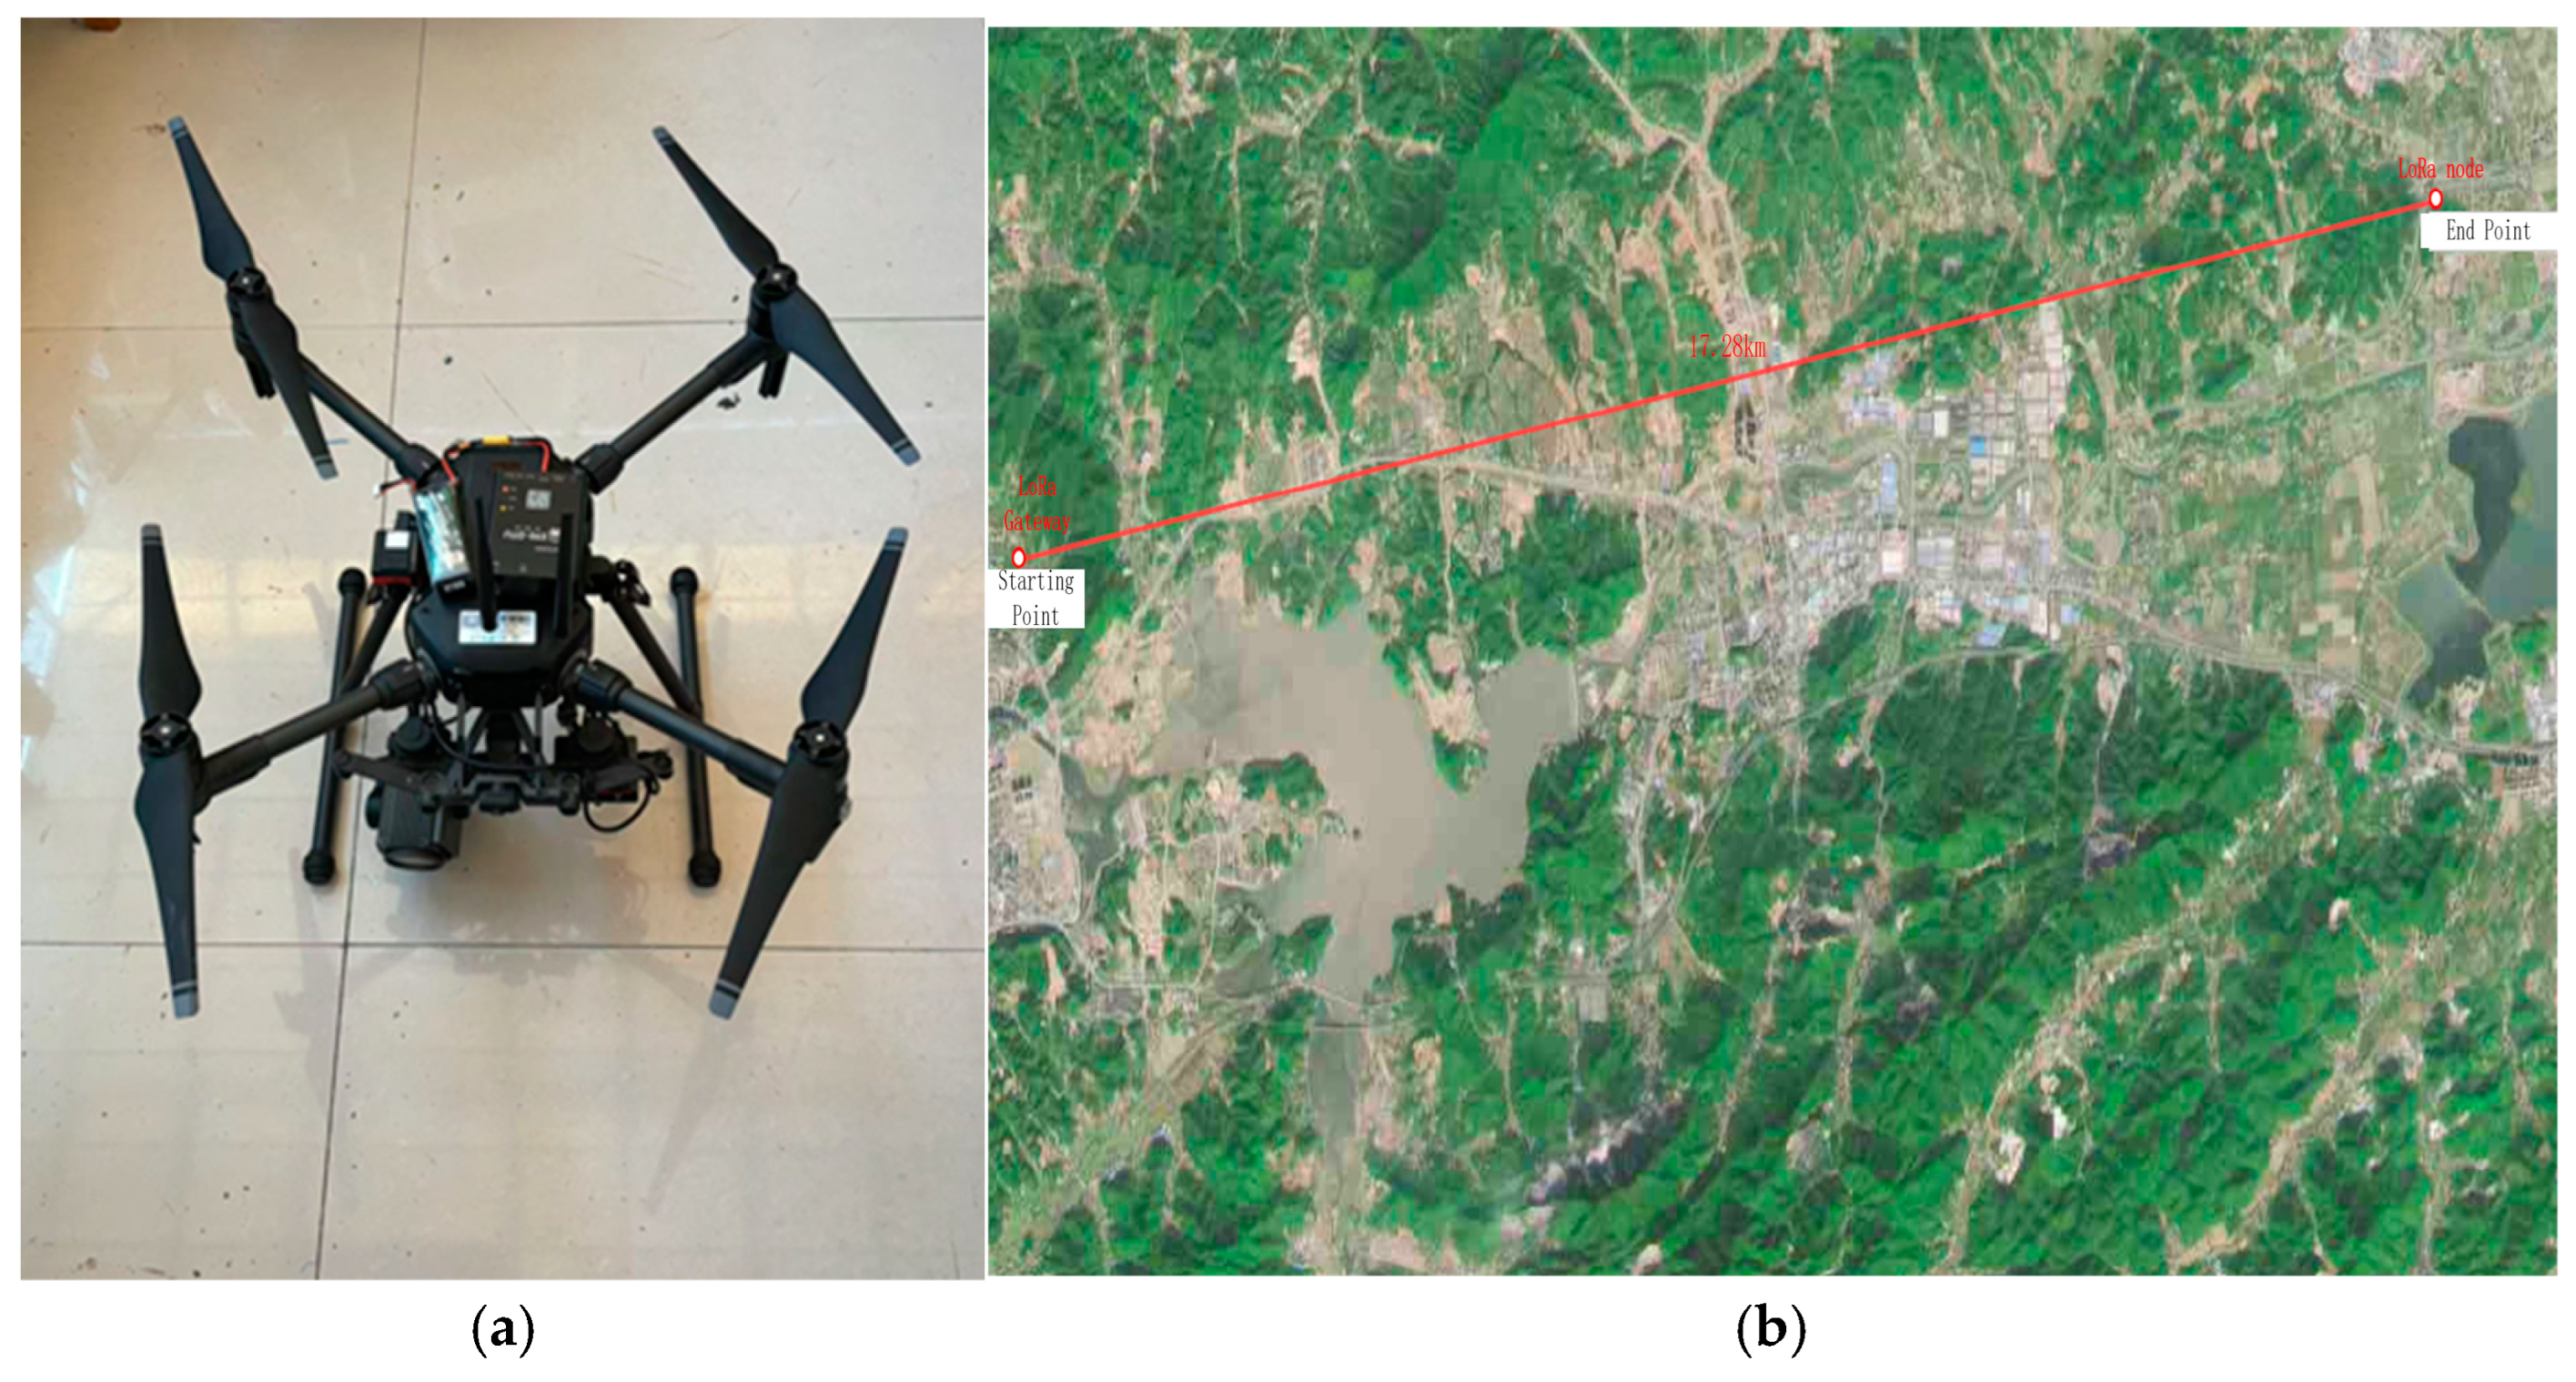
This study validated the measurement accuracy of the emergency environmental monitoring device through comparative experiments. Four environmental factors—temperature, humidity, wind speed, and wind direction—were selected and compared against the measurement results from a handheld meteorological instrument and an ultrasonic all-in-one weather station. The experimental results showed that the measurement errors (MAE, MSE and RMSE) of the proposed device were all smaller than those of the handheld meteorological instrument and relatively close to the results of the ultrasonic all-in-one weather station, demonstrating high measurement accuracy and reliability. These findings confirm that the device meets the monitoring requirements in complex environments, providing strong support for its application in emergency scenarios. In the data transmission experiment, this study evaluated the transmission performance of LoRa signals and found that transmission distance is highly dependent on the communication environment. In the UAV-mounted gateway test, the transmission distance reached 17.25 km, significantly exceeding the 6.71 km achieved in the ground test. This demonstrates that, in obstructed environments, utilizing UAVs as communication relays can effectively mitigate the signal attenuation issues commonly encountered in traditional ground-based communication systems. In addition, this study conducts UAV communication experiments at different heights and distances to verify the significant impact of flight altitude on communication stability. Flight altitudes of 100 m and above effectively reduce signal interference from obstacles, enhancing signal transmission stability and extending the effective coverage range.
6. Discussion
This study innovates by combining the low-power, long-range transmission characteristics of LoRa technology with the flexible deployment advantages of unmanned aerial vehicles (UAVs), proposing an emergency environmental monitoring solution with wide-area coverage capabilities. Compared to traditional fixed monitoring stations, this system significantly enhances adaptability and practicality in complex terrains and environments without existing infrastructure. Additionally, it features high portability, flexible deployment, and simple operation. Its lightweight design allows for rapid deployment to disaster sites, reducing response time, while the UAV-mounted LoRa gateway further extends the data transmission range, effectively supporting temporary and dynamic monitoring needs. These features make the system more practical and efficient in emergency scenarios, providing a reliable solution for areas that traditional monitoring approaches cannot cover. Meanwhile, this study also provides important technical references for the future application of UAVs and IoT technology in emergency monitoring.
Although this study has achieved specific results in real-time acquisition of environmental factors, communication coverage, and data transmission stability, some limitations remain. Firstly, the flight time and energy management of the unmanned aerial vehicle (UAV) remain significant factors affecting the system’s continuous operation. In the experiments, the single-flight endurance was approximately 30 min. Long-term real-time monitoring tasks over a large area may require multiple UAVs to rotate in execution or breakthroughs in UAV battery technology. Secondly, in the LoRa signal transmission process, interference factors such as weather conditions and obstacles have a complex impact on the signal. Further research can be conducted on the signal transmission characteristics under different environmental conditions to improve the system’s robustness.
7. Conclusions
This study designed and implemented an emergency environmental monitoring system that integrates UAVs with LoRa technology, providing an efficient and reliable technical solution to address emergency needs in remote areas and environments with limited infrastructure. By integrating a portable emergency environmental monitoring device, a UAV-mounted LoRa gateway, and a backend data analysis platform, the system enables real-time collection and long-distance transmission of key environmental factors such as wind speed, wind direction, temperature, and humidity. The experimental results demonstrate that the portable emergency monitoring device can accurately and efficiently collect real-time data on critical environmental parameters, such as wind speed and direction, and enable immediate data uploads. The system exhibits significant application potential in emergency scenarios, particularly in complex terrains or environments with poor line-of-sight signal conditions. The UAV-mounted LoRa gateway significantly extends the data transmission range, thereby enhancing the overall performance and adaptability of the system.
Author Contributions
Conceptualization, C.L.; methodology, L.F.; formal analysis, L.S.; investigation, S.Z. (Shan Zhu); data curation, H.S. and L.F.; writing—original draft, C.L.; writing—review and editing, L.F. and H.S.; software K.Z. and J.W.; investigation S.Z. (Shaobin Zhang). All authors have read and agreed to the published version of the manuscript.
Funding
This research was financially supported by the National Natural Science Foundation of China (No. 42001354), the Zhejiang provincial key science and technology project (Grant No. 2018C02013), the Zhejiang University Student Science and Technology Innovation Activity Plan (New Seedling talent Plan subsidy project, 2024R412B048), and the Modern Agriculture and Forestry Artificial Intelligence Industry College Joint School-Enterprise Project (LHYFZ2308), Zhejiang A&F University Research and Development Fund (2023LFR099).
Data Availability Statement
The data used to support the findings of this study are available from the corresponding author upon request.
Conflicts of Interest
The authors declare no conflicts of interest.
References
- Forster, P.M.; Smith, C.J.; Walsh, T.; Lamb, W.F.; Lamboll, R.; Hauser, M.; Ribes, A.; Rosen, D.; Gillett, N.; Palmer, M.D.; et al. Indicators of Global Climate Change 2022: Annual update of large-scale indicators of the state of the climate system and human influence. Earth Syst. Sci. Data 2023, 15, 2295–2327. [Google Scholar] [CrossRef]
- Bacco, M.; Delmastro, F.; Ferro, E.; Gotta, A. Environmental monitoring for smart cities. IEEE Sens. J. 2017, 17, 7767–7774. [Google Scholar] [CrossRef]
- Benson, E. One infrastructure, many global visions: The commercialization and diversification of Argos, a satellite-based environmental surveillance system. Soc. Stud. Sci. 2012, 42, 843–868. [Google Scholar] [CrossRef]
- Friha, O.; Ferrag, M.A.; Shu, L.; Maglaras, L.; Wang, X. Internet of Things for the Future of Smart Agriculture: A Comprehensive Survey of Emerging Technologies. IEEE/CAA J. Autom. Sin. 2021, 8, 718–752. [Google Scholar] [CrossRef]
- Zhang, J.; Yan, Q.; Zhu, X.; Yu, K. Smart industrial IoT empowered crowd sensing for safety monitoring in coal mine. Digit. Commun. Netw. 2023, 9, 296–305. [Google Scholar] [CrossRef]
- Zhang, J.; Wang, F.-Y.; Wang, K.; Lin, W.-H.; Xu, X.; Chen, C. Data-Driven Intelligent Transportation Systems: A Survey. IEEE Trans. Intell. Transp. Syst. 2011, 12, 1624–1639. [Google Scholar] [CrossRef]
- Bhatia, M.; Ahanger, T.A.; Manocha, A. Artificial intelligence based real-time earthquake prediction. Eng. Appl. Artif. Intell. 2023, 120, 105856. [Google Scholar] [CrossRef]
- Wang, G.; Badal, A.; Jia, X.; Maltz, J.S.; Mueller, K.; Myers, K.J.; Niu, C.; Vannier, M.; Yan, P.; Yu, Z.; et al. Development of metaverse for intelligent healthcare. Nat. Mach. Intell. 2022, 4, 922–929. [Google Scholar] [CrossRef] [PubMed]
- Zhang, Z.; Zhou, C.; Sheng, L.; Cao, S. Optimization Schemes for UAV Data Collection with LoRa 2.4 GHz Technology in Remote Areas without Infrastructure. Drones 2022, 6, 173. [Google Scholar] [CrossRef]
- Ghazali, M.H.M.; Teoh, K.; Rahiman, W. A Systematic Review of Real-Time Deployments of UAV-Based LoRa Communication Network. IEEE Access 2021, 9, 124817–124830. [Google Scholar] [CrossRef]
- Adil, M.; Song, H.; Jan, M.A.; Khan, M.K.; He, X.; Farouk, A.; Jin, Z. UAV-Assisted IoT Applications, QoS Requirements and Challenges with Future Research Directions. ACM Comput. Surv. 2024, 56, 1–35. [Google Scholar] [CrossRef]
- Pan, M.; Chen, C.; Yin, X.; Huang, Z. UAV-Aided Emergency Environmental Monitoring in Infrastructure-Less Areas: LoRa Mesh Networking Approach. IEEE Internet Things J. 2021, 9, 2918–2932. [Google Scholar] [CrossRef]
- Rojo-García, J.I.; Vera-Chavarría, S.A.; Lozano-Hernández, Y.; Sánchez-Meza, V.G.; González-Sierra, J.; Oliva-Moreno, L.N. Data Collection in Areas without Infrastructure Using LoRa Technology and a Quadrotor. Futur. Internet 2024, 16, 186. [Google Scholar] [CrossRef]
- Arroyo, P.; Herrero, J.L.; Lozano, J.; Montero, P. Integrating LoRa-Based Communications into Unmanned Aerial Vehicles for Data Acquisition from Terrestrial Beacons. Electronics 2022, 11, 1865. [Google Scholar] [CrossRef]
- Sobhi, S.; Elzanaty, A.; Selim, M.Y.; Ghuniem, A.M.; Abdelkader, M.F. Mobility of LoRaWAN Gateways for Efficient Environmental Monitoring in Pristine Sites. Sensors 2023, 23, 1698. [Google Scholar] [CrossRef] [PubMed]
- Chen, L.-Y.; Huang, H.-S.; Wu, C.-J.; Tsai, Y.-T.; Chang, Y.-S. A LoRa-Based Air Quality Monitor on Unmanned Aerial Vehicle forSmart City. In Proceedings of the 2018 International Conference on System Science and Engineering (ICSSE), New Taipei, Taiwan, 28–30 June 2018; pp. 1–5. [Google Scholar]
- Behjati, M.; Noh, A.B.M.; Alobaidy, H.A.H.; Zulkifley, M.A.; Nordin, R.; Abdullah, N.F. LoRa Communications as an Enabler for Internet of Drones towards Large-Scale Livestock Monitoring in Rural Farms. Sensors 2021, 21, 5044. [Google Scholar] [CrossRef] [PubMed]
- Mujumdar, O.; Celebi, H.; Guvenc, I.; Sichitiu, M.; Hwang, S.; Kang, K.-M. Use of LoRa for UAV remote ID with multi-user interference and different spreading factors. In Proceedings of the 2021 IEEE 93rd Vehicular Technology Conference (VTC2021-Spring), Virtual, 25 April–19 May 2021. [Google Scholar]
- Zhao, T. Development of Wind Speed and Direction Sensor Based on Ultrasonic. Master’s Thesis, Northeast Electric Power University, Jilin, China, 2023. [Google Scholar]
- Li, Y.; Yang, J.; Wang, J. DyLoRa: Towards energy efficient dynamic LoRa transmission control. In Proceedings of the IEEE INFOCOM 2020-IEEE Conference on Computer Communications, Toronto, ON, Canada, 6–9 July 2020. [Google Scholar]
- Adoni, W.Y.H.; Lorenz, S.; Fareedh, J.S.; Gloaguen, R.; Bussmann, M. Investigation of Autonomous Multi-UAV Systems for Target Detection in Distributed Environment: Current Developments and Open Challenges. Drones 2023, 7, 263. [Google Scholar] [CrossRef]
- Cui, G.; Xu, Y.; Zhang, S.; Wang, W. Secure data offloading strategy for multi-UAV wireless networks based on minimum energy consumption. J. Commun. 2021, 42, 51–62. [Google Scholar]
- Tu, L.-T.; Bradai, A.; Ben Ahmed, O.; Garg, S.; Pousset, Y.; Kaddoum, G. Energy Efficiency Optimization in LoRa Networks—A Deep Learning Approach. IEEE Trans. Intell. Transp. Syst. 2022, 24, 15435–15447. [Google Scholar] [CrossRef]
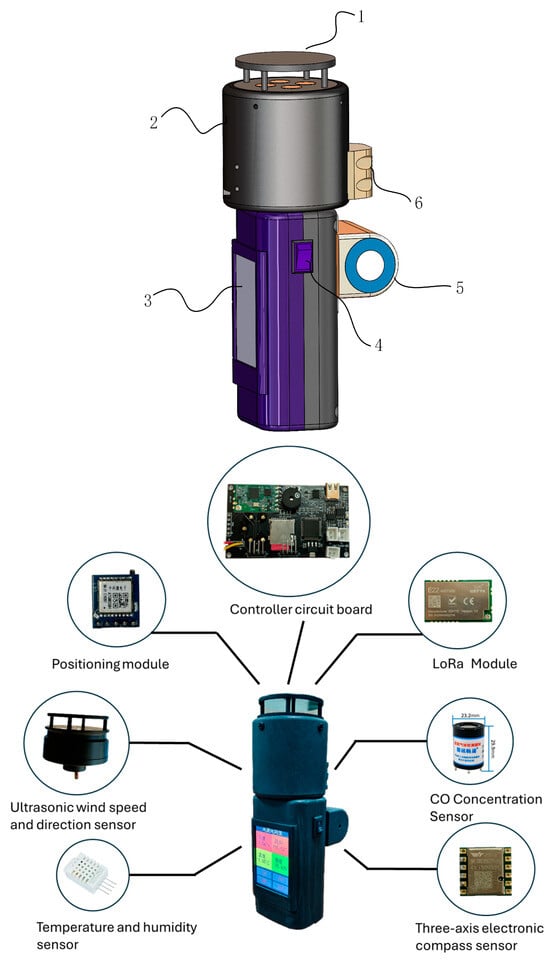
Structure diagram of the portable environmental monitoring device. 1. Ultrasonic wind speed and direction sensor. 2. Device enclosure 3. OLED display. 4. Switch. 5. Carbon monoxide concentration sensor. 6. Temperature and humidity sensor.
Figure 1.
Structure diagram of the portable environmental monitoring device. 1. Ultrasonic wind speed and direction sensor. 2. Device enclosure 3. OLED display. 4. Switch. 5. Carbon monoxide concentration sensor. 6. Temperature and humidity sensor.
Schematic diagram of the device.
Figure 2.
Schematic diagram of the device.
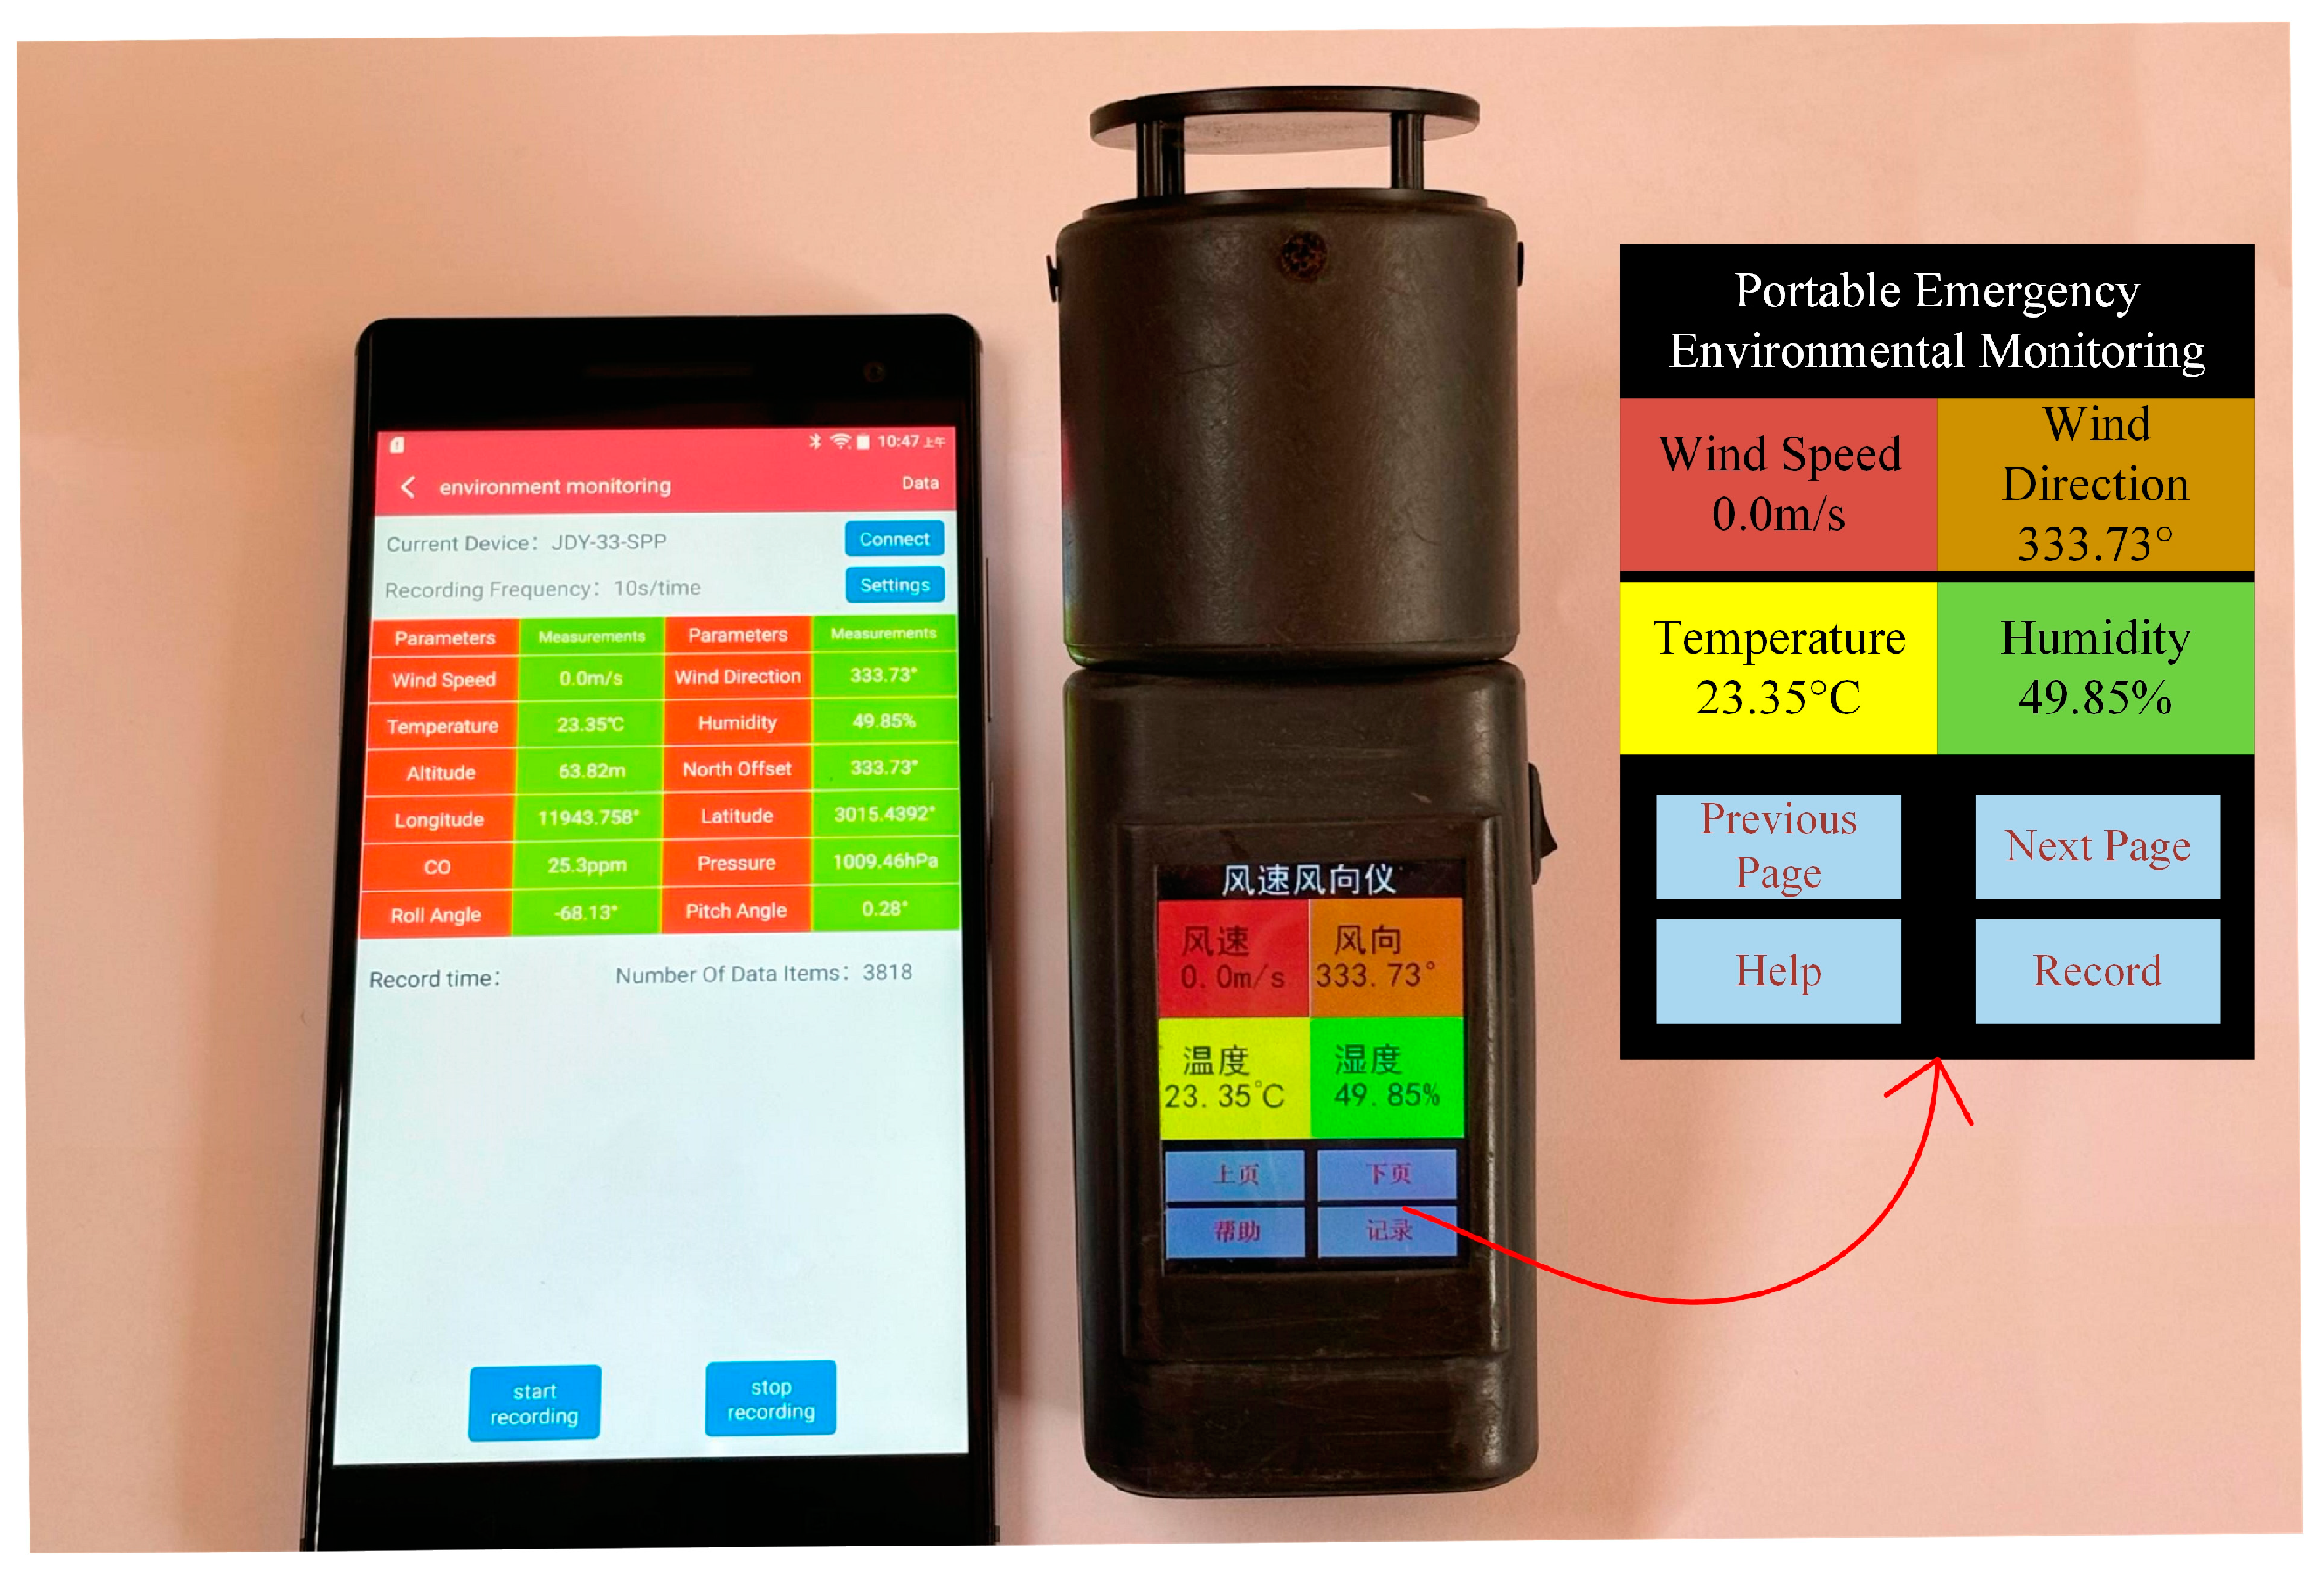
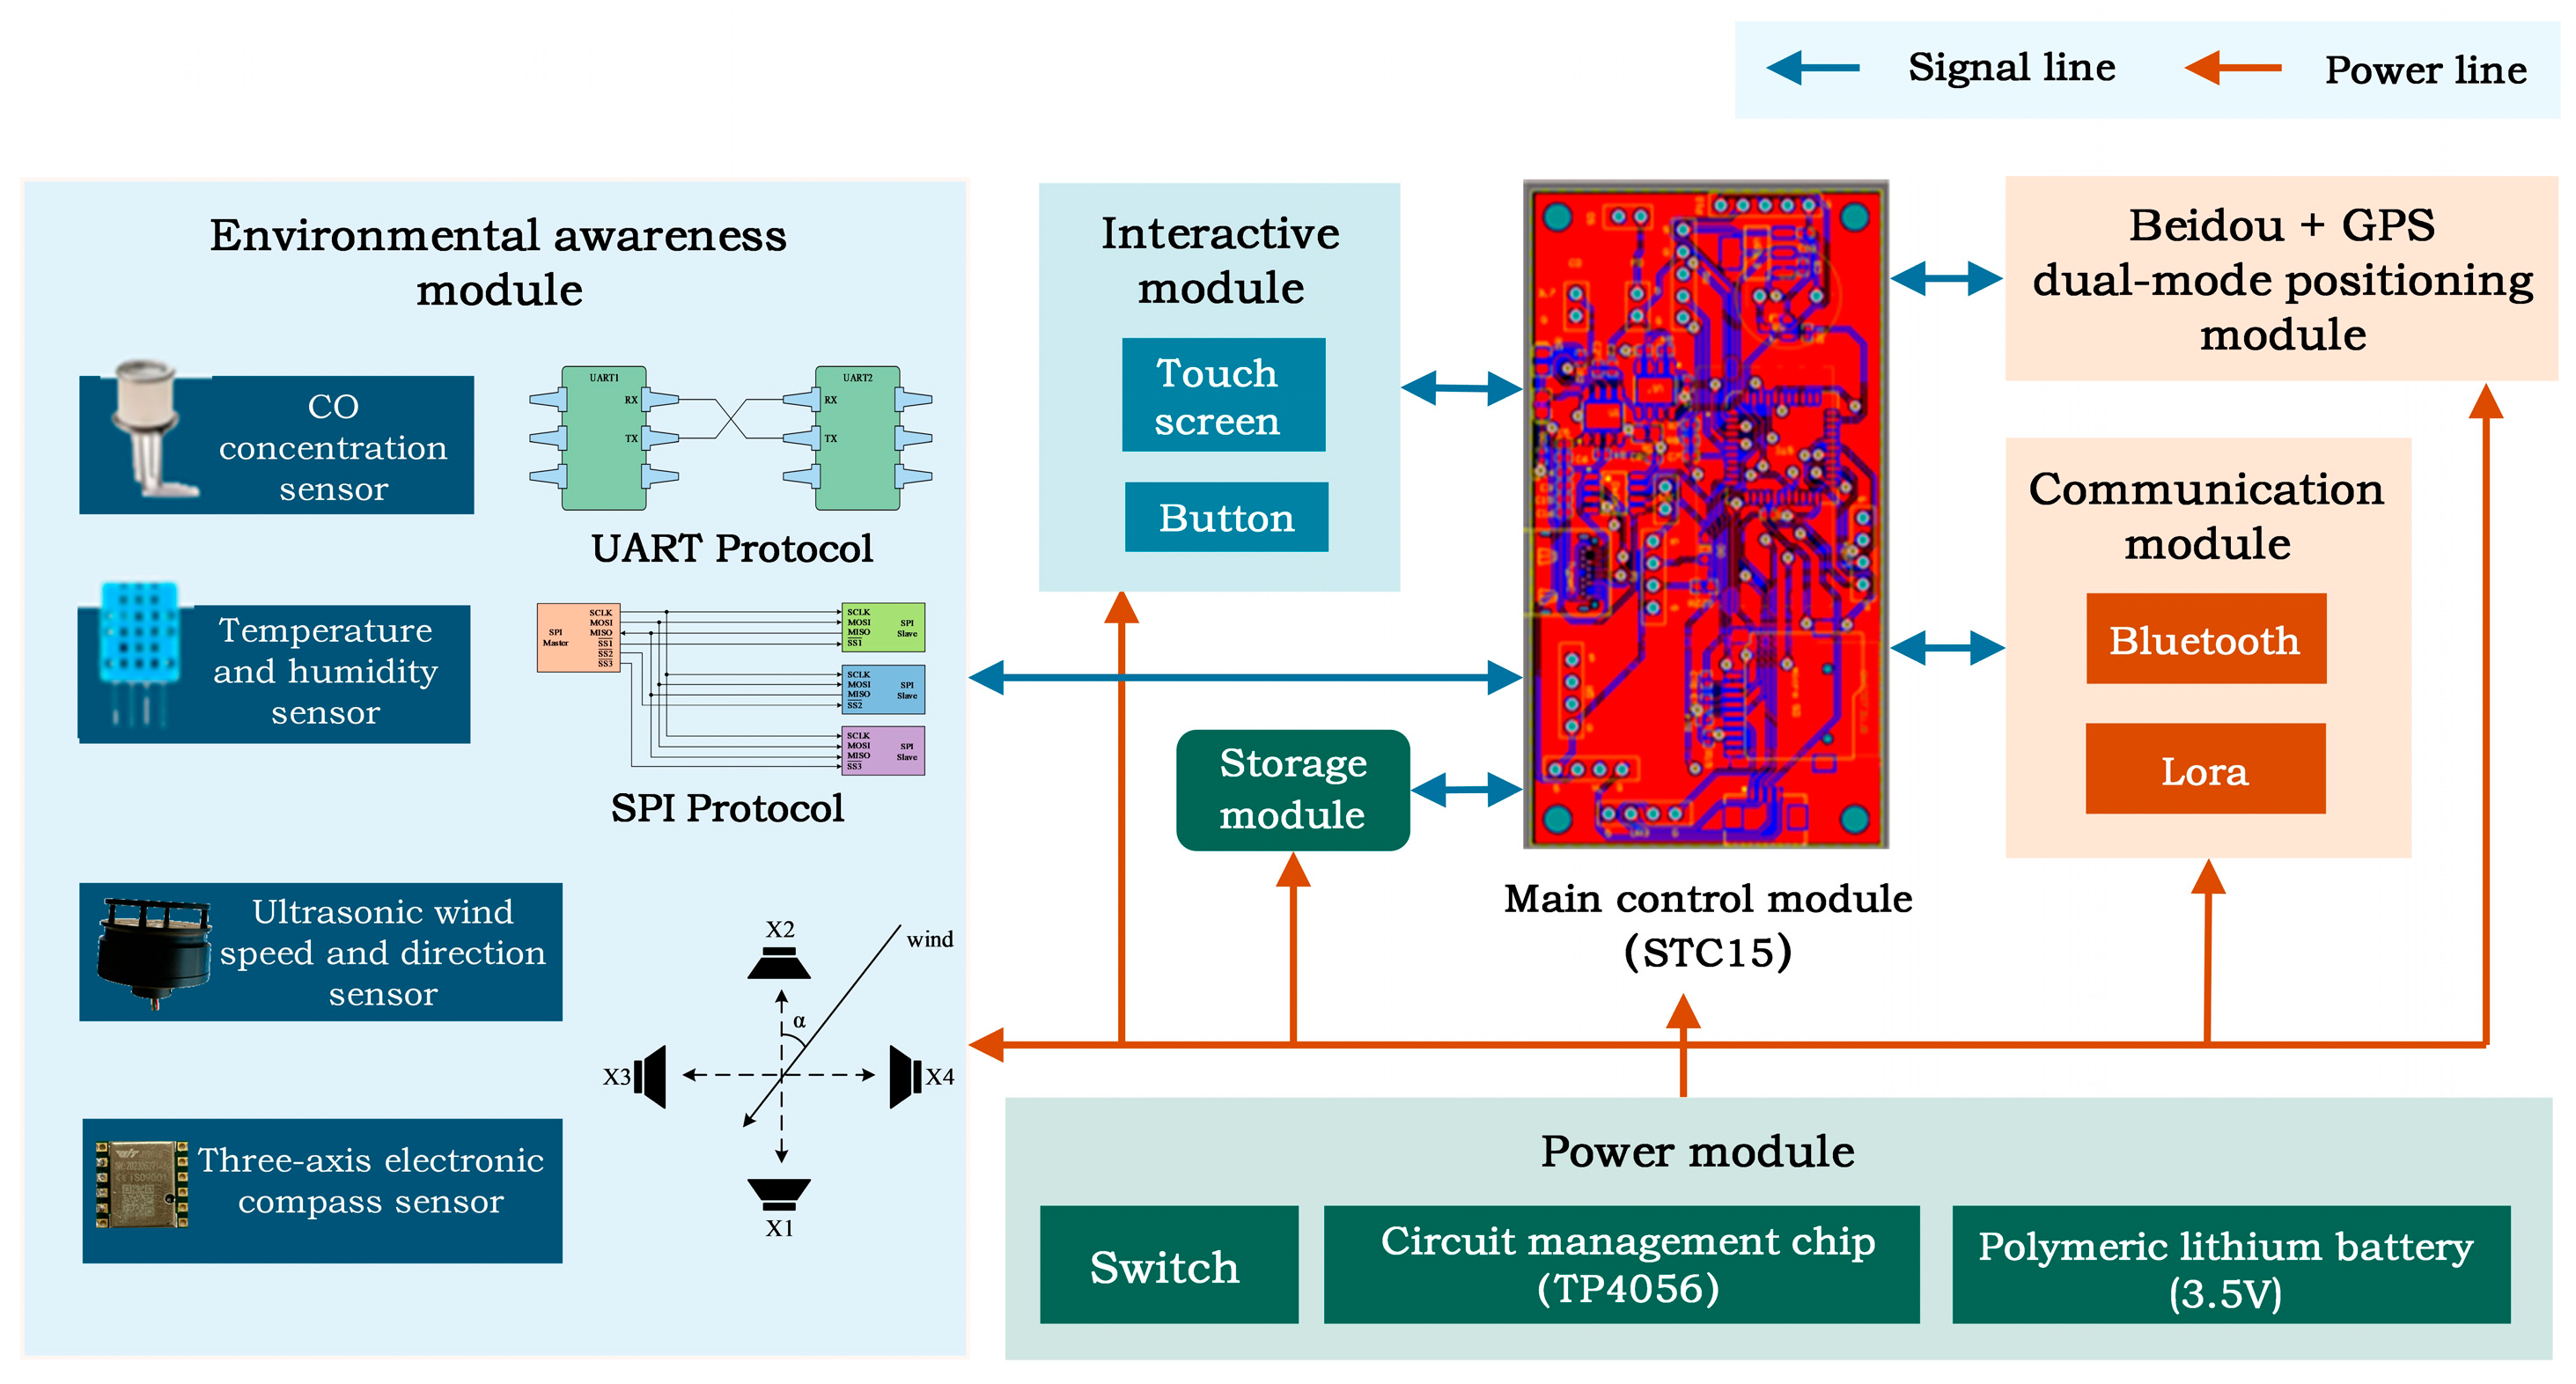
Circuit framework diagram of the portable environmental monitoring device.
Figure 3.
Circuit framework diagram of the portable environmental monitoring device.
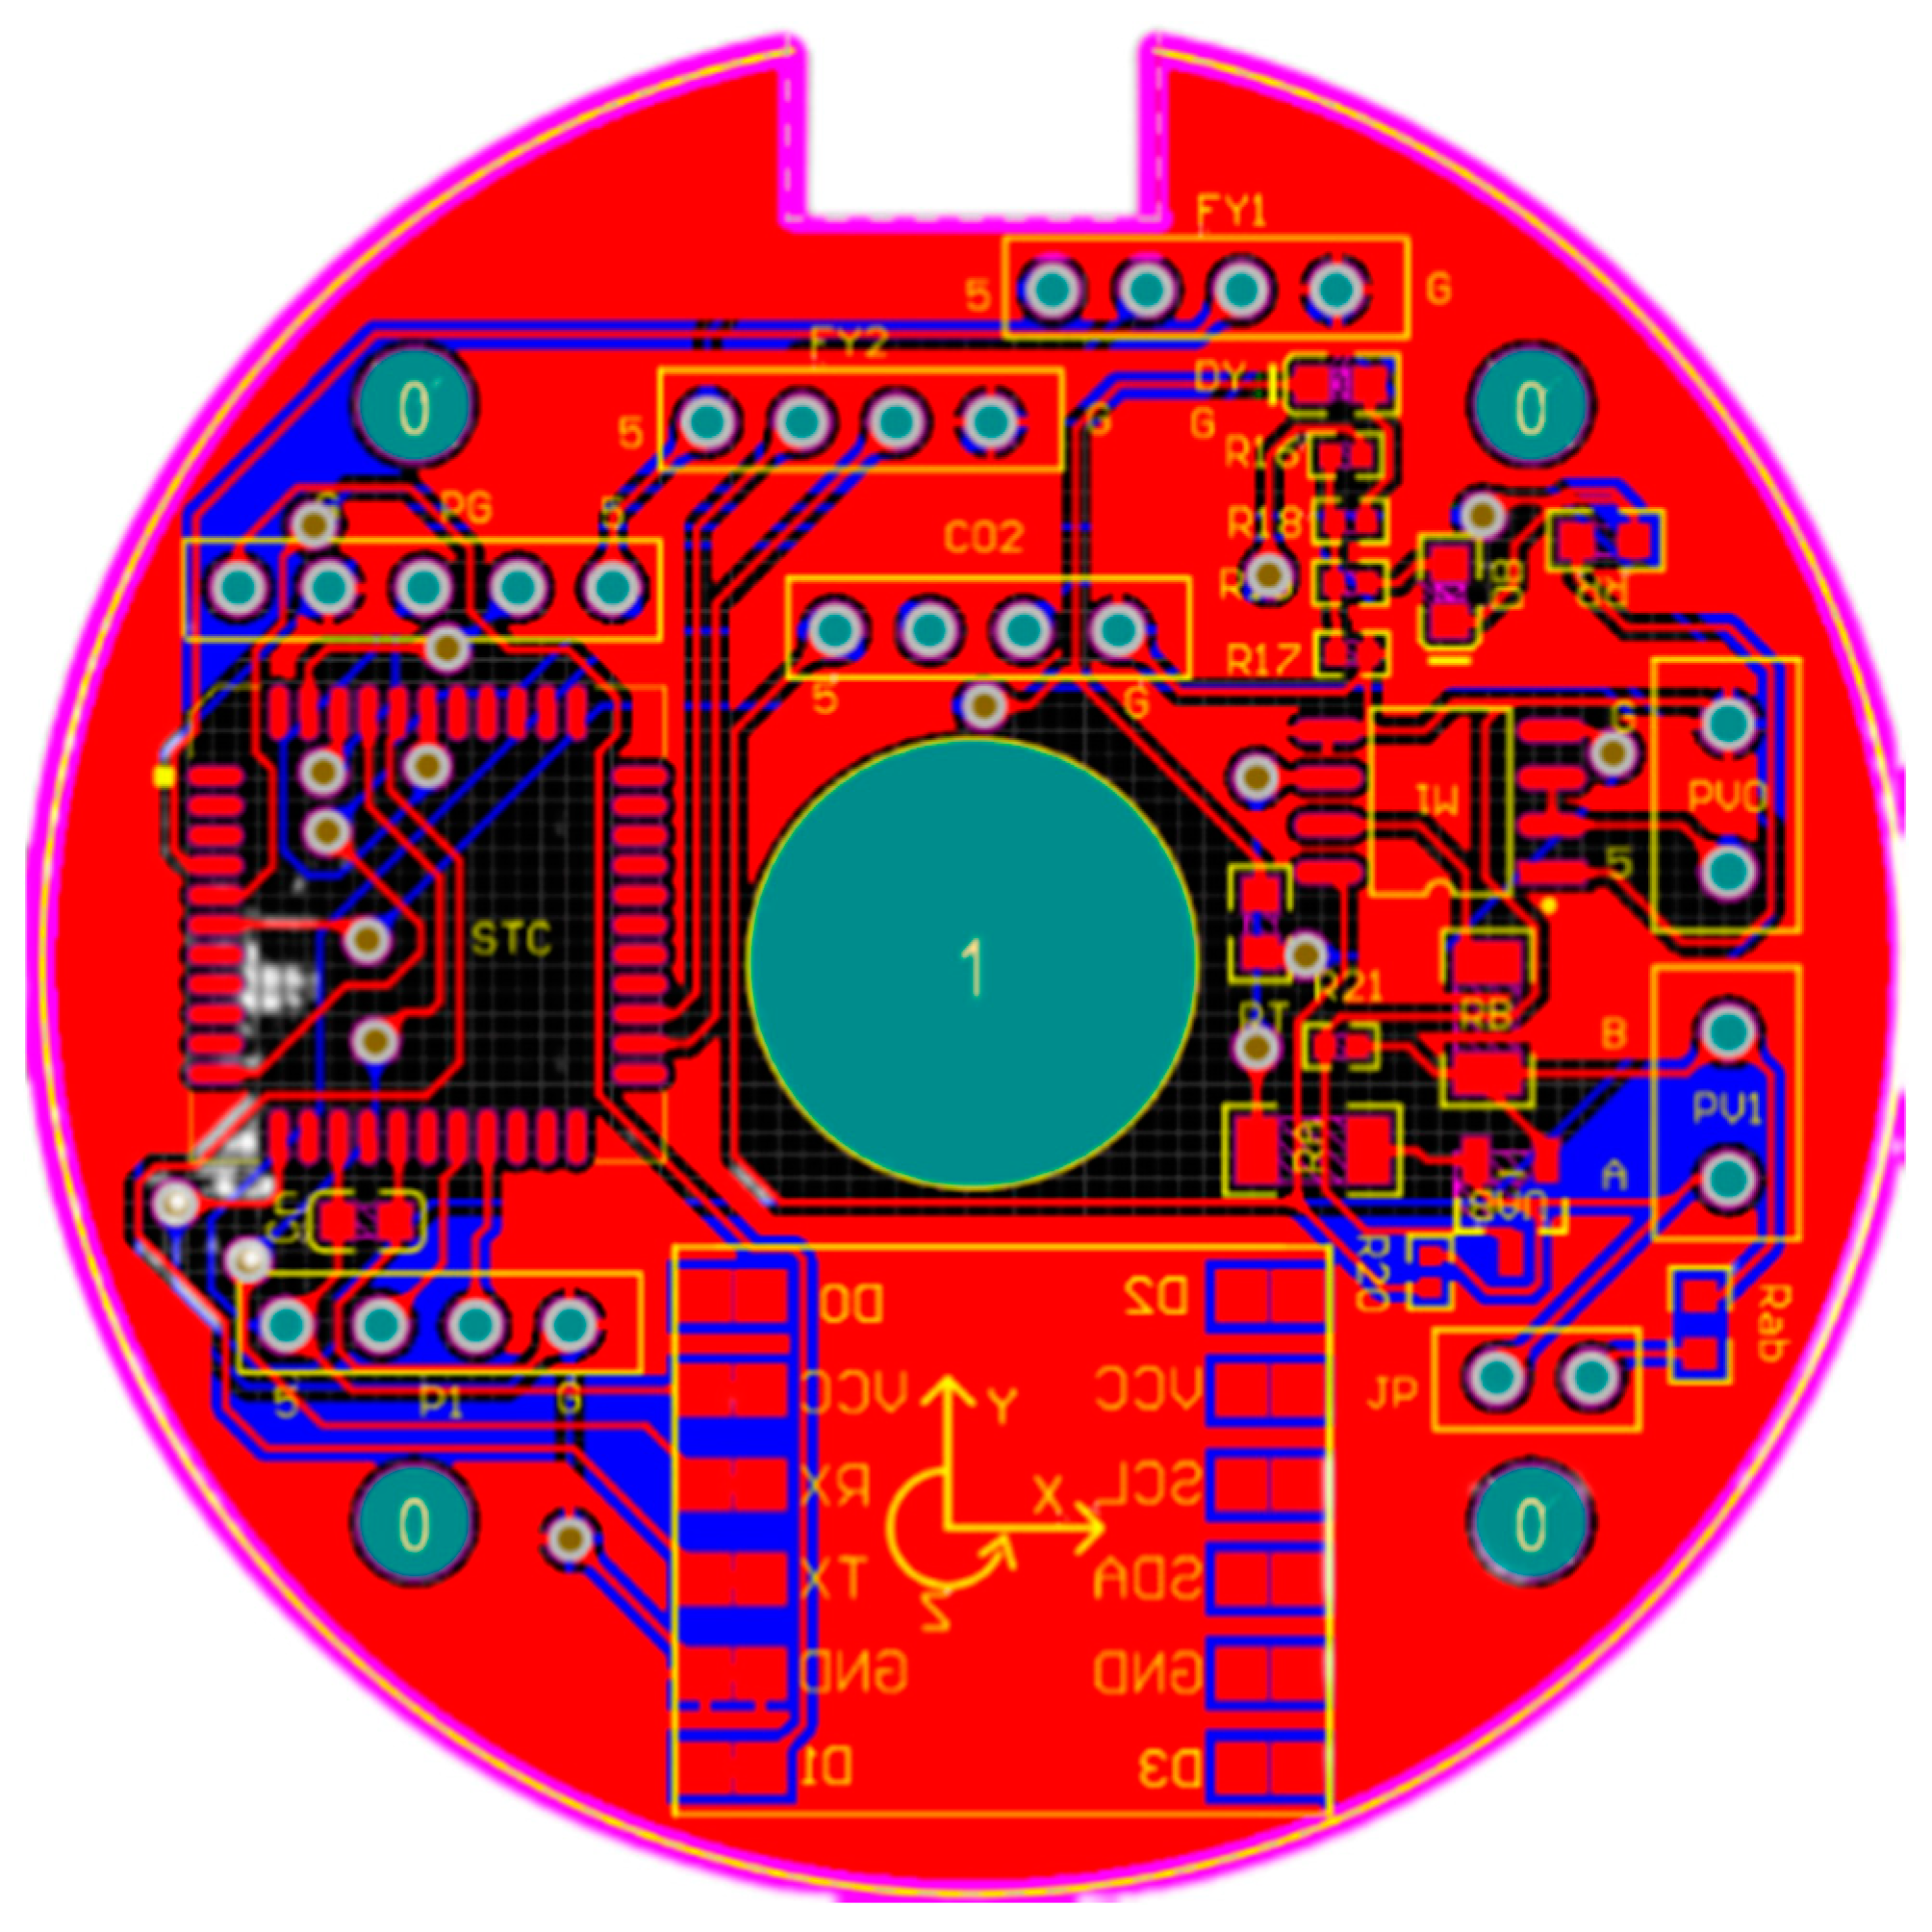
PCB of the portable emergency environmental monitoring device.
Figure 4.
PCB of the portable emergency environmental monitoring device.
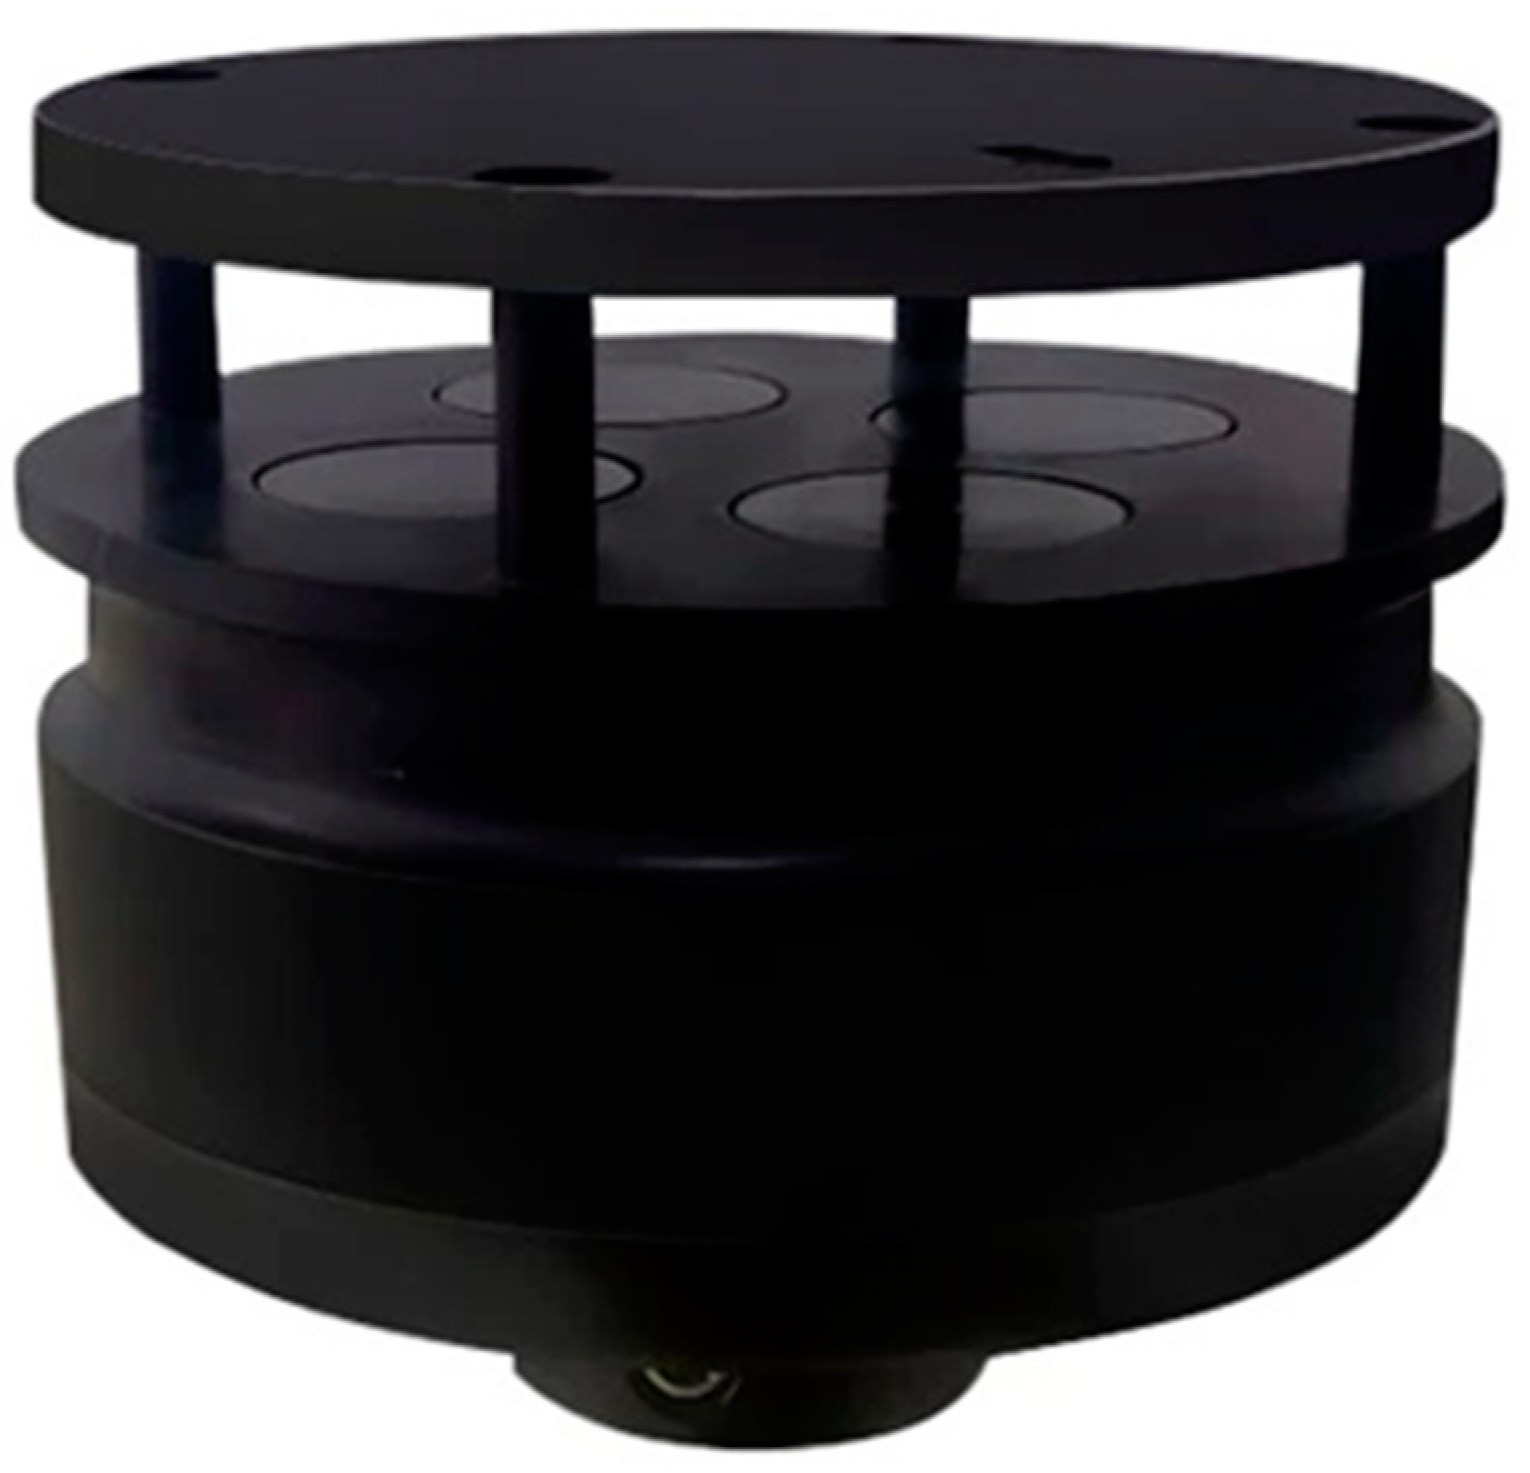
Structure of the ultrasonic wind speed and direction sensor.
Figure 5.
Structure of the ultrasonic wind speed and direction sensor.
Time difference measurement principle diagram. X1, X2, X3 and X4: The physical locations of four ultrasonic transducers, used to measure the propagation time difference of ultrasonic waves under the influence of airflow. α: The angle of airflow passing through the sensor, used to determine the wind direction.
Figure 6.
Time difference measurement principle diagram. X1, X2, X3 and X4: The physical locations of four ultrasonic transducers, used to measure the propagation time difference of ultrasonic waves under the influence of airflow. α: The angle of airflow passing through the sensor, used to determine the wind direction.
The system data interaction sequence diagram.
Figure 7.
The system data interaction sequence diagram.
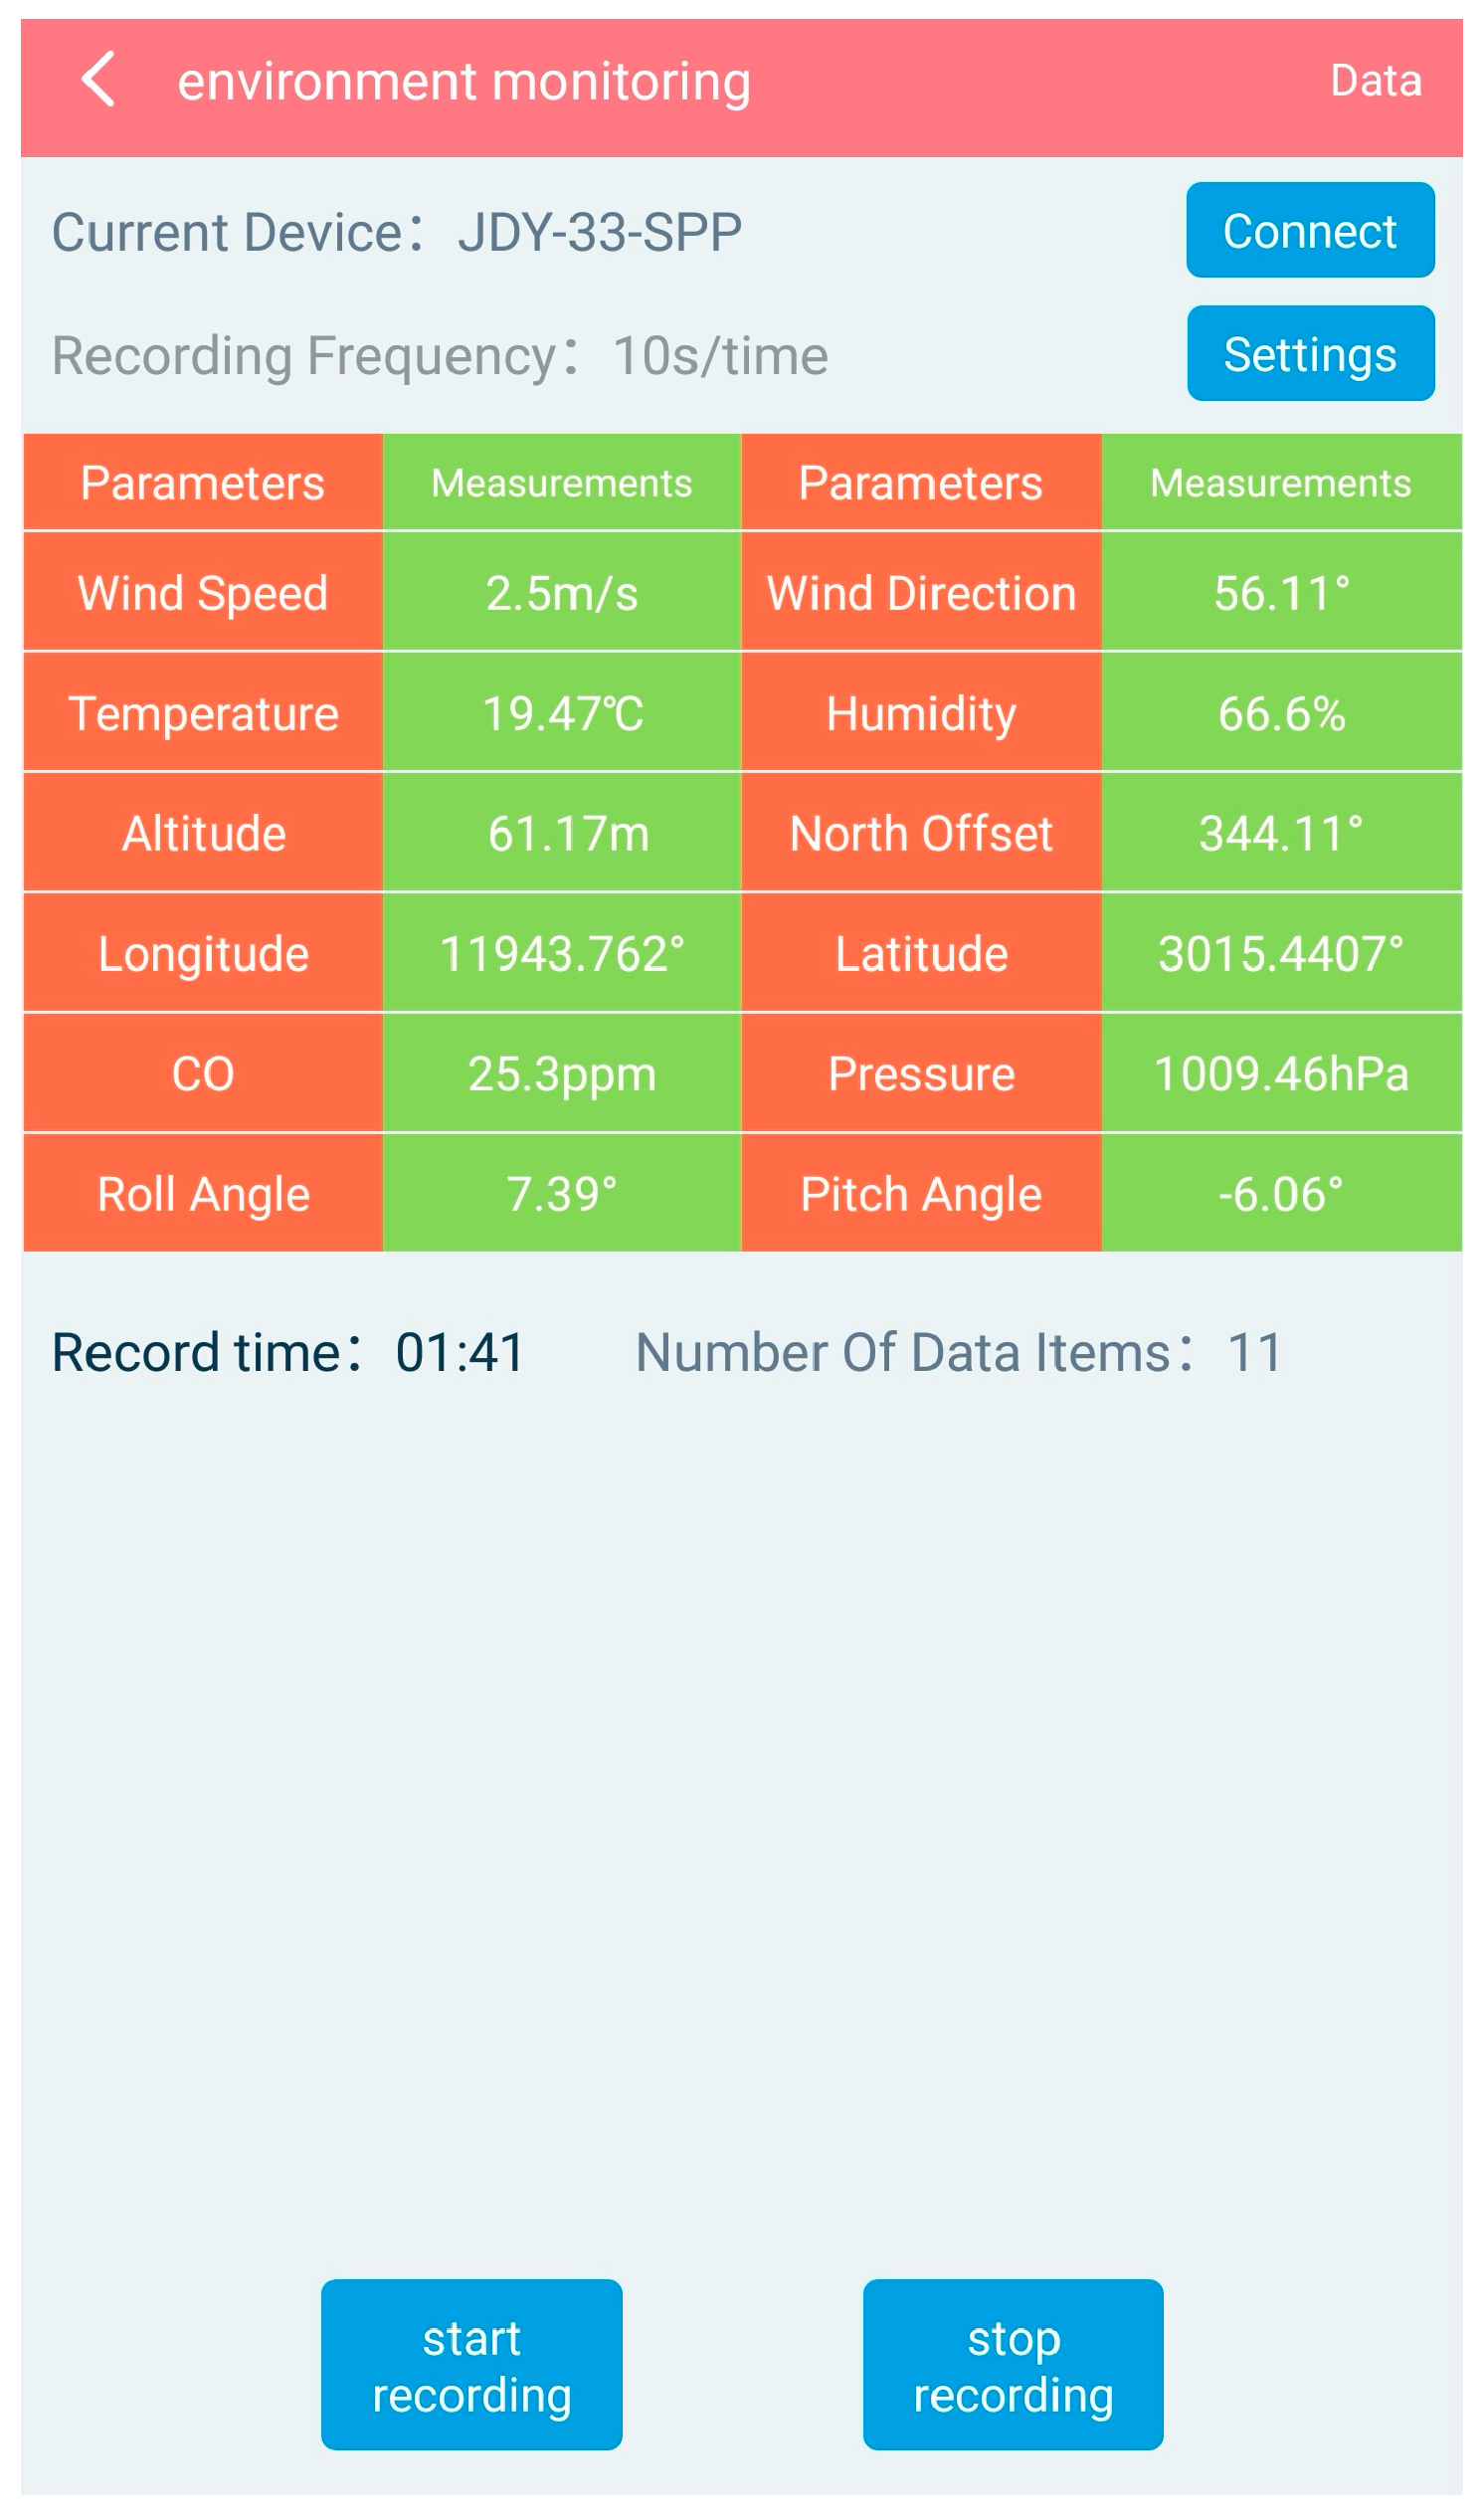
Upper machine software interface.
Figure 8.
Upper machine software interface.
The application scenario diagram of the UAV-mounted LoRa gateway.
Figure 9.
The application scenario diagram of the UAV-mounted LoRa gateway.
Comparison Diagram of Devices. (a) Meteorological station a was fixed at the experimental site; (b) Meteorological station b was fixed at the experimental site.
Figure 10.
Comparison Diagram of Devices. (a) Meteorological station a was fixed at the experimental site; (b) Meteorological station b was fixed at the experimental site.
LoRa Ground Communication Distance Test. (a) maximum communication distance; (b) maximum communication distance in an open environment.
Figure 11.
LoRa Ground Communication Distance Test. (a) maximum communication distance; (b) maximum communication distance in an open environment.
UAV-to-Ground Communication Distance Test. (a) LoRa gateway and antenna were mounted on the UAV; (b) maximum communication distance.
Figure 12.
UAV-to-Ground Communication Distance Test. (a) LoRa gateway and antenna were mounted on the UAV; (b) maximum communication distance.
Signal transmission quality at different flight altitudes.
Figure 13.
Signal transmission quality at different flight altitudes.
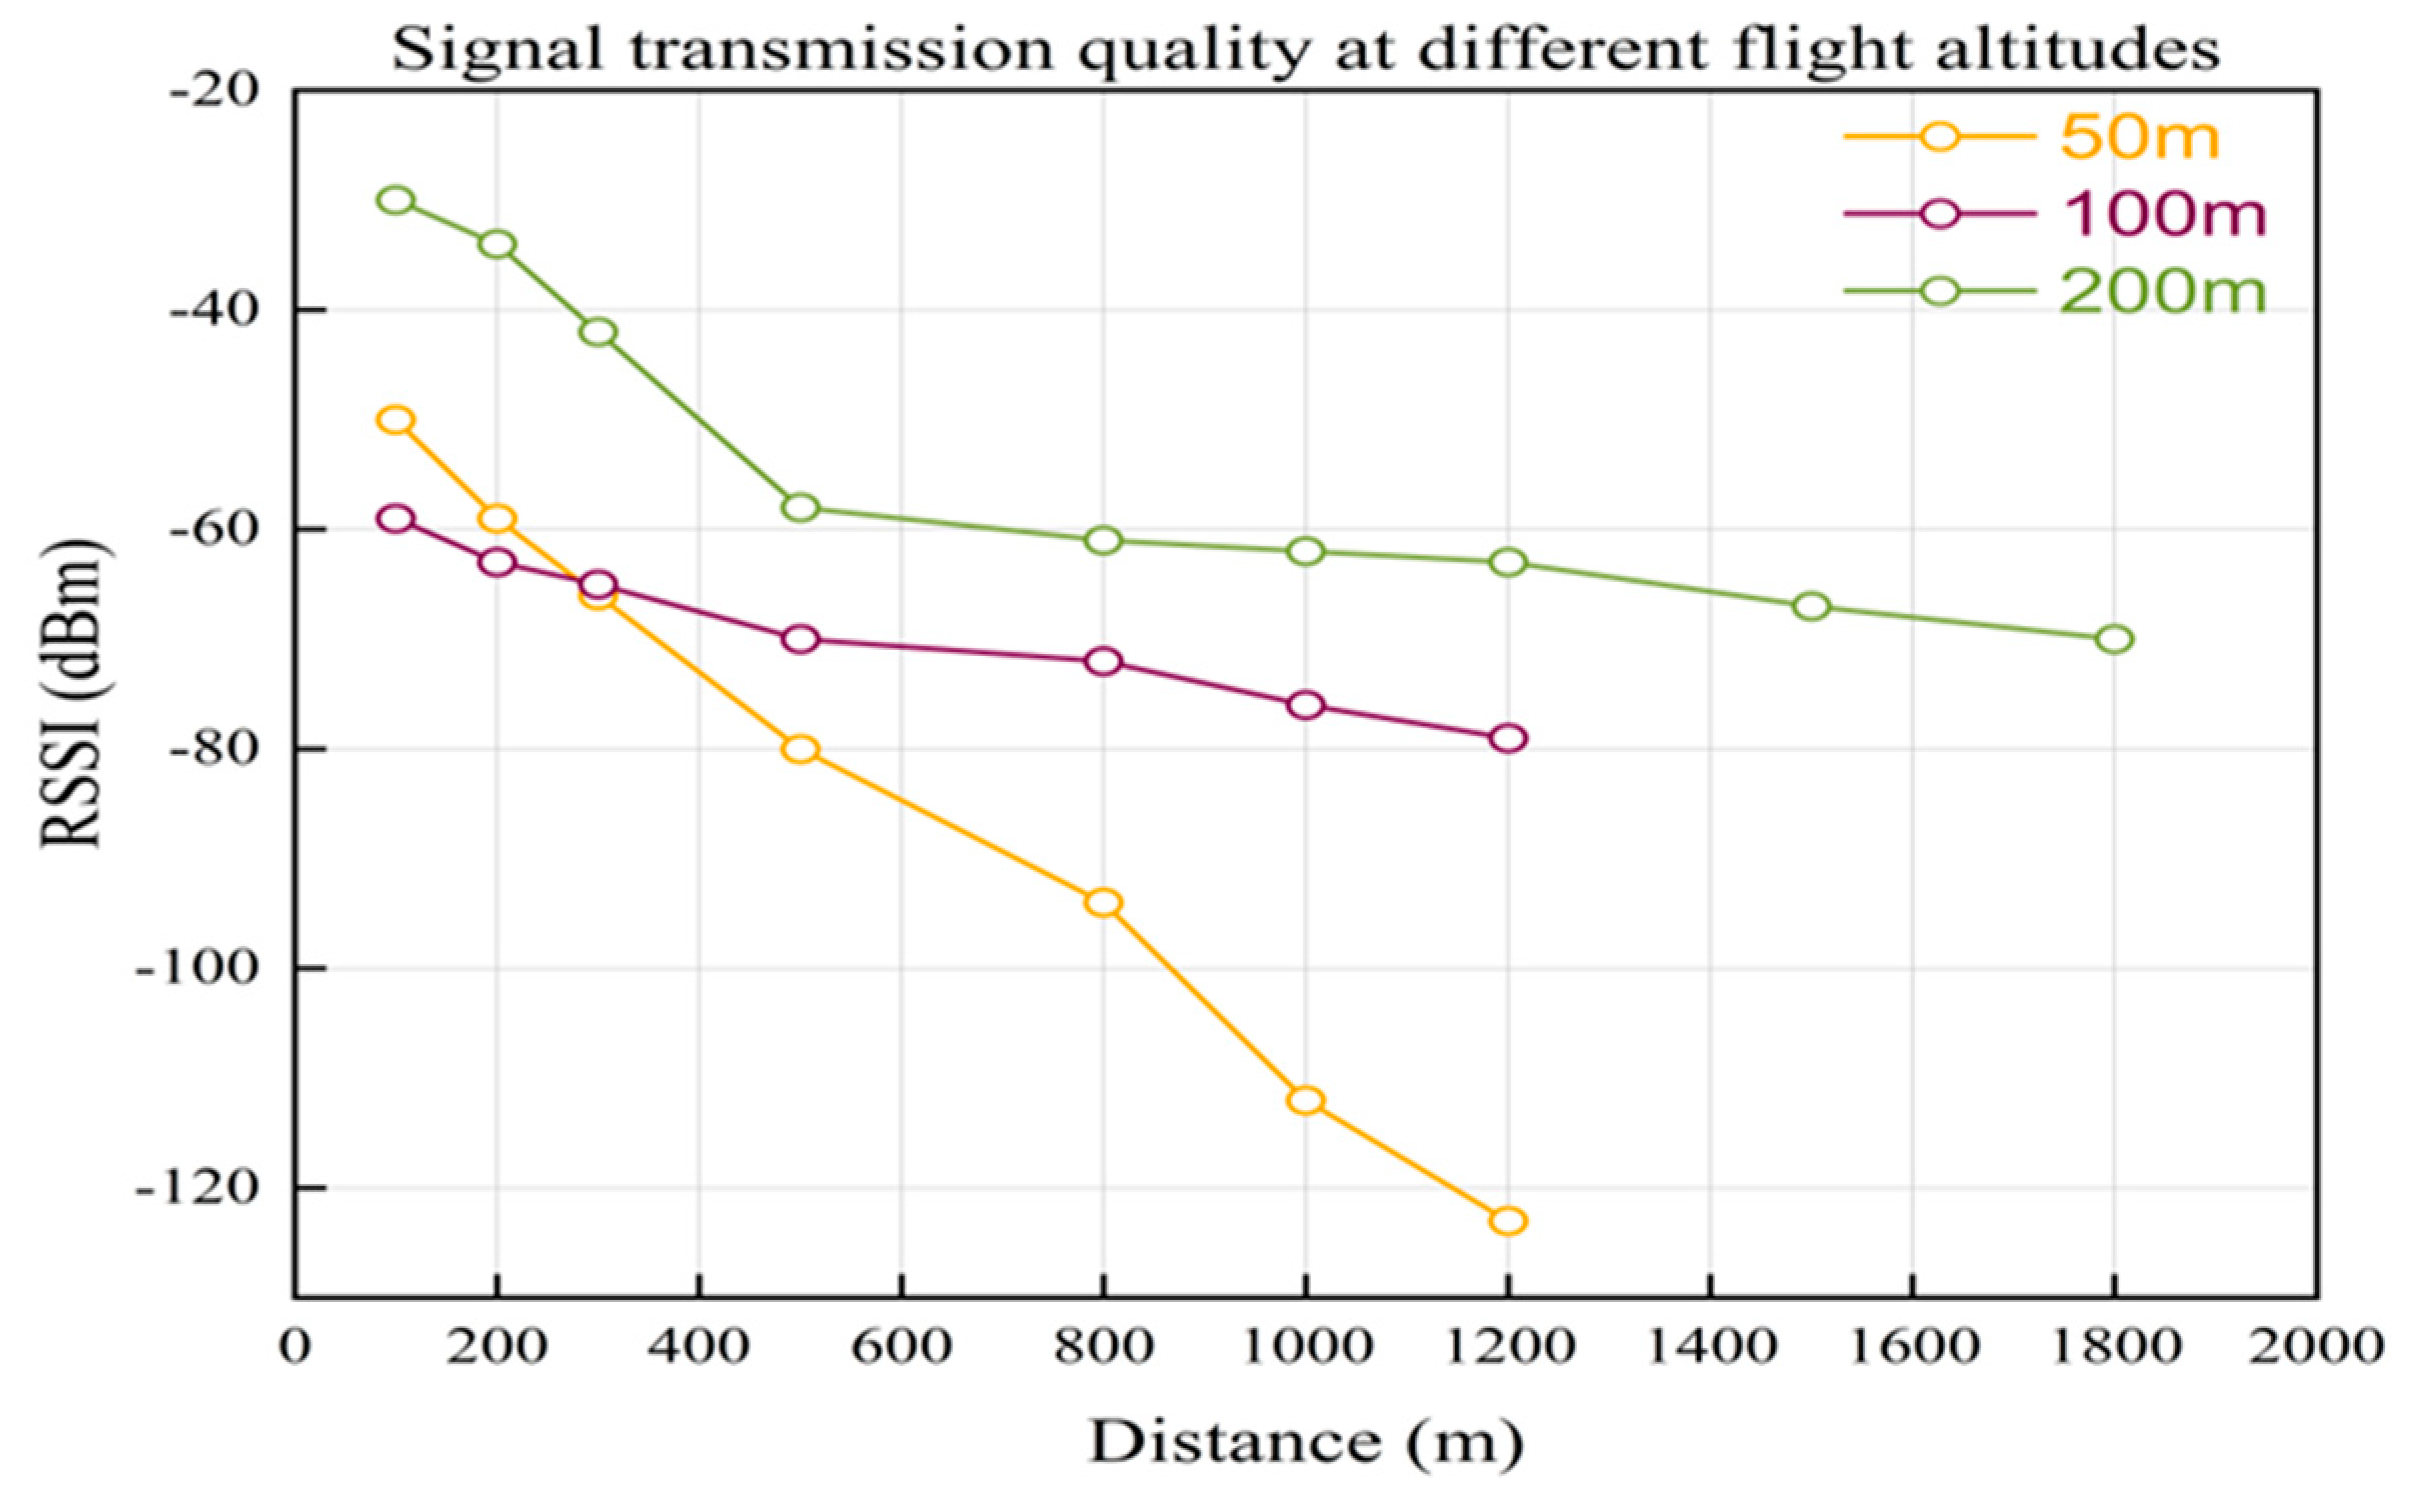
Table 1.
Comparison of performance metrics for common wireless communication technologies.
Table 1.
Comparison of performance metrics for common wireless communication technologies.
| Communication Technology | Transmission Rate | Transmission Distance | Power Consumption |
|---|---|---|---|
| LoRa | 0.3–62.5 kbps | 5–15 km | Low |
| ZigBee | 250 kbps (Maximum) | 10–1000 m | Low |
| WiFi | 11–54 Mbps (Maximum) | 10–100 m | High |
| Bluetooth | 1–2 Mpbs (Maximum) | 10 m (Approximately) | Low |
Table 2.
Comparison of measurement accuracy between different devices.
Table 2.
Comparison of measurement accuracy between different devices.
| Environmental Factors | Handheld Meteorological Instrument | Ultrasonic Integrated Meteorological Station | ||||
|---|---|---|---|---|---|---|
| MAE | MSE | RMSE | MAE | MSE | RMSE | |
| Temperature | 0.3745 | 0.3111 | 0.5578 | 0.3482 | 0.3054 | 0.5526 |
| Humidity | 3.3228 | 12.6183 | 3.5522 | 2.8532 | 9.6581 | 3.1077 |
| Wind Speed | 0.3066 | 0.1755 | 0.4189 | 0.2845 | 0.1657 | 0.4071 |
| Wind Direction | 6.6990 | 63.7143 | 7.9821 | 5.1468 | 50.6218 | 7.1149 |
Disclaimer/Publisher’s Note: The statements, opinions and data contained in all publications are solely those of the individual author(s) and contributor(s) and not of MDPI and/or the editor(s). MDPI and/or the editor(s) disclaim responsibility for any injury to people or property resulting from any ideas, methods, instructions or products referred to in the content. |
Source link
Chaowen Li www.mdpi.com

