
1. Introduction
2. Monitoring Concept
In this section, we describe our monitoring approach and its implementation in the key distribution scenario. The legitimate users Alice and Bob perform a procedure to monitor the current state of the fiber between key distribution sessions. As a result of the monitoring procedure, they extract additional information about possible intrusions. This could be the probability of Eve’s presence, a number of leaks exceeding a threshold, or a single most valuable leak on the line, whatever a control-based key distribution protocol requires. These monitoring estimates can be used in the post-selection and privacy amplification phases to refine the bounds on Eve’s information, leading to adjustments in the key rate or termination of transmission.
2.1. OTDR Operation
2.2. Data Processing
where the vector y is the original data and x is a vector of weights constrained by regularization with the hyperparameter . In our problem, the matrix A has the form
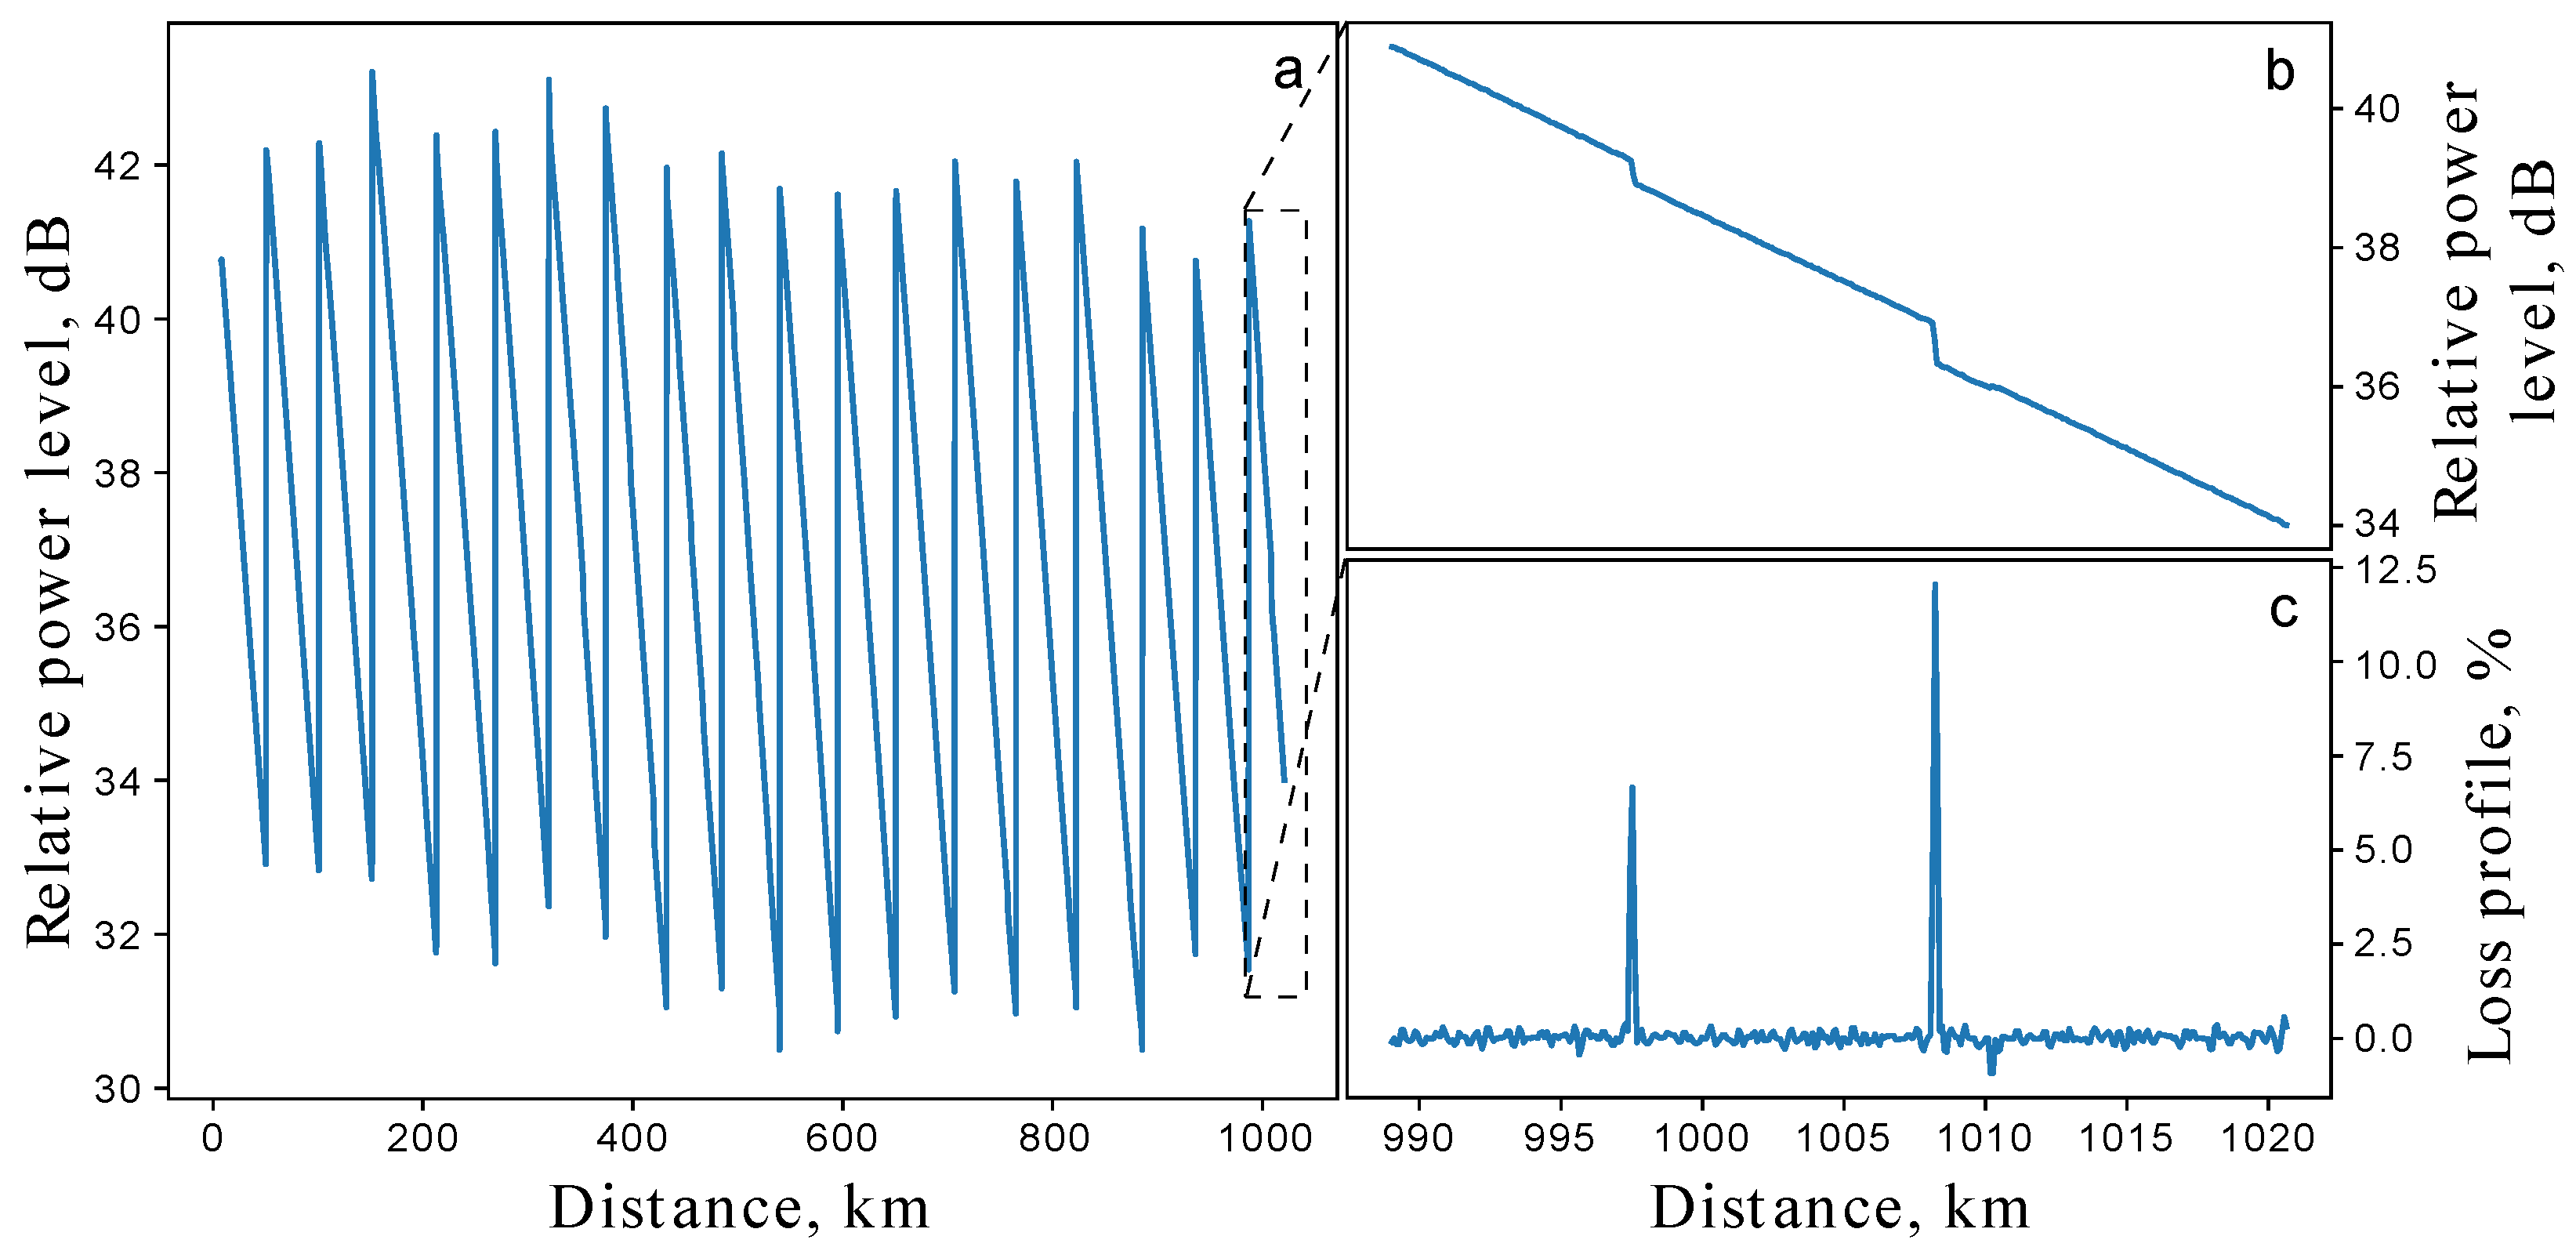
where is chosen to deal with boundary effects of the discretization and denotes the general slope of the reflectogram. A loss map is a derivative-like plot that represents a series of peaks corresponding to stepwise losses in a trace. Using the peak detection method, we extract numerical evaluations of local leaks from the loss map and collect statistics. An example of a loss map is shown in Figure 2c.
3. Leakage Detection
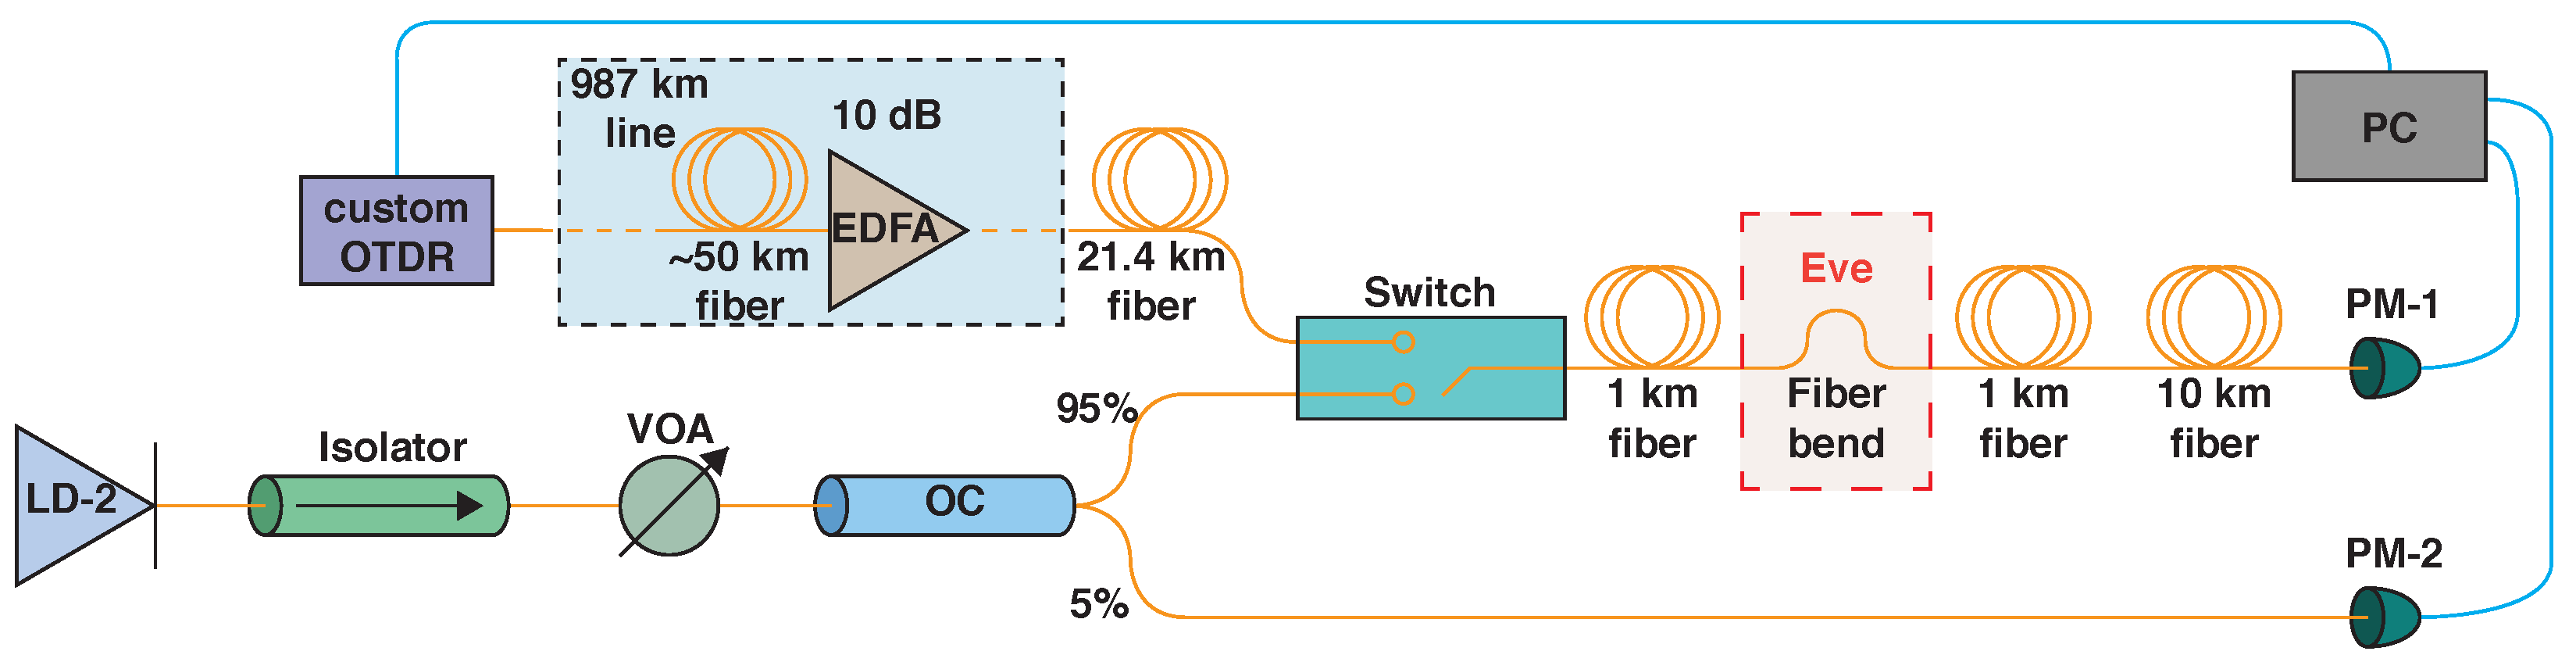
In this section, we will demonstrate the limitations of OTDR-based monitoring on a long-haul transmission line. We use the same 1020 km fiber optic line. To detect a test leak at a point approximately 1009 km away, we modify the optical line by inserting an additional 2 km of fiber with access to its center. This is performed to have a separate test point that is far enough away from fiber connections or other events. We also measure this leakage independently using a direct measurement optical circuit. The most common, widely used, and easy-to-implement method for creating localized leakage is to bend the fiber. This is a very versatile approach because it can create losses ranging from fractions of a percent to those that result in almost complete cessation of light transmission. It is also a non-invasive method, there is no need to remove a protective polymer coating, and the optical fiber is not damaged between experiments. To implement this technique, we use semicircular grooves of different diameters to achieve a manageable change in loss.
The switch toggles between the transmission coefficient measurement mode and the OTDR mode. A highly stable CWDM DFB laser diode (LD-2) with a central wavelength of 1533.1 nm and a bandwidth of approximately 1 MHz is used as the continuous light source. The variable optical attenuator (VOA) is installed to reduce optical power to 1 mW to prevent the development of stray Brillouin scattering in the optical fiber.
Two power meters (PM-1,2) are installed at the end of the line and at the lower connection of the 95/5 coupler (OC). When the switch is in transmission mode, data from both power meters are recorded. The resulting transmission loss coefficient is naturally calculated as , where denotes averaging over a time interval s.
During the OTDR stage, measurements are made with a probing pulse duration of 1 μs and averaging over approximately pulses. Each measurement takes about 3 min. The reflectometric loss coefficient is taken from the resulting loss map as a peak value near the detected loss position and converted from the dB scale to the linear scale. It can then be further compared with .
4. Results
4.1. Detection Without Reference
To be consistent with the introduced value of , which is not treated as a local lost fraction but as a lost fraction of the initial transmission, we should renormalize to the input pulse energy. With a ratio of 5.1 dB between the input energy and the current energy, we obtain . This operation can only be performed if the location of the leakage is known, e.g., by an OTDR approach in our case.
4.2. Detection with Reference
4.3. Temporal Stability
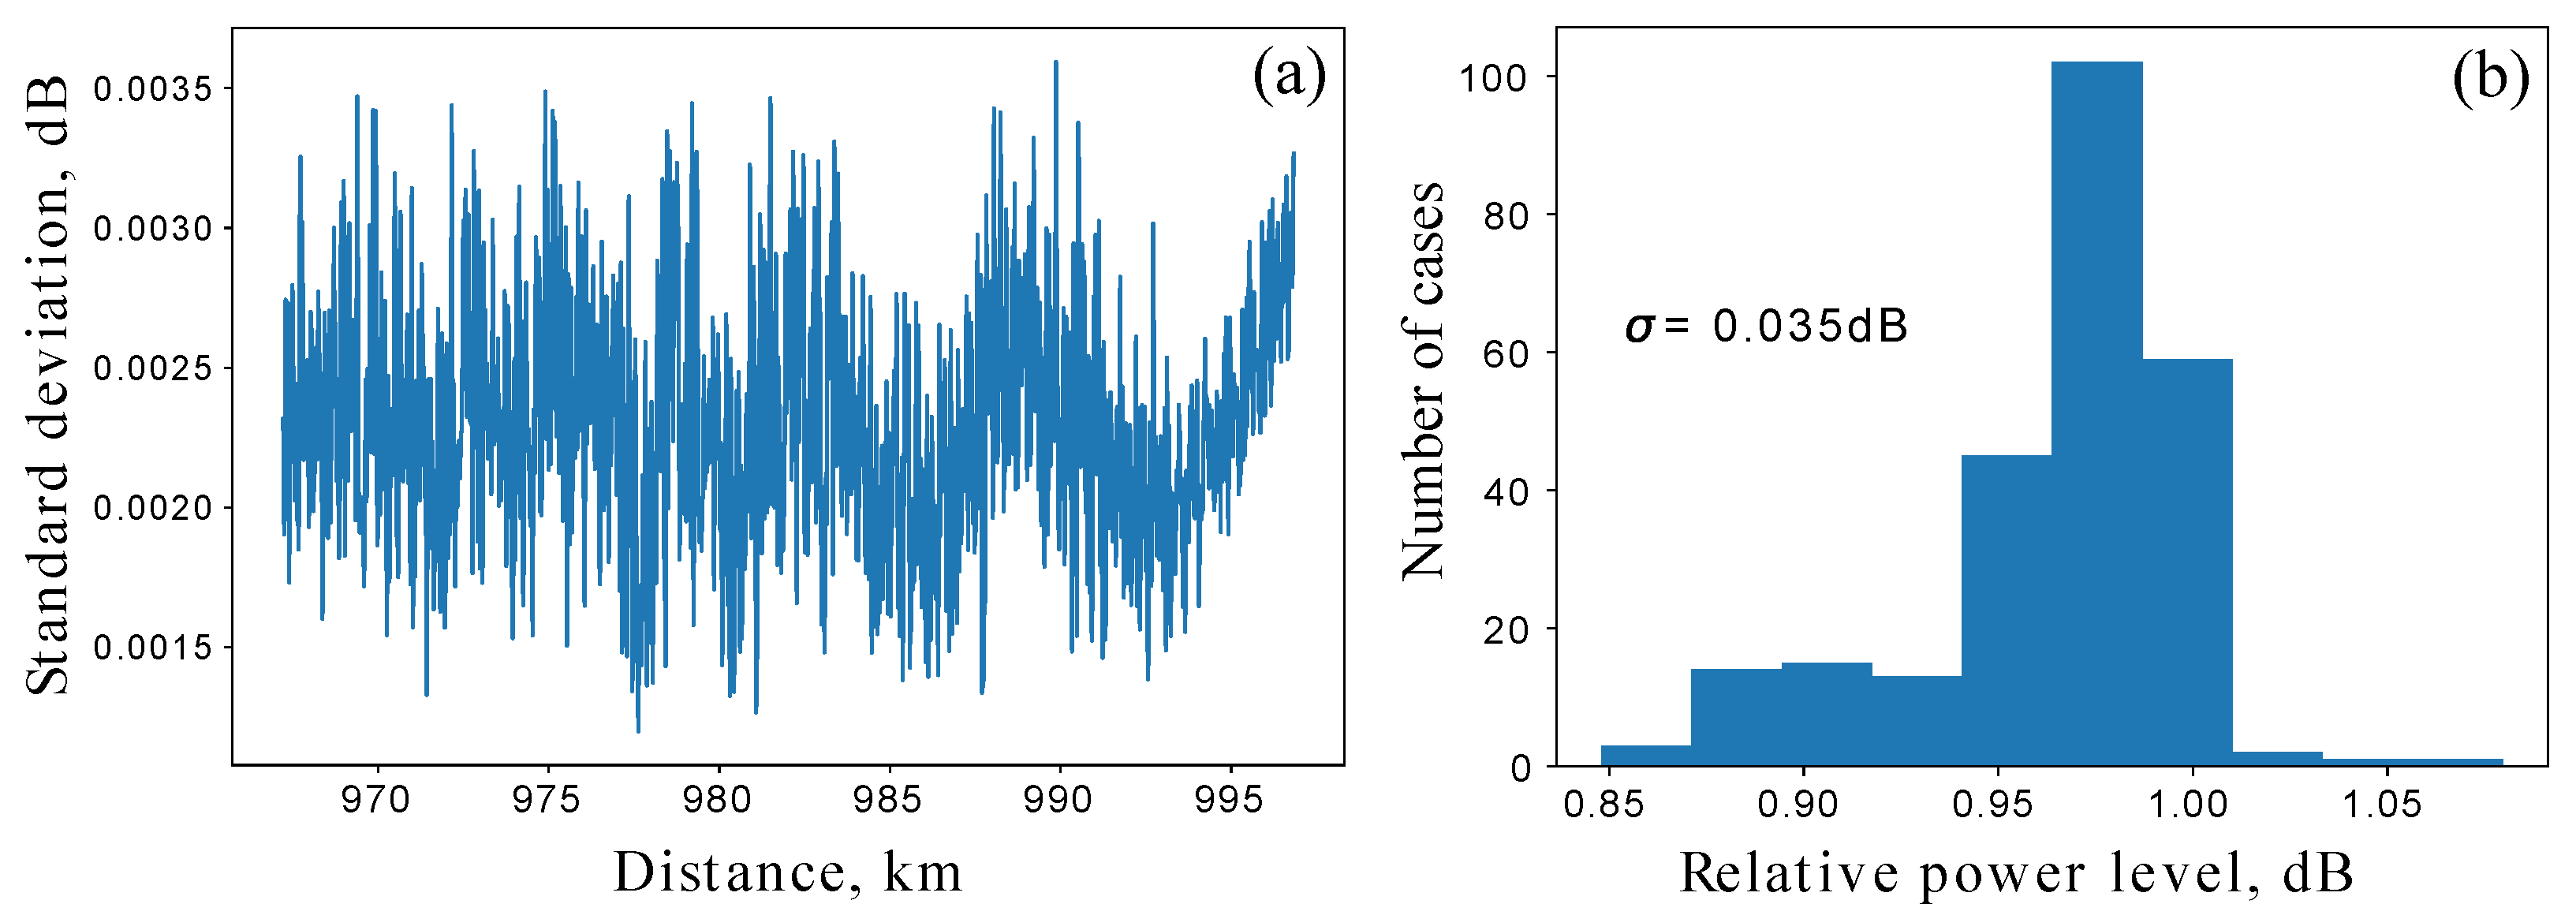
The measurements show significant stability on a daily scale with a standard deviation not exceeding 0.8% along the fiber length.
5. Conclusions and Discussion
Looking ahead, the study of the system sensitivity on distance between the amplifiers is of interest to further research. Testing our approach in real field conditions on a deployed fiber-optic line, as well as the stability observed during the long-haul study, improving spatial resolution and measurement accuracy, is one of the development steps and can be the focus of a future paper. Moreover, the consideration of various eavesdropping attacks theoretically and practically is of interest. It is also an exciting issue to consider the integration of our solution with WDM data transmission systems.
Author Contributions
Conceptualization, M.Y. and A.S.; methodology, M.Y., A.S., A.A. and D.S.; investigation, A.A. and D.S.; writing—original draft preparation, A.S. and M.Y. All authors have read and agreed to the published version of the manuscript.
Funding
This research received no external funding.
Institutional Review Board Statement
Not applicable.
Informed Consent Statement
Not applicable.
Data Availability Statement
All materials that support the results of this study are available from the corresponding author upon reasonable request.
Acknowledgments
We thank our colleague Alexey Kodukhov for the useful discussions.
Conflicts of Interest
Authors Michael Yarovikov, Alexander Smirnov, Aziz Aliev and Daniel Strizhak are employed in Terra Quantum AG.
References
- Renner, R.; Wolf, R. Quantum Advantage in Cryptography. AIAA J. 2023, 61, 1895–1910. [Google Scholar] [CrossRef]
- Pirandola, S.; Laurenza, R.; Ottaviani, C.; Banchi, L. Fundamental limits of repeaterless quantum communications. Nat. Commun. 2017, 8, 15043. [Google Scholar] [CrossRef]
- Boaron, A.; Boso, G.; Rusca, D.; Vulliez, C.; Autebert, C.; Caloz, M.; Perrenoud, M.; Gras, G.; Bussières, F.; Li, M.J.; et al. Secure Quantum Key Distribution over 421 km of Optical Fiber. Phys. Rev. Lett. 2018, 121, 190502. [Google Scholar] [CrossRef]
- Wang, S.; Chen, W.; Guo, J.F.; Yin, Z.Q.; Li, H.W.; Zhou, Z.; Guo, G.C.; Han, Z.F. 2 GHz clock quantum key distribution over 260 km of standard telecom fiber. Opt. Lett. 2012, 37, 1008. [Google Scholar] [CrossRef] [PubMed]
- Korzh, B.; Lim, C.C.W.; Houlmann, R.; Gisin, N.; Li, M.J.; Nolan, D.; Sanguinetti, B.; Thew, R.; Zbinden, H. Provably secure and practical quantum key distribution over 307 km of optical fibre. Nat. Photonics 2015, 9, 163–168. [Google Scholar] [CrossRef]
- Jouguet, P.; Kunz-Jacques, S.; Leverrier, A.; Grangier, P.; Diamanti, E. Experimental demonstration of long-distance continuous-variable quantum key distribution. Nat. Photonics 2013, 7, 378–381. [Google Scholar] [CrossRef]
- Pan, Y.; Wang, H.; Shao, Y.; Pi, Y.; Li, Y.; Liu, B.; Huang, W.; Xu, B. Experimental demonstration of high-rate discrete-modulated continuous-variable quantum key distribution system. Opt. Lett. 2022, 47, 3307. [Google Scholar] [CrossRef]
- Wang, S.; Yin, Z.Q.; He, D.Y.; Chen, W.; Wang, R.Q.; Ye, P.; Zhou, Y.; Fan-Yuan, G.J.; Wang, F.X.; Chen, W.; et al. Twin-field quantum key distribution over 830-km fibre. Nat. Photonics 2022, 16, 154–161. [Google Scholar] [CrossRef]
- Liu, Y.; Zhang, W.J.; Jiang, C.; Chen, J.P.; Zhang, C.; Pan, W.X.; Ma, D.; Dong, H.; Xiong, J.M.; Zhang, C.J.; et al. Experimental Twin-Field Quantum Key Distribution over 1000 km Fiber Distance. Phys. Rev. Lett. 2023, 130, 210801. [Google Scholar] [CrossRef] [PubMed]
- Simon, C.; De Riedmatten, H.; Afzelius, M.; Sangouard, N.; Zbinden, H.; Gisin, N. Quantum repeaters with photon pair sources and multimode memories. Phys. Rev. Lett. 2007, 98, 190503. [Google Scholar] [CrossRef] [PubMed]
- Chen, Y.A.; Zhang, Q.; Chen, T.Y.; Cai, W.Q.; Liao, S.K.; Zhang, J.; Chen, K.; Yin, J.; Ren, J.G.; Chen, Z.; et al. An integrated space-to-ground quantum communication network over 4,600 kilometres. Nature 2021, 589, 214–219. [Google Scholar] [CrossRef]
- Kirsanov, N.S.; Pastushenko, V.A.; Kodukhov, A.D.; Yarovikov, M.V.; Sagingalieva, A.B.; Kronberg, D.A.; Pflitsch, M.; Vinokur, V.M. Forty thousand kilometers under quantum protection. Sci. Rep. 2023, 13, 8756. [Google Scholar] [CrossRef]
- Popp, A.; Sedlmeir, F.; Stiller, B.; Marquardt, C. Eavesdropper localization for quantum and classical channels via nonlinear scattering. Opt. Quantum 2024, 2, 21–28. [Google Scholar] [CrossRef]
- Sushchev, I.S.; Bulavkin, D.S.; Bugai, K.E.; Sidelnikova, A.S.; Dvoretskiy, D.A. Trojan-horse attack on a real-world quantum key distribution system: Theoretical and experimental security analysis. Phys. Rev. Appl. 2024, 22, 034032. [Google Scholar] [CrossRef]
- Kodukhov, A.D.; Pastushenko, V.A.; Kirsanov, N.S.; Kronberg, D.A.; Pflitsch, M.; Vinokur, V.M. Boosting Quantum Key Distribution via the End-to-End Loss Control. Cryptography 2023, 7, 38. [Google Scholar] [CrossRef]
- Long, G.L.; Liu, X.S. Theoretically efficient high-capacity quantum-key-distribution scheme. Phys. Rev. A 2002, 65, 032302. [Google Scholar] [CrossRef]
- Pan, D.; Long, G.; Yin, L.; Sheng, Y.B.; Ruan, D.; Ng, S.; Lu, J.; Hanzo, L. The Evolution of Quantum Secure Direct Communication: On the Road to the Qinternet. IEEE Commun. Surv. Tutor. 2024, 26, 1898–1949. [Google Scholar] [CrossRef]
- Zeng, H.; Du, M.M.; Zhong, W.; Zhou, L.; Sheng, Y.B. High-capacity device-independent quantum secure direct communication based on hyper-encoding. Fundam. Res. 2023, 4, 851–857. [Google Scholar] [CrossRef] [PubMed]
- Cao, Z.; Lu, Y.; Chai, G.; Yu, H.; Liang, K.; Wang, L. Realization of Quantum Secure Direct Communication with Continuous Variable. Research 2023, 6, 0193. [Google Scholar] [CrossRef] [PubMed]
- Kirsanov, N.; Pastushenko, V.; Kodukhov, A.; Aliev, A.; Yarovikov, M.; Strizhak, D.; Zarubin, I.; Smirnov, A.; Pflitsch, M.; Vinokur, V. Loss Control-Based Key Distribution under Quantum Protection. Entropy 2024, 26, 437. [Google Scholar] [CrossRef]
- Barnoski, M.; Rourke, M.; Jensen, S.; Melville, R. Optical time domain reflectometer. Appl. Opt. 1977, 16, 2375–2379. [Google Scholar] [CrossRef] [PubMed]
- Tian, X.; Dang, R.; Tan, D.; Liu, L.; Wang, H. 123 km Φ-OTDR system based on bidirectional erbium-doped fiber amplifier. In Proceedings of the Optical Communication, Optical Fiber Sensors, and Optical Memories for Big Data Storage, Beijing, China, 9–11 May 2016; Volume 10158, pp. 191–194. [Google Scholar]
- Wang, Z.; Zeng, J.; Li, J.; Peng, F.; Zhang, L.; Zhou, Y.; Wu, H.; Rao, Y. 175 km phase-sensitive OTDR with hybrid distributed amplification. In Proceedings of the 23rd International Conference on Optical Fibre Sensors, Santander, Spain, 2–6 June 2014; Volume 9157, pp. 1562–1565. [Google Scholar]
- Wang, Y.; Wang, Y.; He, C.; Liu, X.; Bai, Q.; Jin, B. 190 km Φ-OTDR with bidirectional Raman and relay erbium-doped fiber hybrid amplification. Opt. Lasers Eng. 2023, 166, 107569. [Google Scholar] [CrossRef]
- Fan, C.; Li, H.; Zhang, K.; Liu, H.; Sun, Y.; Liu, H.; Yan, B.; Yan, Z.; Liu, D.; Shum, P.P.; et al. 300 km ultralong fiber optic DAS system based on optimally designed bidirectional EDFA relays. Photonics Res. 2023, 11, 968–977. [Google Scholar] [CrossRef]
- Sumida, M.; Imai, T.; Furukawa, S.i. Fault location on optical amplifier submarine systems. In Proceedings of the Conference Proceedings. 10th Anniversary. IMTC/94. Advanced Technologies in I & M. 1994 IEEE Instrumentation and Measurement Technolgy Conference (Cat. No. 94CH3424-9), Hamamatsu, Japan, 10–12 May 1994; pp. 110–113. [Google Scholar]
- Furukawa, S.i.; Tanaka, K.; Koyamada, Y.; Sumida, M. Enhanced coherent OTDR for long span optical transmission lines containing optical fiber amplifiers. IEEE Photonics Technol. Lett. 1995, 7, 540–542. [Google Scholar] [CrossRef]
- Sumida, M. Optical time domain reflectometry using an M-ary FSK probe and coherent detection. J. Lightwave Technol. 1996, 14, 2483–2491. [Google Scholar] [CrossRef]
- Otani, T.; Horiuchi, Y.; Kawazawa, T.; Goto, K.; Akiba, S. Fault localization of optical WDM submarine cable networks using coherent-optical time-domain reflectometry. IEEE Photonics Technol. Lett. 1998, 10, 1000–1002. [Google Scholar] [CrossRef]
- Iida, H.; Toge, K.; Ito, F. Environmental perturbation tracking in coherent OTDR for recovering detection sensitivity. In Proceedings of the 39th European Conference and Exhibition on Optical Communication (ECOC 2013), London, UK, 22–26 September 2013; pp. 1–3. [Google Scholar]
- Chen, M.; Zhang, M.; Chen, S.; Zhang, J.; Yan, S.; Wang, Y. Health monitoring of long-haul fiber communication system using chaotic OTDR. China Commun. 2020, 17, 1–11. [Google Scholar] [CrossRef]
- Fernández, M.P.; Rossini, L.A.B.; Pascual, J.P.; Caso, P.A.C. Enhanced fault characterization by using a conventional OTDR and DSP techniques. Opt. Express 2018, 26, 27127–27140. [Google Scholar] [CrossRef] [PubMed]
- Rizzo, A.; Magri, L.; Rutigliano, D.; Invernizzi, P.; Sozio, E.; Alippi, C.; Binetti, S.; Boracchi, G. Known and unknown event detection in OTDR traces by deep learning networks. Neural Comput. Appl. 2022, 34, 19655–19673. [Google Scholar] [CrossRef]
- Abdelli, K.; Grießer, H.; Tropschug, C.; Pachnicke, S. Optical Fiber Fault Detection and Localization in a Noisy OTDR Trace Based on Denoising Convolutional Autoencoder and Bidirectional Long Short-Term Memory. J. Lightwave Technol. 2022, 40, 2254–2264. [Google Scholar] [CrossRef]
- Li, Y.; Zhang, D.; Wang, Z.; Yang, H.; Yu, T.; Yao, Q.; Liu, S.; Wang, D.; Zhao, Y.; Li, H.; et al. Field trial of concurrent co-cable and co-trench optical fiber online identification based on ensemble learning. Opt. Express 2023, 31, 42850–42865. [Google Scholar] [CrossRef] [PubMed]
- Burdin, V.A.; Bourdine, A.V.; Zaitseva, E.S.; Praporshchikov, D.E. Application of MIMO concept to detect nonreflecting events on cable fiber traces. In Proceedings of the Optical Technologies for Telecommunications 2020; Andreev, V.A., Bourdine, A.V., Burdin, V.A., Morozov, O.G., Sultanov, A.C., Eds.; International Society for Optics and Photonics, SPIE: Bellingham, WA, USA, 2021; Volume 11793, p. 117931B. [Google Scholar] [CrossRef]
- Desurvire, E.; Bayart, D.; Desthieux, B.; Bigo, S. Erbium-Doped Fiber Amplifiers: Device and System Developments; Wiley: Hoboken, NJ, USA, 2002. [Google Scholar]
- Kim, S.J.; Koh, K.; Boyd, S.; Gorinevsky, D. ℓ1 trend filtering. SIAM Rev. 2009, 51, 339–360. [Google Scholar] [CrossRef]
- Smirnov, A.; Yarovikov, M.; Zhdanova, E.; Gutor, A.; Vyatkin, M. An Optical-Fiber-Based Key for Remote Authentication of Users and Optical Fiber Lines. Sensors 2023, 23, 6390. [Google Scholar] [CrossRef] [PubMed]
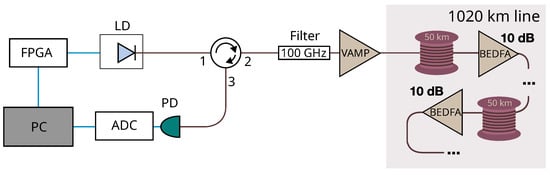
Schematic of the custom OTDR device. LD—laser diode; FPGA—field-programmable gate array; VAMP—variable bidirectional optical amplifier; PD—optical photodetector; ADC—analog-to-digital converter; BEDFA—bidirectional optical erbium-doped fiber amplifier; PC—personal computer.
Figure 1.
Schematic of the custom OTDR device. LD—laser diode; FPGA—field-programmable gate array; VAMP—variable bidirectional optical amplifier; PD—optical photodetector; ADC—analog-to-digital converter; BEDFA—bidirectional optical erbium-doped fiber amplifier; PC—personal computer.
(a) Experimental OTDR trace of the entire 1020 km fiber line with 18 amplifiers. The measurements were performed with a probing pulse duration of 1 μs and averaging over 1.5 × 10⁴ pulses. (b) The reflectogram of the last fiber span. (c) The loss map of the last fiber span in percent scale.
Figure 2.
(a) Experimental OTDR trace of the entire 1020 km fiber line with 18 amplifiers. The measurements were performed with a probing pulse duration of 1 μs and averaging over 1.5 × 10⁴ pulses. (b) The reflectogram of the last fiber span. (c) The loss map of the last fiber span in percent scale.
Scheme of the experimental setup with dual mode optical switch. EDFA—erbium-doped fiber amplifier; LD-2—laser diode; VOA—variable optical attenuator; OC—optical coupler; PM-1,2—optical powermeters; PC—personal computer.
Figure 3.
Scheme of the experimental setup with dual mode optical switch. EDFA—erbium-doped fiber amplifier; LD-2—laser diode; VOA—variable optical attenuator; OC—optical coupler; PM-1,2—optical powermeters; PC—personal computer.
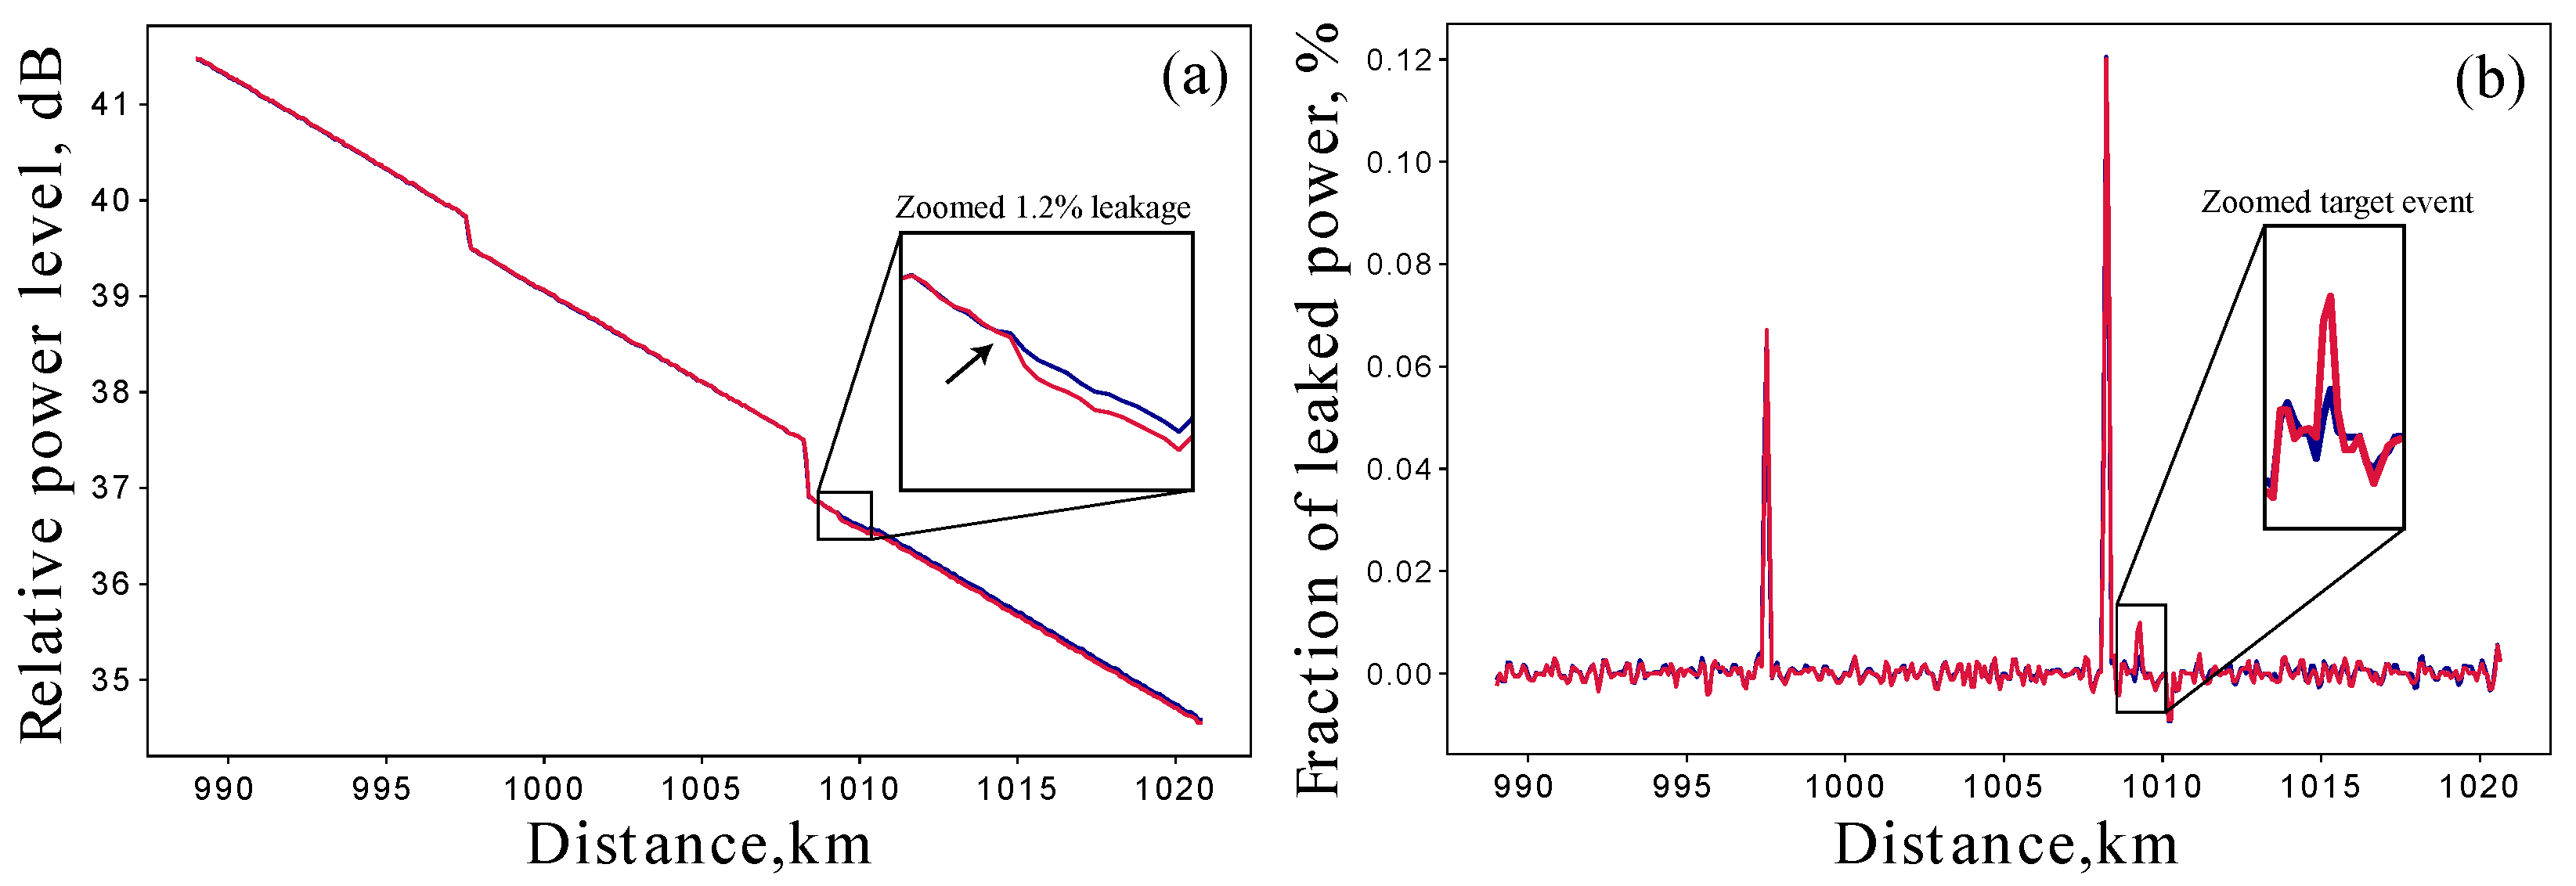
(a) OTDR traces of the last span of the line. The blue trace is the reference trace as in Figure 2b and the red trace is the trace of the line with the introduced 1.2% leakage at the position near 1009 km. (b) Corresponding loss maps of the two OTDR traces.
(a) OTDR traces of the last span of the line. The blue trace is the reference trace as in Figure 2b and the red trace is the trace of the line with the introduced 1.2% leakage at the position near 1009 km. (b) Corresponding loss maps of the two OTDR traces.
(a) Visualization of 2 series of OTDR measurements. The zoomed blue and red loss maps correspond to the line with and without the test leakage. Such a small intrusion is hardly visible even on the loss map. (b) The statistics of the extracted losses for reference data (red histogram) and leakage data (blue histogram) approximated with the Gaussian distributions. (c) Visualization of the mean difference between reference and leakage maps. The statistics were taken over 400 pairs of traces. Although leakage does not match the estimate, it is statistically distinguishable and cannot be lost with a loss-negative result.
Figure 5.
(a) Visualization of 2 series of OTDR measurements. The zoomed blue and red loss maps correspond to the line with and without the test leakage. Such a small intrusion is hardly visible even on the loss map. (b) The statistics of the extracted losses for reference data (red histogram) and leakage data (blue histogram) approximated with the Gaussian distributions. (c) Visualization of the mean difference between reference and leakage maps. The statistics were taken over 400 pairs of traces. Although leakage does not match the estimate, it is statistically distinguishable and cannot be lost with a loss-negative result.

(a) The pointwise standard deviation of the reflectogram per day. This graph reflects its own drift for 1 day with a current implementation of the line and OTDR instrument itself. (b) The histogram showing the distribution of OTDR values at the intrusion point during the day. Its standard deviation is dB, which corresponds to a variation of 0.8%.
Figure 6.
(a) The pointwise standard deviation of the reflectogram per day. This graph reflects its own drift for 1 day with a current implementation of the line and OTDR instrument itself. (b) The histogram showing the distribution of OTDR values at the intrusion point during the day. Its standard deviation is dB, which corresponds to a variation of 0.8%.
Disclaimer/Publisher’s Note: The statements, opinions and data contained in all publications are solely those of the individual author(s) and contributor(s) and not of MDPI and/or the editor(s). MDPI and/or the editor(s) disclaim responsibility for any injury to people or property resulting from any ideas, methods, instructions or products referred to in the content. |
Source link
Michael Yarovikov www.mdpi.com