3.1. SERS Serum Spectra
SERS spectra were collected from serum samples from two different groups of patients: 143 spectra came from the respiratory diseases group and 309 spectra came from the CHF group.
Figure 2 shows the mean SERS spectra of serum samples for each pathology group and for each respiratory disease separately. Mean spectra were formed by averaging all the spectra of each disease. As we can see, the SERS serum spectra of all disease groups consist of a set of prominent Raman peaks in 500–1800 cm
−1 wavenumbers assigned to the different serum constituents, with the following possible associations [
4,
36]: 587 cm
−1 (Phosphatidylinositol in lipids), 638 cm
−1 (uric acid), 724 cm
−1 (δ(C–H) of adenine, coenzyme A, DNA/RNA), 805 cm
−1 (ν(C–C–O) of L-Serine, glutathione), 890 cm
−1 (δ(C–O–H) or ring bending of Tryptophan, glutathione, tryptophan, D-(C)-galactosamine), 947 cm
−1 (C-C stretching of proteins), 1008 cm
−1 (Phenylalanine), 1051 cm
−1 (Glycogen in Carbohydrates), 1132 cm
−1 (ν(C–N) in D-Mannose), 1207 cm
−1 (ring vibrations in L-Tryptophan, phenylalanine), 1329 cm
−1 (Torsion mode CH
2 in lipids), 1390 cm
−1 (C−N, C−H group, ω(CH
3), CH
2 wagging in lipids), 1442 cm
−1 (CH
2/CH
3 deformations in proteins and lipids), 1568 cm
−1 (DNA/RNA bases), and 1657 cm
−1 (ν(C-O), Amide I).
The highlighted spectral differences were observed between the mean spectra of the respiratory disease group and CHF. In particular, for the respiratory diseases group, the SERS signal intensities at 724, 947, 1051, and 1390 cm
−1 were higher, while the peaks at 638 and 1657 cm
−1 showed a decrease compared to the opposite group (
Figure 2a). It is interesting to note that the serum SERS spectra of patients with different types of respiratory diseases, as presented in
Figure 2b, were more similar in terms of spectral intensity values. Spectral differences between COPD and BA cases were observed at several bands, with higher intensities at the 638, 1008, and 1392 cm
−1 bands for COPD mean spectra and at the 1051, 1207, and 1568 cm
−1 bands for BA mean spectra. However, it is difficult to visually identify specific patterns in the spectral signal for COPD cases. Due to the complex biochemical composition of serum, the standard deviation of Raman intensities overlaps at the same peaks between the values of different patient groups. Additionally, it is important to note that the serum composition does not fundamentally change in different diseases; the ratios of different functional groups and backbone chains, for example, in proteins, lipids, and nucleic acids are changed. To identify significant spectral differences between groups of patients and use them for differentiation, multivariate statistical methods should be applied. In this study, the PLS-DA approach was applied to build two classification models: respiratory diseases vs. CHF and COPD vs. BA.
3.2. PLS-DA Classification Models
PLS-DA models were built on the training set for each classification task and tested on the test set. The performance of the classification models based on PLS-DA is presented in
Table 3, where the sensitivities, specificities, and accuracies are shown in terms of mean and minimum and maximum values achieved across all modeling folds.
The first model (I) was a binary classification to differentiate between all respiratory diseases and CHF cases (pathological referent group). We want to emphasize the importance of forming the pathological referent group correctly. It consists of patients with a CHF of the same age. As we can see from
Table 1, the age ranges and mean ages are almost the same for the group with respiratory diseases and CHF patients, which eliminates the influence of age on the classification results.
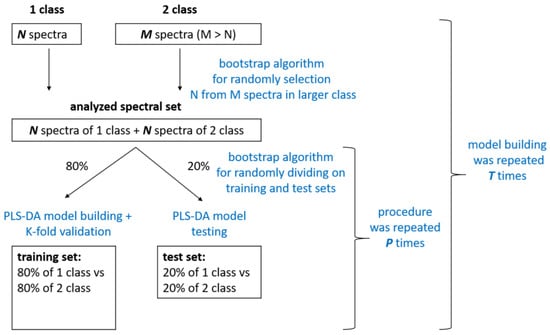
The spectra of 41 patients from the respiratory pathology group and 41 patients from the CHF were randomly selected from the total spectral set using the bootstrap algorithm. This allowed us to build a model on balanced groups. The analyzed spectral set was divided into training and testing sets multiple times (
P = 5). At each fold, training was performed on the training set, which consisted of 196 spectra (80% of the spectra selected from 82 patients). Model building iterations were repeated
T = 5 times; thus, we averaged and analyzed the model results for 25 different folds. A total of 5 to 7 LVs were used to train the model in each of the 25 folds, according to the RMSE criterion.
Figure 3a shows the mean VIPs for the 25 folds, with a gradient fill overlayed on the serum SERS spectrum, where purple corresponds to the minimum useful contribution of a spectral band in the model and yellow corresponds to the maximum contribution (scale shown in
Figure 3). In accordance with the VIP distribution, the 630–650 cm
−1 band with a maximum at 638 cm
−1 (uric acid) and the 1065–1081 cm
−1 band with a maximum at 1051 cm
−1 are characterized by significant contributions in building the PLS-DA model. For this study, the mean values of sensitivity, specificity, accuracy, and ROC AUC over five models were observed as 0.94, 0.95, 0.95, and 0.97, respectively, during training (
Table 3).
At each fold, after the classification was performed on the training set, its capability was tested on the test set, which consisted of 50 spectra (20% of the total number of spectra). We calculated the average sensitivity, specificity, and accuracy over 25 iterations for each test set of all folds. As we can see in
Table 3, the sensitivity and specificity values of the test set have slightly higher variances compared to the training set. However, the minimal and mean accuracy values of 0.82 and 0.92 over 25 iterations prove the high performance of differentiating between respiratory diseases and CHF. These results show that the biochemical changes during pathology are reflected in the SERS spectral profile of serum and depend on the type of disease, allowing us to identify respiratory diseases among pathological referent patients.
After identifying respiratory diseases, a second classification model was developed to classify the types of respiratory diseases, specifically to differentiate between COPD and BA cases. A total of 33 spectra from 11 patients with COPD and 33 spectra from 11 patients with BA were randomly selected using the bootstrap algorithm to train and test the model. The model was trained using 52 spectra and tested using 14 spectra selected randomly by the bootstrap algorithm. This process was repeated
P = 3 times to divide the analyzed spectra into training and test sets. The model building procedure was repeated
T = 3 times, allowing us to achieve and average the results for nine different folds. In accordance with the mean VIP distribution averaged over nine folds in
Figure 3a, the most dominant changes were observed at 638, 724, 947, 1025, 1051, 1329, and 1395 cm
−1 peaks, amongst others.
The results of the PLS-DA statistical model for differentiating COPD from BA cases based on serum SERS spectra are presented in
Table 3. We observed a significant decrease in sensitivity, specificity, and accuracy values for the test set compared to the training set. In addition, the mean ROC AUC was 0.93 for the training set and 0.72 for the test set, indicating that the model did not perform as well when verifying new cases.
In total, the “COPD vs. BA” (II) model shows much lower performance compared to the “respiratory diseases vs. CHF” (I) model, with mean accuracy values of 0.95 for the training set and 0.92 for the test set for model I, and 0.89 and 0.61, respectively, for model II. We can confidently claim that the achieved performance is not accidental, as the mean test ROC AUC of 25-folds equals 0.97 with a relatively small variance of 0.0029, indicating the stability of the classification model. Therefore, it can be argued that there are biochemical changes in human serum that can be “caught” by SERS, allowing for the identification of respiratory diseases from other conditions. On the other hand, the performance of the “COPD vs. BA” model was tested on a test set in order to check the reliability of its diagnostic capabilities. However, the results were not satisfactory. The ROC AUC values showed high variability, ranging from 0.53 to 1.0, for nine different folds of the test set. Furthermore, differences in the spectral bands, highlighted by VIP as being important (yellow gradient fill in
Figure 3b), demonstrate the absence of specific bands and changes in characteristics of COPD compared to BA.
VIP analysis of the “respiratory diseases vs. CHF” model prominently highlights specific spectral changes between the two groups in Raman bands at 638 and 1051 cm
−1, which were also observed in the differences in mean spectra. Assigning spectral bands in serum spectra to specific compounds is a complex task due to the multi-component nature of serum. While a particular Raman band can be associated with a specific compound, its contribution is not exclusive. For instance, the Raman band at 638 cm
−1 has been linked to uric acid based on comparisons with known metabolite SERS signals, as detailed in the literature [
37,
38,
39]. Increased uric acid levels are linked to various biological processes, such as oxidative stress and inflammation. Several epidemiological studies [
40,
41,
42] suggest a possible association between elevated uric acid levels and certain diseases such as kidney diseases and cardiovascular disease, although the exact nature of this relationship is still uncertain. In our study, we also found that SERS signals from uric acid at 638 cm
−1 in the serum of CHF patients showed a higher intensity compared to serum samples of patients with respiratory diseases. The relationship between COPD and uric acid levels has been discussed in relation to the effect of hyperuricemia on the progression of the condition. A paper by Sarangi [
43] discussed the relationship between serum uric acid levels and the severity of COPD in patients. It is interesting to note that the study found that serum uric acid levels increased with increasing COPD severity. H. Yang et al. [
44] have also reported that elevated serum uric acid levels were linked to reduced lung function. However, no significant impact of serum uric acid on lung function was observed in those without COPD. In the current study, we do not have sufficient data on the uric acid levels in serum samples to verify this assumption. Nevertheless, the comparison of the 638 cm
−1 peak intensities between our samples with the second and third degree of COPD severities was not statistically significant (
p > 0.05). Peaks related to glycogen at 1051 cm
−1 are more prominent in the respiratory diseases’ mean spectrum compared to the CHF group, possibly indicating metabolic alterations occurring in COPD. Acute hyperglycemia is associated with poor outcomes in patients with various diseases and data on hyperglycemia and COPD in particular are known [
45].
Difficulties in differentiating between BA and COPD are also seen in clinical practice. This could be due to the lack of specific biomarkers that could identify these conditions, despite their different pathogenesis. Several studies [
6,
46] have studied the role of biomarkers such as periostin, IL-18, CCL-18, and others in the systemic inflammation of these disorders, but there have not been any significant differences reported between BA and COPD. It is possible that neutrophilic inflammation plays a role in the pathogenesis of both conditions, which results in the complexity of differential diagnosis [
47]. However, the relationship between neutrophil numbers in blood serum and registered spectral data have not been analyzed in this study.
To our knowledge, only a few papers have discussed the study of COPD cases using Raman-based techniques [
4]. This is a very interesting area of research due to its clinical relevance and many aspects require detailed analysis. The main goal of developing an optical diagnostic method is to identify specific changes and spectral markers during the progression of COPD in order to explain the results of spectral analysis. C. Carlomango et al. [
5], for example, performed a comparative Raman analysis of pathological saliva samples from COPD patients and healthy individuals. They found informative spectral differences between the two groups with changes in lipid and carbohydrate regions in the 500–600 and 1250–1350 cm
−1 ranges, as well as changes in proteins, carbohydrates, and nucleotide vibrational modes in the 900–950 and 1100–1200 cm
−1 regions. In this study, we found that significant spectral changes associated with the presence of respiratory diseases could be related to the 638 cm
−1 band of uric acid and 1051 cm
−1 of glycogen. However, the changes associated with COPD cases, in contrast to those of BA, at 638, 724, 947, 1025, 1051, and 1329 cm
−1 bands, have so far prevented us from proposing a model with high accuracy when verifying this.
The main limitation of this study is the small number of patients with respiratory diseases, particularly those with COPD. To overcome this problem, we created balanced groups of patients with respiratory disease and CHF using the bootstrap algorithm (see
Figure 1) to build classification models. This approach allowed us to ensure an equal number of spectra in each group, which prevented imbalances in the data and led to the creation of reliable statistical models. Nevertheless, to verify the results and conclusions of this preliminary study, it is necessary to perform additional tests on a larger sample size of patients. Moreover, the heterogeneity of BA and COPD encompasses multiple phenotypes and endotypes, which are crucial for diagnosis and treatment. Therefore, substantial work on expanding the sample size considering the various phenotypes of respiratory diseases is required before a diagnostic method based on SERS can become viable.
The other limitation is that the differences in SERS spectra reflect nonspecific changes in human serum associated with the analyzed diseases, especially COPD. The molecular components associated with the informative spectral peaks represent broad functional groups of chemicals and the estimation of these changes may be overly general. Additionally, without the results of laboratory biochemical analysis of the serum, it is difficult to draw definitive conclusions about the possible causes of the observed differences. Therefore, a further area of study for the future is to combine SERS with precise biochemical analysis in clinical laboratories on the same samples to compare results of spectral analysis with quantitative chemical profiles of human serum.