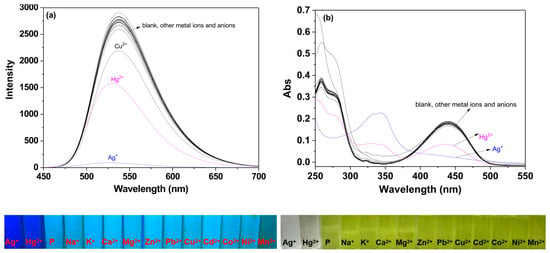
The following supporting information can be downloaded at: https://www.mdpi.com/article/10.3390/molecules29215196/s1, Figure S1 (a) Fluorescence response of P (10 µM) to Ag+ (10 µM) or to the mixture of individual metal ions (50 µM) with Ag+ (10 µM) in ethanol; (b) Fluorescence response of P (10 µM) to Ag+ (10 µM) or to the mixture of individual metal ions (50 µM) with Ag+ (10 µM) in ethanol-water solution (v:v, 9:1, pH 7.0, 20 mM HEPES); (c) Fluorescence response of P (10 µM) to Ag+ (10 µM) or to the mixture of individual metal ions (50 µM) with Hg2+ (10 µM) in ethanol-water solution (v:v, 9:1, pH 7.0, 20 mM HEPES); Figure S2 The reversibility of the P-Ag+ system was investigated in ethanol-water solution (v:v, 9:1, pH7, 20 mM HEPES): a. P (10 μM); b. P (10 μM) + Ag+ (10 μM); c. P (10 μM) + Ag+ (10 μM) + Cl− (10 μM); d. P (10 μM) + Ag+ (10 μM) + Cl− (100 μM); e. P (10 μM) + Ag+ (10 μM) + Cl− (10 μM) + Ag+ (100 μM); Figure S3 The reversibility of the P-Hg2+ system was investigated in ethanol-water solution (v:v, 9:1, pH7, 20 mM HEPES): a. P (10 μM); b. P (10 μM) + Hg2+ (10 μM); c. P (10 μM) + Hg2+ (10 μM) + S2− (10 μM); d. P (10 μM) + Hg2+ (10 μM) + S2− (100 μM); e. P (10 μM) + Hg2+ (10 μM) + S2− (10 μM) + Hg2+ (100 μM); Figure S4 The effect of different solvents on the probe’s spectrum. (a) Fluorescence; (b) UV-vis; Figure S5 Effect of different water contents on the fluorescence spectra of probe P (10 μM) and P (10 μM)-Ag+ (100 μM), P (10 μM)-Hg2+ (100 μM); Figure S6 Effect of different pH values on the fluorescence spectra of probe P (10 μM) and P (10 μM)-Ag+ (100 μM) or Hg2+ (100 μM) in ethanol-water solution (v:v, 9:1); Figure S7 Effect of equilibrium time of probe P (10 μM) and Ag+ (100 μM) on fluorescence intensity in ethanol-water solution (v:v, 9:1, pH 7.0, 20 mM HEPES); Figure S8 Effect of equilibrium time of probe P (10 μM) and Hg2+ (100 μM) on fluorescence intensity in ethanol-water solution (v:v, 9:1, pH 7.0, 20 mM HEPES); Figure S9 Photostability tests of P (10 μM) and P (10 μM) plus Ag+ (100 μM) in ethanol; P (10 μM) and P (10 μM) plus Ag+ (100 μM), P (10 μM) plus Hg2+ (100 μM) in ethanol-water solution (v:v, 9:1, pH 7.0, 20 mM HEPES); Figure S10 1H NMR spectra of P-Ag+; Figure S11 1H NMR spectra of P-Hg2+; Figure S12 ESI-MS spectra of P-Ag+; Figure S13 ESI-MS spectra of P-Hg2+; Figure S14 Benesi-Hildebrand plot of P, assuming 1:1 stoichiometry for association between P and Ag+; Figure S15 Benesi-Hildebrand plot of P, assuming 1:1 stoichiometry for association between P and Hg2+; Figure S16 FT-IR of compounds; Figure S17 1H NMR of P; Figure S18 13C NMR of P; Figure S19 ESI-MS of P; Table S1 Comparison of performances of various fluorescence methods for determination of Ag+/Hg2+.
Source link
Chunwei Yu www.mdpi.com

