3.1. Prediction of RUL for Slow-Charged LIBs
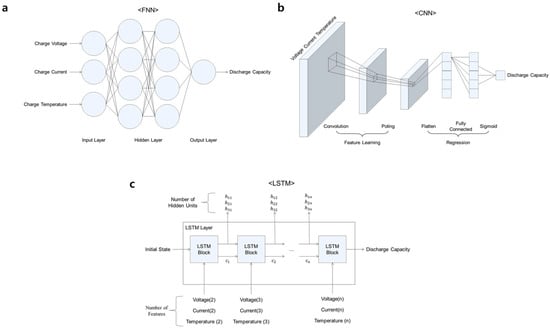
Various artificial neural network models, including FNN, CNN, and LSTM, investigated the prediction of RUL for slow-charged LIBs. The research methodology involved analyzing charge/discharge measurements of commercial cylindrical cells to determine their nominal condition based on cycle-dependent data in
Figure 3. As expected, higher C-rates correlated with increased degradation rates of the cells. This study focused on identifying the cycle life at which cells retained 80% of their initial capacity (4 Ah) to predict RUL.
This study conducted performance analyses of various artificial neural network models (FNN, CNN, and LSTM) to predict the RUL of LIBs. The models were configured using measured lifespan data to predict discharge capacity based on input vectors comprising current, voltage, and temperature curves for each cycle [
34]. The results showed that all models achieved a relatively high level of accuracy during training, with root mean square error (RMSE) values remaining below 3.5% of the nominal capacity for all samples (
Figure 4b). This indicates good overall performance in fitting the training data.
When comparing the performance of the models, we observed significant differences. The CNN and LSTM models showed higher accuracy compared to the FNN model. This improved performance can be attributed to their ability to incorporate time-related effects in the data, which is crucial for capturing the temporal dependencies in battery degradation patterns [
35]. In contrast, the FNN model displayed higher RMSE values and provided less accurate discharge capacity estimations. This poorer performance of the FNN model was likely due to its inability to effectively capture temporal relationships in the data, coupled with inadequate training data from the high-speed degradation experiment.
These observations are illustrated in
Figure 4c–h, which show the comparative performance of the three models across different scenarios. The superior performance of the CNN and LSTM models underscores the importance of considering temporal dependencies in battery life prediction tasks. Their ability to capture time-related effects makes them more suitable for modeling the complex, time-dependent processes involved in battery degradation.
Figure 5b,g display the projected discharge capacity plotted against the cycle, utilizing FNN, CNN, and LSTM with two sets of cycling data. The first set includes 1.0C, 1.5C, 2.0C, 2.5C, and 3.0C, shown in
Figure 5a, while the second set comprises 1.2C, 1.5C, 2.0C, 2.5C, and 3.0C, illustrated in
Figure 5b. These models utilized respective cycles’ voltage, current, and temperature curves as input vectors. The RMSE for all samples remained below 2% of the nominal capacity during training, indicating high accuracy. The performance differences between FNN, CNN, and LSTM networks in predicting 1.2C data in
Figure 5d can be attributed to their distinct architectural characteristics and ability to process time-series data.
While capable of handling complex, non-linear relationships, FNNs have limitations in capturing temporal dependencies inherent in time-series data. In the context of battery data, where past information significantly influences current and future states, FNNs struggle to learn these temporal relationships effectively. This limitation is particularly evident when dealing with interpolated data of 1.2C, where the temporal patterns are crucial for accurate predictions.
CNNs, primarily designed for spatial feature extraction, face challenges in directly modeling temporal dependencies. While they excel in image processing and can be adapted for time-series data, they may not fully capture the long-term dependencies crucial for understanding battery degradation over extended periods. This limitation becomes apparent when dealing with the complex temporal patterns in 1.2C charging data.
In contrast, predicting a discharge capacity of 1.2C using LSTM networks shows the lowest value of RMSE (
Figure 5e). LSTMs are specifically designed to handle sequential and time-series data. Their architecture, featuring a gating mechanism, allows them to learn and retain important information over long periods effectively. This capability is particularly advantageous for modeling the long-term patterns inherent in battery charge/discharge cycles, including those at 1.2C rates.
The inclusion of 1C slow-charging data in the training set and interpolation of 1.2C data resulted in improved accuracy and better fit for the LSTM. The LSTM model, incorporating time-dependent characteristics, demonstrated the lowest RMSE and highest accuracy in predicting discharge capacity, suggesting its suitability for time-series data and potential for predicting RUL of untrained lithium-ion batteries [
35].
To predict the slow degradation of discharge capacity, the second set of training cycle data (
Figure 5f) shows similarly low values of RMSE compared to the first set of training cases, as shown in
Figure 5h. When predicting 1C data, all three models exhibited high error rates in
Figure 5j, highlighting the challenge of forecasting low-degradation characteristics using data obtained from high-speed degradation experiments (<1.2C). Additionally, discrepancies between the training and prediction electrochemical curves contributed to elevated errors across all models in
Figure 5i.
While the LSTM model demonstrated proficiency in predicting discharge capacity for interpolated data within the range of its training set, it exhibited significant limitations when extrapolating to new, untrained input curves. Specifically, the LSTM model performed well in scenarios where it could interpolate between known data points, such as predicting 1.2C data when trained on both 1C and 1.5C data. However, when tasked with extrapolating to entirely new patterns or conditions not represented in the training data, such as predicting 1C behavior based solely on higher C-rate data, the LSTM model’s performance deteriorated markedly.
This limitation in extrapolation highlights the challenges traditional RNN-based machine learning models face in accurately forecasting battery behavior under novel operational conditions. More advanced approaches like the Seq2Seq model need to be proposed for forecasting RUL in a slow charging rate with a fast-cycling degradation dataset. To address this, the research suggested the use of a Sequence-to-Sequence (Seq2Seq) model-based time-series artificial neural network model capable of accurately predicting untrained extrapolated data and input vectors, thereby enhancing RUL prediction accuracy for lithium-ion batteries.
3.2. Performance of Seq2Seq Model for Charging Profile Prediction and Lifespan Prediction
Figure 6 illustrates the conceptual framework of the Seq2Seq network developed in this study. The model was designed to predict subsequent cycles’ voltage, current, and temperature curves based on the initial cycle’s data. Specifically, the Seq2Seq network utilizes the current, voltage, and temperature profiles from the first cycle as input to forecast the corresponding curves for the next cycle [
35]. This process is then repeated sequentially, with each prediction as input for the subsequent cycle’s forecast. To optimize the model’s performance, we conducted extensive hyperparameter tuning [
36].
Following the hyperparameter optimization, we extended the model’s capability to predict discharge capacity for each charge/discharge cycle. We incorporated the predicted voltage, current, and temperature curves into a discharge capacity estimation module within the Seq2Seq framework to accomplish this.
This approach addresses a significant limitation of prior models, such as FNN, CNN, and LSTM, which could not predict discharge capacity without existing input vectors. This innovative approach allows for the prediction of battery performance over multiple cycles, using only the initial cycle data as a starting point. By iteratively applying the Seq2Seq model, we can comprehensively forecast the battery’s behavior throughout its lifespan, including the electrochemical parameters (voltage, current, temperature) and the critical performance metric of discharge capacity.
The Seq2Seq model in
Figure 7b shows high accuracy by achieving an RMSE of less than 1% when predicting the final cycle’s charging data corresponding to 379 cycles for 1.0C, 260 cycles for 1.2C, 148 cycles for 1.5C, 132 cycles for 2.0C, 141 cycles for 2.5C, and 75 cycles for 3.0C. These data represent 80% of the nominal capacity across all data points for the prediction of each C rate sample. Among the input parameters, it is noteworthy that temperature demonstrated a slightly higher RMSE in comparison to voltage and current, indicating a relatively lower degree of fit, as depicted in
Figure 7b.
The model effectively predicts the RUL by using charging parameters like capacity, current, and temperature. It does this without needing repetitive experimental trials. In the 3C sample (
Figure 7h), the RMSE was slightly higher because the model faced challenges predicting final cycle data based only on the first cycle data. This is a common limitation shared with other neural network models when dealing with insufficient and shorter time-series data compared to the lower C rate samples.
To enhance accuracy, further training with additional samples at the same charging rate or fine-tuning the model’s hyperparameters may be necessary. Despite this, the model has shown high accuracy in samples with sufficient cycle data at various C rates, indicating a promising potential for RUL prediction using this approach [
37].
Figure 8 shows the performance of the Seq2Seq model in predicting low-rate, untrained data using high-rate charging training data. The analysis reveals that the model achieved low RMSE values for both untrained 1C and 1.2C data, demonstrating its capability to interpolate and extrapolate from high-rate to low-rate charging scenarios.
Specifically, the Seq2Seq model accurately predicted capacity, voltage, and current profiles for the untrained 1C (
Figure 8b) and 1.2C (
Figure 8c) conditions. These parameters exhibited similar patterns across different C-rates and cycles, enabling the model to capture and predict their temporal evolution effectively.
However, the model encountered challenges in accurately fitting temperature profiles during operation for both 1C and 1.2C conditions with relatively higher RMSE. This limitation can be attributed to the unique characteristics of temperature curves, which vary significantly between cycles and exhibit distinct thermal properties depending on the charging rate. Unlike capacity, voltage, and current, which maintain relatively consistent patterns across different C-rates, temperature profiles show more significant variability, making them more challenging to predict for untrained conditions [
26].
Compared to previous FNN, CNN, and LSTM models, the Seq2Seq model demonstrated superior performance in predicting the untrained 1C sample, achieving lower RMSE values and higher curve-fitting accuracy. This improvement indicates the Seq2Seq model’s enhanced capability for reliable lifespan prediction. A key advantage of the Seq2Seq model in the context of RUL prediction is its ability to forecast not only the discharge capacity for a specific cycle but also to predict subsequent cycle data. This feature significantly expands its applicability compared to prior models, enabling more comprehensive long-term battery performance predictions.
Despite these advancements, the Seq2Seq model faces challenges, particularly in potential data loss during normalization when handling input vectors of uniform dimensions. However, this limitation could be addressed by incorporating data transformation techniques inspired by CNN-based image learning models, which may help preserve important features during normalization.