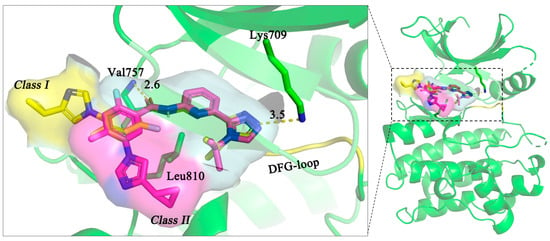
4.3. Binding Free Energy (BFE) Calculation by Molecular Dynamics
4.4. General Route of Chemical Synthesis
1H and 13C spectra were collected on 500 MHz NMR spectrometer (Bruker AVANCE). Chemical shifts for protons are reported in parts per million (ppm) downfield and are referenced to residual protium in the NMR solvent (CDCl3 = δ 7.26). Chemical shifts for carbon are reported in parts per million downfield and are referenced to the carbon resonances of solvent (CDCl3 = δ 77.16). Data are represented as follows: chemical shift, multiplicity (br = broad, s = singlet, d = double, t = triplet, q = quartet, m = multiplet, heptet using full name), coupling constants in Hertz (Hz) and integration.
High-resolution mass spectra (HRMS) were collected using a Waters XEVO G2-S Q-TOF-MS mass spectrometer (Waters Corporation, Boston, MA, USA) in positive mode using MeCN/H2O; I Class liquid chromatograph; ACQUITY UPLC HSS T3 C18 (2.1 × 100 mm, 1.8 μm) chromatographic column; and MassLynxV4.2 analysis software.
Analytical thin layer chromatography (TLC) was performed on precoated silica gel GF254 HPTLC plates (5 × 10 cm2) purchased from Yantai Jiangyou Chemical Co., Ltd. (Yantai, China). The developed chromatogram was analyzed by UV lamp (254 and 365 nm). The non-UV active compounds were generally visualized through placing the plates in a sealed TLC tank containing iodine and silica gel (the 160–200 mesh mentioned above), if necessary, with the aid of a heating gun. The progress of reaction was also monitored by TLC stained with 5% v/v ethanol aqueous solution of concentrated H2SO4 and estimated in a concentration- and time-dependent manner.
Pyrrolidine (99%) was supplied by Shanghai Macklin Biochemical Technology Co., Ltd. (Shanghai, China) Phenyl chloroformate (98%) was purchased from Shanghai Aladdin Biochemical Technology Co., Ltd. (Shanghai, China) 6-(Trifluoromethoxy)indoline (98%), 6-methoxyindoline (98%), 5-(trifluoromethyl)indoline (97%), 1,2,3,4-tetrahydroquinoline (99%), 1,2,3,4-tetrahydroisoquinoline (98%), 6-(4-isopropyl-4H-1,2,4-triazol-3-yl)pyridin-2-amine (IPTPA, 95%) and N,N-diisopropylethylamine (DIPEA, 99%) were obtained from Shanghai Bidepharm. 5-Methoxyindoline (95%) was provided by Shanghai Leyan Co., Ltd., Shanghai, China.
4.5. Expression and Purification of ASK1
The catalytic domain of ASK1 (encoding residues 659–951) was modified to include an N-terminal 6XHis tag and cloned into expression vector, pMCSG7. The recombinant human ASK1 protein was expressed in E. coli Rosetta2 (DE3) in LB medium, containing 100 µg/mL ampicillin and 34 µg/mL chloramphenicol. A total of 2 mL overnight culture was diluted 100-fold into 200 mL LB and grown at 37 °C with shaking at 200 rpm until the OD600 reached 0.8. Subsequently, 0.5 mM IPTG was added, and protein expression was induced overnight at 20 °C.
The pellets were collected by centrifugation and resuspended in HEPES buffer (50 mM HEPES, 300 mM NaCl). After adding ddH2O, the suspension was placed on ice and subjected to ultrasonication (3 s pulses with 5 s intervals) for 15 min. The lysate was then separated by centrifugation at 18,000× g for 15 min, and the supernatant was purified using Ni-affinity chromatography columns with a wash buffer (50 mM HEPES, 300 mM NaCl and 25 mM imidazole) and an elution buffer of the same composition but containing 250 mM imidazole. The concentration of the purified protein was estimated using a BCA protein assay kit (Solarbio, Beijing, China).
4.6. ASK1 Enzyme Inhibition Assay
The IC50 value for each inhibitor was determined using the ADP-Glo™ protocol. Inhibitors were prepared as a series of 1:1 serial dilutions (final concentration of 10 μM) in 40 mM HEPES buffer (pH 7.5) containing 20 mM MgCl2, 0.1 mg/mL BSA, 50 μM DTT and 5% DMSO.
The kinase assays were conducted in a 5 μL volume containing the following final concentrations: 6.25 ng/μL active ASK1, 25 μM ATP and 0.1 μg/μL MBP. The reaction was terminated by adding 5 μL of ADP-Glo reagent and incubated at room temperature for 40 min. Then, 10 μL of kinase detection reagent was added, and the mixture was incubated for an additional 30 min. Luminescence was measured using a VICTOR Nivo microplate reader (PerkinElmer, Waltham, MA, USA), and the concentration–response curve and half-maximal inhibitory concentration (IC50) values were obtained by fitting the data using GraphPad Prism (v.9.0) software.
Source link
Lingzhi Wang www.mdpi.com


