1. Introduction
The reaction center (RC) from the purple bacterium
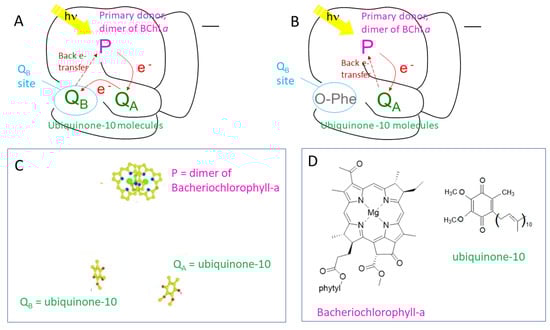
Rba sphaeroides is a membrane protein complex where the initial photochemistry of photosynthesis takes place. The pigments and cofactors involved in these photochemical reactions are inserted in the polypeptide scaffold. When absorbing a photon, a so-called special pair of bacteriochlorophyll-
a molecules (called P), located nearby the periplasmic side of the RC, is excited to P* and is then photo-oxidized, giving an electron, through an intermediate bacteriopheophytin pigment, to a ubiquinone named Q
A placed on the cytoplasmic side of the protein complex. Following this light-induced charge separation P Q
A + hν → P
+Q
A− (which takes place in a time scale of roughly 200 ps), the electron moves from Q
A to a second ubiquinone Q
B (timescale ~ 100 μs) [
1]. When no Q
B is present in the RC (e.g., because it is displaced by a specific inhibitor), Q
A− can recombine with P
+ (reaction rate: k ~ 10 s
−1) [
1].
Several articles have studied the events associated with the photochemical reactions P Q
A + hν
→ P
+Q
A− inside the RC. In particular, several studies show a peculiar protein conformational change (see [
2,
3,
4,
5,
6,
7,
8] as well as the references therein). A pioneering paper [
2] demonstrated that after a nanosecond photoexcitation at 298 K, the RC relaxes from a so-called dark-adapted conformation to a so-called light-adapted conformation. This light-adapted conformation leads to a stabilization of the P
+Q
A− state. Interestingly, the two protein conformations (dark-adapted and light-adapted) can be trapped when the RC is cooled to very low (cryogenic) temperatures either in darkness or under illumination [
2].
It was deduced that at room temperature, the proteins rapidly “adapt” to the altered electric charge distribution generated by the photoinduced charge separation reaction and strongly slow down the electron recombination between P+ and QA−. At 298 K, this dielectric relaxation from the dark-adapted to the light-adapted conformation is believed to take place on a very short timescale, definitely shorter than the P+QA− → P QA charge recombination (around 100 ms).
Several published articles also suggest that, under continuous light, the RC can have further slower conformational changes, on a scale from seconds to minutes [
5,
6,
8,
9,
10]. In particular, the lifetime of the P
+Q
A− state increases with the duration of the continuous light illumination period. This suggests that the persistence of the charge-separated state P
+Q
A− can induce further conformational changes inside the RC. A similar effect (formation of a long-lived “light-adapted” stabilized state) was reported for Photosystem II core complexes from
T. vulcanus after 20 saturating ns laser flashes [
11], suggesting that the possibility of forming “light-adapted” states is common to all Type II RCs [
12]. This is a topic that has been recently debated in the literature [
13,
14].
Time-resolved light-induced difference FTIR spectroscopy is a powerful technique that makes it possible to follow the time evolution of specific molecular chemical moieties inside a protein using specific “marker” IR bands; it is widely used to investigate the photochemistry of photosynthetic RCs [
15].
A key feature in time-resolved light-induced FTIR difference spectroscopy is the detection limit, which depends both on the intrinsic signal size and on the noise level, which depends on the optics, optoelectronics (source and detector), and electronics of the used instrument. Absorbance noise levels at the 10
−6 scale are common in time-resolved FTIR difference spectra recorded on most FTIR instruments (especially commercially available ones). As a consequence, time-resolved FTIR difference spectra reporting signals with ΔA ≤ 10
−5 are very difficult to obtain with a high signal-to-noise ratio [
16,
17,
18]. The situation is even more critical with irreversible reactions [
19], or with rapidly photo-degrading or photo-ageing samples [
20].
Recently, we used rapid-scan FTIR difference spectroscopy in order to understand more in details the stabilization process in RCs under moderately dehydrated conditions, i.e., relative humidity (RH) = 76% [
20].
On the other hand, previous results [
8,
21] have shown that the hydration of the RCs deeply influences the P
+Q
A− → P Q
A recombination rates (both after a saturating flash and after a continuous illumination period).
In this manuscript, we extended our study to RCs under strongly dehydrated conditions, finding striking differences compared to what happens at higher hydration. Time-resolved rapid-scan FTIR difference spectra were recorded after one saturating laser flash and during/after 20.5 s of continuous illumination. Whereas there are indications suggesting formation of a light-adapted state, FTIR spectroscopy suggests that the protein conformational changes taking place under continuous illumination are different from those observed at higher hydration (RH = 76%).
3. Results
FL-TRIR difference spectra after a saturating laser flash are shown in
Figure 4A. All bands decay completely within 200 ms, in a roughly synchronous way. Detailed kinetic analysis (global exponential fitting, 2D correlation analysis) was hampered by the limited number of time-resolved spectra and by baseline correction issues.
It should be underlined that the fast decay in FTIR difference signals in
Figure 4 made it possible to record only 4 FL-TRIR difference spectra after the flash. The accuracy of our analysis somehow suffers from the limited number of spectra.
Figure 5A shows UI-TRIR difference spectra recorded at increasing times after onset of continuous light. As can be seen, almost no time evolution is observed in shape or band intensity, meaning that a photo-accumulated state is already formed 2 s after the beginning of the illumination period, and this state does not seem to evolve significantly in the following 16.4 s. This is confirmed by the time evolution of the marker bands at 1748 cm
−1 (positive; attributed to the 10a ester C=O vibration [
29]), 1717 cm
−1 (positive; attributed to the 9-keto C=O vibration [
29]), and 1666 cm
−1 (negative, attributed to a protein conformational change associated with the formation of Q
A− (The same band is placed at 1670 cm
−1 in RCs in solution [
27] and at 1668 cm
−1 in RCs under moderately dehydrated condition (RH = 76%) [
8]) (see
Figure 5B).
Figure 6A shows the AI-TRIR difference spectra recorded after the end of the 20.5 s continuous illumination period. Interestingly, whereas it seems that the decay of the 1748 cm
−1 P
+ marker band is slower compared to spectra recorded after one flash (but not for the 1717 cm
−1 band, where small contributions from the protein could exist), this does not seem to be related to a peculiar conformational change in the protein, at least not to the one responsible for the 1666 (-) cm
−1 band, which conversely seems to decay even faster compared to the time-resolved spectra recorded after one flash (FL-TRIR difference spectra).
Here, it is however important to underline two points: First, the signal size in these spectra is very small (~10
−5 a.u.) and, differently from spectra recorded under continuous illumination (
Figure 5), no intensive averaging using large time windows is possible. On the other hand, the experiment was repeated every 100 s, so that it was not possible to achieve the same number of cycles of measurement as in FL-TRIR difference spectra (
Figure 4). Therefore, the non-optimal signal-to-noise ratio reported in
Figure 6 should be considered both as a good achievement, in technical terms, but also a limiting factor, in the exploitation of experimental data.
Second, the fast decay in FTIR difference signals in
Figure 6 made it possible to record only three AI-TRIR difference spectra after the end of the illumination period. Taking the last spectrum recorded during the illumination period (
Figure 5) as equivalent to a hypothetical spectrum at t = 0, it is possible to try to fit the decay of marker bands with four points to an exponential decay (see
Figure 6B). The accuracy of these fittings will anyhow suffer from the very limited number of points, as in the case of FL-TRIR difference spectra.
In
Figure 7, we compare the UI-TRIR difference spectrum recorded during continuous illumination with the first spectrum FL-TRIR difference spectrum recorded after one saturating flash. This comparison should evidence the possible formation of a light-adapted state after 18.4 s of continuous illumination, compared to the state formed after a single 7 ns saturating laser pulse. As can be observed, the two difference spectra are not perfectly equivalent. The double-difference spectrum (black trace in
Figure 7) highlights that the major changes concern the amide I region (1690–1610 cm
−1), even though clear changes can also be observed in the 1780–1690 cm
−1 region.
4. Discussion
Formation of light-adapted states in bacterial photosynthetic RCs have been reported in several conditions. In particular, our group [
8] reported that in moderately dehydrated conditions (RH = 76%) and in strongly dehydrated conditions (RH = 11%), exposure to a 20 s continuous illumination at 297 K slows down the electron transfer backreaction P
+Q
A− → PQ
A in both cases. In the same work, relying on static light-minus-dark FTIR difference spectra recorded between 4000 and 1000 cm
−1, we deduced that the response of the protein under illumination at the two hydration levels was not the same [
8].
Recently, we have shown that in bacterial RCs at RH = 76% and 281
K the protein backbone response is at least partially (negative band at 1668 cm
−1 attributed to a conformational change related to the monoelectronic reduction in Q
A (corresponding to the 1666 cm
−1 band in the present paper)) perfectly synchronous with the electron transfer backreaction, both after a 7 ns saturating flash and after a 20.5 s continuous illumination period [
20].
The results presented here suggest that the situation is dramatically different in strongly dehydrated RCs (RH = 11%) in the following points:
- (1)
After a flash, the 1666 cm−1 negative band (equivalent to the 1668 cm−1 band at RH = 76%) decays with roughly the same kinetics of the 1748 cm−1 characteristic of P+ (in other terms, the 1666 cm−1 conformational change relaxes almost synchronously with the back electron transfer reaction).
- (2)
After 20.5 s, the 1666 cm−1 negative band seems to decay significantly faster than the band at 1748 cm−1 characteristic of P+ (this not only suggests that the 1666 cm−1 conformational change relaxes faster than the back electron transfer reaction, but also that this conformational change does not seem to be related to the formation of the light-adapted state). Interestingly, this band seems to decay faster than after a single saturating flash.
- (3)
According to the kinetic fitting of all the time-resolved FTIR difference spectra, the lifetime of the P
+Q
A− state is just slightly prolonged after 20.5 s of continuous illumination as compared to the lifetime after a laser flash. This result is at variance with the results obtained by time-resolved Vis spectroscopy by our group (where a strong stabilizing effect was observed [
8]), and is likely to be related to the difference in temperature at which the experiments were carried out (281 K for time-resolved FTIR spectroscopy reported in the present manuscript, 297 K for time-resolved Vis spectroscopy).
- (4)
Compared to the results obtained at RH = 76%, other mechanisms seem to be responsible for the (relative, if any) stabilization of the P
+Q
A− state under continuous illumination at RH = 11%. The double-difference spectrum in
Figure 7 suggests that proton movement involving protonation/deprotonation events involving side chains of Glu and Asp amino acids in the 1775–1690 cm
−1 region might be involved. It is interesting to note that in this region, the double-difference spectra “light-adapted minus non-light adapted” obtained at RH = 76% and at RH = 11% differ most. At RH = 76%, positive peaks are observed at 1752, 1733, and 1721 cm
−1 and negative peaks are observed at 1744 and 1694 cm
−1 [
20]; at RH = 11%, positive peaks are observed at 1772, 1746, 1728, and 1720 cm
−1 and negative peaks are observed at 1754 and 1699 cm
−1. Conversely, at lower wavenumbers (in the amide I region), the pattern in the two double-difference spectra is strikingly similar, the double difference spectrum obtained at 76% showing positive peaks at 1679, 1667, and 1630 cm
−1 and negative peaks at 1654 and 1646 cm
−1 [
20], and the double-difference spectrum obtained for RH = 11% showing positive peaks at 1681, 1666, and 1634 cm
−1 and negative peaks at 1658 and 1643 cm
−1.
- (5)
This suggests that the light-adapted RC has a similar response of the protein backbone at the two hydration levels (RH = 76% and 11%) but a different response in term of proton movements involving Glu and Asp side chains.
- (6)
In
Figure 6, there are bands lying in the amide I region (positive bands at 1658 and 1643 cm
−1 and negative bands at 1651 and 1634 cm
−1) that seem to be roughly synchronous—in decay—to the ones reflecting progressive reduction in the primary donor (from P
+ to P). As mentioned above, peaks at these positions can also be observed in the double-difference spectrum in
Figure 7. Unfortunately, no precise identification for these band exists to date. For the 1634 cm
−1 negative band, a possible attribution to an internal water molecule can also be proposed.
On the basis of the points listed above, we can propose, as a working hypothesis, that at RH = 76% [
8,
20], the protein backbone response is stabilized by water molecule displacements that are absent at RH = 11% (as observed in [
8]), most likely due to a shrinking effect at the most dehydrated condition and possibly to the lack of specific water molecules in key position inside the RC. This does not allow for the formation of a real light-adapted state conformation at RH = 11% (at least at 281 K). In addition, a protein response can be seen by the movement of protons responsible for the protonation/deprotonation of Glu and Asp side chains at both hydration levels. This kind of protein response seems to be not the same in the two cases.
5. Conclusions
In this work, we applied time-resolved FTIR difference spectroscopy to investigate the protein response at RH = 11% at 281 K both after a flash and during/under 20.5 s of continuous illumination. Spectra recorded after a laser flash show a protein recovery almost synchronous to the electron transfer backreaction. Conversely, spectra recorded after 20.5 s of continuous illumination basically show no difference in kinetics of electron transfer compared to spectra recorded a laser flash. This means that the mechanism of formation of a light-adapted stabilized state is less effective compared to the same hydration level at 297 K (as observed before [
8]) and to the RH = 76% hydration level (both at 281 K [
20] and 297 K [
8]). It is interesting to notice that in spectra recorded after 20.5 s of continuous illumination, the 1666 cm
−1 band seems to decay faster than marker bands for the electron transfer backreaction P
+Q
A− → PQ
A.
FTIR double-difference spectra (obtained by subtracting a flash-induced FTIR difference spectrum from an FTIR difference spectrum recorded after 20.5 s illumination) suggest that at RH = 11% and 281 K, the light-adapted state formed after 20.5 s of continuous illumination is different from the one observed at RH = 76% [
8,
20]. A possible interpretation is that at RH = 11% and 281 K, the protein response is modified by the fact that at this hydration level and at this temperature, only protons can move easily, and movement of water molecules is hampered compared to at RH = 76%. This makes the formation of a real light-adapted stabilized state unfeasible.