1. Introduction
Over the past several decades, automotive manufacturers have worked to create safer, more fuel-efficient cars, driven by consumer demands and government regulations. Advances in body-in-white manufacturing methods have resulted in vehicles with more power, fewer emissions, and better fuel efficiency [
1]. To reach the corporate average fuel economy (CAFE) standard set by the government, manufacturers have shifted to using high-strength steels, aluminum, and composite materials to produce vehicles that meet or exceed the current safety standards, while reducing their weight and increasing their fuel economy [
2].
Advanced High-Strength Steels (AHSSs) are produced by carefully controlling the cooling rate through the austenite phase range in either a hot mill or annealing furnace. AHSSs are typically multiphase steels containing various combinations of ferrite, martensite, bainite, and retained austenite (RA). Their high tensile and yield strengths, combined with their reasonable ductility, have made AHSSs attractive for lightweighting efforts. AHSSs typically have a tensile strength of over 600 MPa, though many now exceed 1000 MPa. The list of common AHSS types includes dual-phase (DP), transformation-induced plasticity (TRIP), martensitic, and complex-phase (CP) steels. Each alloy has a specific set of characteristics that qualify it for various structural requirements of a passenger vehicle, including energy absorption, fatigue, strength, and formability [
3]. Improved combinations of strength and ductility can be achieved via fine and complex microstructures [
4] by balancing the contrast in strengths between the phases, and by promoting the presence of metastable RA at room temperature, which transforms during deformation to increase ductility [
5]. TRIP steels, with their significant RA content, are specifically designed to provide both high strength and improved ductility, necessary for forming into the complex shapes required for vehicles [
6,
7].
TRIP-assisted bainitic-ferritic (TBF) steels utilize all of the methods mentioned above to arrive at a desirable balance of properties. In this study, the performance of TBF 1180 steel is compared to a quenched and partitioned Q&P 1180 steel [
8]. The process to create Q&P steel consists of quenching from the austenite region to below the martensite start temperature, followed by a partitioning treatment to enrich the remaining austenite with carbon, thereby stabilizing it to room temperature [
9]. The manufacturing process for TBF steel is similar to that of the Q&P steels; the main difference is an austempering temperature that is much closer to the martensite start temperature [
10]. TBF steels are made by hot rolling, or annealing after cold rolling, followed by austempering at a temperature within the bainite transformation range [
11]. This process results in a microstructure where the RA is less blocky and more often of a lathe or film morphology compared to Q&P steels. TBF steels have fatigue limits and an impact toughness greater than those of other steels of similar strength [
11]. Their composition also differs from other TRIP steels, with greater levels of silicon to prevent the formation of cementite.
The objective of the current research is to study the relationships between the deformation path, transformation rate of RA, and associated elongation to failure in TBF 1180 steel. Recent work has shown that a gradual, even transformation rate of RA is most conducive to maximizing ductility for a given RA fraction [
12,
13]. As RA transforms, as a function of plastic strain, the associated work hardening delays necking and increases the formability. As such, this study will focus on the effect of the strain path on the transformation rate in TBF steel, where the RA content is measured using electron backscatter diffraction (EBSD) at different levels of strain using both ex situ and in situ interrupted testing. A comparison to prior work in a quenched and partitioned (Q&P) 1180 steel [
14] is also discussed, where the RA grain sizes, morphologies, and volume fractions between the two alloys were analyzed in order to gain insight into RA transformation rates and associated ductility during plastic deformation along different strain paths.
2. Materials and Methods
TBF 1180 specimens were prepared for deformation along three strain paths: tensile, biaxial, and plane strain. The TBF 1180 steel has nominal composition, as shown in
Table 1.
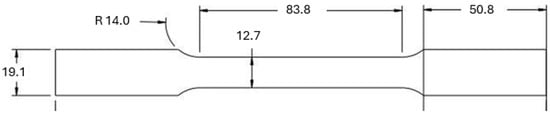
All specimens were cut using either wire EDM (electric discharge machining) or a water jet to prevent transformation of austenite, which could occur with less delicate cutting processes. Uniaxial tension specimens were cut from uncoated 1.0 mm TBF 1180 sheets using the ASTM E8 guideline for flat sheet specimens, as shown in
Figure 1.
Biaxial and plane-strain deformation was applied using standard limiting dome height (LDH) tooling, see
Figure 2a. Biaxial tension specimens were square sheets, 200 mm per side, that were fully clamped by the LDH tooling (
Figure 2b). Plane-strain specimens were 200 mm in length and 70 mm in width (
Figure 2c), where the width was determined by testing different widths, and choosing the width that provided the minimum dome height at failure.
Lubrication between the LDH punch and the sheets was facilitated by mineral oil and a sheet of Teflon. In addition to the standard-size uniaxial, plane-strain, and biaxial specimens, some miniature tensile specimens, with gauge lengths of 20 mm and widths of 2 mm, were prepared for in situ tensile experiments in an SEM (scanning electron microscope), as shown in
Figure 3.
All specimens prepared for microscope analysis were mounted on metal pucks and ground/polished using silicon carbide discs with grits of 400, 600, 800, 1200, and 1200-fine. The final thickness of the in situ specimens after polishing was between 0.3 and 0.4 mm, to avoid exceeding the 800 N limit of the microscope tensile stage. Specimens were then removed from the pucks and electropolished using an electrolyte with a composition of 25 mL perchloric acid, 75 mL butanol, and 125 mL methanol. The solution was chilled to 10 °C by submerging the vessel in ice water. A sacrificial metal plate, acting as the cathode, was placed in the solution and the power supply was set to 20 volts. The specimen, acting as the anode, was submerged in the solution for 18 s, at which point the power supply was switched off. The specimen was then removed, rinsed with ethanol and dried with compressed air to prevent residue.
In situ tensile tests in the SEM were performed without fiducial marks, because it has been noted that even focused ion beam (FIB) milling (which is generally less invasive than micro-indentation methods) caused localized austenite transformation [
14,
15]. Scans were aligned using recorded microscope coordinates and natural features in the specimen microstructure. Scans were taken at multiple locations at zero percent strain, followed by 0.2 mm displacement increments, until failure.
The LDH experiments for plane-strain tension and biaxial tension were performed on an Interlaken hydraulic press with a clamp load of 334 kN and a maximum punch load of 223 kN. The tooling included small lock beads to restrain the sheet, while preventing it from tearing, and a hemispherical punch with 100 mm diameter. The macroscopic uniaxial tensile experiments were performed on an Instron test frame with a 50 kN load cell. Strain maps on the surface of each sheet were obtained by digital image correlation (DIC), in which a random speckle pattern was applied to the blank sheet specimens by lightly spraying black paint over a white base coat. Then, during the press forming experiments, images of the speckled sheet surface were taken every second and the Aramis DIC software, GOM Correlate, was used to compute the strain maps for each increment of deformation captured by the cameras [
16]. The DIC strain data were used to verify that the strain paths were correct in each case, as shown in
Figure 4. Biaxial tension and uniaxial tension strain paths were confirmed to be proportional, while the plane-strain path was nearly proportional, exhibiting a small negative minor strain by the end of the test. Specimens were removed for EBSD (electron backscatter diffraction) microscopy in locations associated with the correct deformation, after mapping out the DIC data on the deformed sample.
The microscope used for EBSD was an FEI Apreo scanning electron microscope (SEM) equipped with an EDAX Digiview camera. The specimens were placed at a working distance between 17 and 20 mm with a 70-degree tilt angle, relative to an electron beam created with 20 kv accelerating voltage and 1.6 nA beam current; a 0.08 micron step size was used, across a 17.5 × 17.5 micron scan region. The software used to analyze the EBSD patterns was OIM Analysis 8.1. The RA area percentage (which correlates to volume fraction) was recorded for each specimen, along with the level of strain and the type of strain path applied.
The EBSD images that will be shown in the results section display many points along the GBs, which appear as strings of black dots in the images; these appear to have been misindexed in the EBSD scans—a common occurrence due to mixed patterns arising at GBs. Indexing is also often compromised in areas of high dislocation density such as hard phases of steel. Hence, a cleaning routine was applied to the resulting EBSD data to reduce the amount of noise being interpreted as austenite grains. First, points with a confidence index of less than 0.1 were disregarded. Then, Neighbor Pattern Averaging Re-indexing (NPAR) was applied using OIM Analysis v 8.1, followed by grain dilation [
17]. NPAR improved the indexing success rate of the scans, and grain dilation eliminated grains of size 3 pixels or less. The same routine was applied to all scans in this study. As discussed in a prior study by the authors [
14], while X-ray diffraction provides slightly higher values for RA phase identification compared to EBSD, the trends were the same for both methods.
3. Results
The deformation experiments along the uniaxial tension, plane-strain tension, and biaxial tension strain paths provided forming limits that were measured using DIC, as previously discussed. In each case, strains were measured from the beginning of the test until failure. An example LDH biaxial tension test is shown in
Figure 5, where a point near the apex of the dome, at the point of failure, was used to calculate the limit strain, which is the largest uniform true strain the material can experience prior to necking.
Limit strains were calculated by taking the derivative of the strains with respect to time and then plotting strain rate as a function of time, using a best fit line to determine when localization initiated. The plots of the strain rate vs. time are shown in
Figure 6 for each strain path. The point at which the strain rate begins to deviate from the line of best fit is considered the onset of necking.
The strains from each load increment prior to the limit strains (associated with onset of necking, as measured by DIC) are plotted to show the strain paths that lead to the forming limits for TBF 1180, as shown in
Figure 7. The forming limit curve is estimated via a smooth locus connecting the three main points of failure for the different strain paths.
In terms of the transformation of RA grains in the TBF 1180, EBSD was used to measure the RA content as a function of the plastic strain. Most of the tests were incremental ex situ measurements of the RA, but one in situ uniaxial test provided confirmation that the ex situ scans were statistically sound, in terms of being able to compare different scans at various strain levels. The phase maps for the in situ uniaxial tension specimen are shown in
Figure 8, where the initial RA content (at 0% true strain) was 6.4%, transforming progressively to 1.3% when the specimen fractured (at 12% true strain). As previously described, similar maps were produced at interrupted strain levels for each of the ex situ deformation strain paths.
Confirmation that the ex situ EBSD scans, where multiple specimens were used and each specimen targeted a different strain level, provided reasonable estimates of the RA con-tent compared to the in situ experiments, where the same area was scanned at each strain level, is shown in
Figure 9. Although the RA measurements are not identical, the trends are clearly similar; the best fit lines to the data are almost identical.
A plot of the remaining RA percentage vs. strain is given in
Figure 10 for the biaxial, plane-strain, and uniaxial tension, where the RA content was tracked vs. effective strain, all the way until specimen failure (as opposed to tracking strain until necking, which is how limit strains are defined). In this case, the EBSD scans were taken near a failure point in the final specimen for each strain path. As can be seen, the strain path type was found to have a strong influence on the RA transformation rate in the TBF 1180 steel. The plane-strain tension provided the most rapid transformation rate, followed by the uniaxial tension, then the biaxial tension. The points plotted in
Figure 10 all start with an unstrained RA content of 6.4% and terminate with various RA contents near the point of failure, where each point on the graph represents an average of at least three measurements. The more gradual rate of transformation for the biaxial tension is consistent with achieving the greatest effective strain before failure, according to current theories regarding the effectiveness of the TRIP effect. However, the more gradual RA transformation for the uniaxial tension, compared with the plane strain, does not result in a greater relative ductility; this implies that some other factor contributes significantly to the ductility experienced under the different strain paths.
Further insights arise by comparing these data with those from similar tests on Q&P 1180 steel, which are documented in [
14]. The forming limits of the 1.0 mm TBF 1180 sheet displayed in
Figure 10 are slightly lower than those for the 1.25 mm thick Q&P 1180 steel [
14]. A comparison of the limit strains, as obtained by DIC, for the two alloys is shown in
Table 2.
The Q&P 1180 steel has a consistent formability advantage over the TBF 1180 steel, even as the yield and tensile strengths are essentially the same for these two alloys. Phase maps at 0% strain for these materials can been seen in
Figure 11, where both images were taken at the same magnification, with the same scan size and step size. When the phase maps in
Figure 11 are examined visually, the morphology of the RA in the TBF 1180 steel appears to be more lamellar than that of the Q&P 1180 steel, which is relatively equiaxed. However, the statistics from the EBSD scans indicate that the RA grain aspect ratios, defined as the minor over major grain dimension, are actually very similar, at 0.40 for the TBF material and 0.42 for the Q&P material. The RA grain size, on the other hand, is clearly larger in the Q&P material, both by visual inspection, and as provided by the EBSD statistics, at 0.12 sq microns for the TBF steel vs. 0.33 sq microns for the Q&P steel.
As previously mentioned, both the TBF 1180 and Q&P 1180 materials exhibit similar properties under uniaxial tension, including yield strength, ultimate tensile strength, and hardening rates, as shown in
Figure 12. The hardening rates are represented by instantaneous n-values, calculated as shown in Equation (1) [
8]:
The TBF 1180 steel does have a slightly lower hardening rate than the Q&P 1180 steel in the middle of the stress–strain curve, and this correlates to its lower uniaxial forming limit, compared to the Q&P steel, shown in
Table 1. Note that the uniaxial tensile curves of
Figure 12a have greater failure strains than indicated by the limit strains of
Table 1, because limit strains correspond to the onset of necking, at levels that are typically lower than failure strains.
The differences in the observed ductility in these two alloys, though relatively small, can at least be partly explained by the microstructures. Prior work has shown that the RA transformation rate under uniaxial tension is greater when the RA morphology is more equiaxed vs. lamellar, as equiaxed grains were shown to transform more readily than lamellar grains [
18]. While the RA transformation rates of the TBF and Q&P materials in this study were similar under uniaxial tension, the plane-strain tension path caused a more rapid depletion of the RA in the TBF 1180 steel at low strains. The transformation curves for both alloys are shown in
Figure 13 for uniaxial, plane-strain, and biaxial tension.
The transformation curve presented in
Figure 13a for the Q&P 1180 steel is confirmed by a prior study on the same alloy, where the absolute values of the X-ray diffraction (XRD) measurements of the RA content were somewhat greater than those shown here, as EBSD typically detected slightly lower levels of RA compared to XRD [
19], but exhibited essentially the same rate of transformation with strain [
20]. Note that when using EBSD, even with a small step size (e.g., 80 nm), some smaller RA grains, usually with a film or fine lathe morphology, may be missed.
Prior studies of TRIP-assisted steels have provided evidence that blocky, equiaxed RA grains transform more readily than lamellar or film-like grains, although such studies often compare the RA transformation between alloys with different microstructures [
19,
21]. One reason for the more difficult transformation of smaller film-like grains is postulated to be that they are often surrounded by martensite, which shields them from local strain levels that can initiate a transformation. Such observations have given rise to the strategy of targeting a mixture of both blocky and lamellar RA grains, in order to smooth the transformation rate, and thus improve ductility [
22] for industrial forming applications, where complex strain paths are common. However, some recent studies on RA transformation in Q&P 1180 steel showed that larger grain aspect ratios and larger grain areas, obtained by EBSD, were related to slower transformation when compared inside a single microstructure, and thus potentially had greater ductility [
23,
24]. The statistics on the current TBF and Q&P materials show that the grain aspect ratios, weighted by grain areas, are 0.40 for the TBF and 0.42 for the Q&P base materials. The average grain areas, for the same scans, were 0.12 sq microns for the TBF material and 0.33 sq microns for the Q&P material. Therefore, quantitatively, the aspect ratios are not very different, but the Q&P material has an RA average grain size almost three times that of the TBF material, as measured by area, which would suggest slower transformation rates, as seen particularly in the plane-strain case in
Figure 13b. These results, along with the slightly greater RA content in the Q&P 1180 material, help to explain its small but consistent formability advantage over the TBF 1180 material, for all three strain paths. Not considered in the current research is the effect of the carbon content of the RA, where higher levels have a tendency to stabilize the RA [
21,
25], or local stresses that partly depend on the phases that surround the RA [
18,
26]. These factors would be very useful to consider in future work, as they could provide further insights into the heat treatments that would be needed to achieve optimal microstructures for industrial formability requirements. If the formability of TRIP-assisted steels with high UTS (as in 1180 MPa and above) can be improved, then autobody parts that are currently being produced using an expensive hot stamping process [
27] (i.e., hot-stamped boron steel for B pillars) could be performed much more efficiently at room temperature.