1. Introduction
State-of-the-art hydrodynamic tools reveal information as to the behaviour of a device in the presence of waves but provide little information on how to improve or optimise the device. We ask whether existing tools can be used to develop a new method to both map and visualise the flow of power, or energy flux, through the hull surface of a WEC. This would reveal the portions of the hull that absorb power and to what degree, as well as portions of the hull that experience force but do not absorb power. It is hoped that this will offer a new fast method to aid iterative design and optimisation.
1.1. Wave Energy Absorption
The following literature review is carried out in the context of LPV and GPV perspectives on wave energy absorption and the relationship between the two.
1.2. Wave Relationships
where and are potential functions that are solutions to the Laplace equation in a volume of fluid V, which is bounded by a surface S; is an infinitesimal element of surface S; and n denotes the normal direction to S and points into the fluid [9].
1.3. Early Wave Energy Literature
1.4. Recent Wave Energy Literature
1.5. Synthesis of Literature Review
We, therefore, ask the following question: is there a practical way to assess, understand, and/or visualise the flow of power through the wave field to the moving body that could improve the understanding, design, and performance of WECs?
1.6. Overview and Layout of Paper
In the remainder of this paper, we develop a method to visualise the flow of energy through the wave field to the moving body. This “energy flux” method aims to map the flow of power from the wave field to a WEC in order to aid in the understanding of the WEC’s performance and behaviour. The terminology ‘flow of energy’ used here is synonymous with power.
2. Materials and Methods
The following presents the materials and methods used in this manuscript. First, we introduce the theory relating the mechanical power in a WEC system to the power passing through the WEC’s wetted surfaces in the wave field. It begins with the general relationship between mechanical power in a system and the power imparted by the fluid acting over the system’s surfaces. The assumptions of linear wave theory are subsequently applied, and equations are decided on for the surface power (energy flux) in terms of the pressure force and velocity.
2.1. Energy Flux Theory
where S is the surface over which the forces act, p is the pressure, is the surface normal, is the shear stress on the surface, is the unit normal vector that defines the direction of the motion of the DOF j, and A is the surface area.
which can be written as
where
is an infinitesimal power or “surface power”, composed of the product of an infinitesimal force and the velocity of the surface at that point.
where
2.2. Linear Wave Theory
where only , p, and are functions of time. In linear wave theory, the total pressure is the sum of the hydrostatic pressure over the mean body surface, , pressure, the diffracted wave, , pressure, and radiated waves coming as a result of motions in each DOF, , and the change in hydrostatic pressure due to motions, .
where is the angular wave frequency. Furthermore, the diffracted pressure can be written as the product of an incident wave amplitude and a unit pressure as follows:
where is the wave direction. Furthermore, the sum of the radiated pressure and delta hydrostatic pressure can be written as the product of the body motion amplitude and the pressure response to a unit amplitude motion as follows:
where the body motion amplitude () is found as the Fourier transform of the body motion time-domain signal:
and Equation (18) becomes
where * denotes the complex conjugate.
3. Results
3.1. Heaving Cylinder
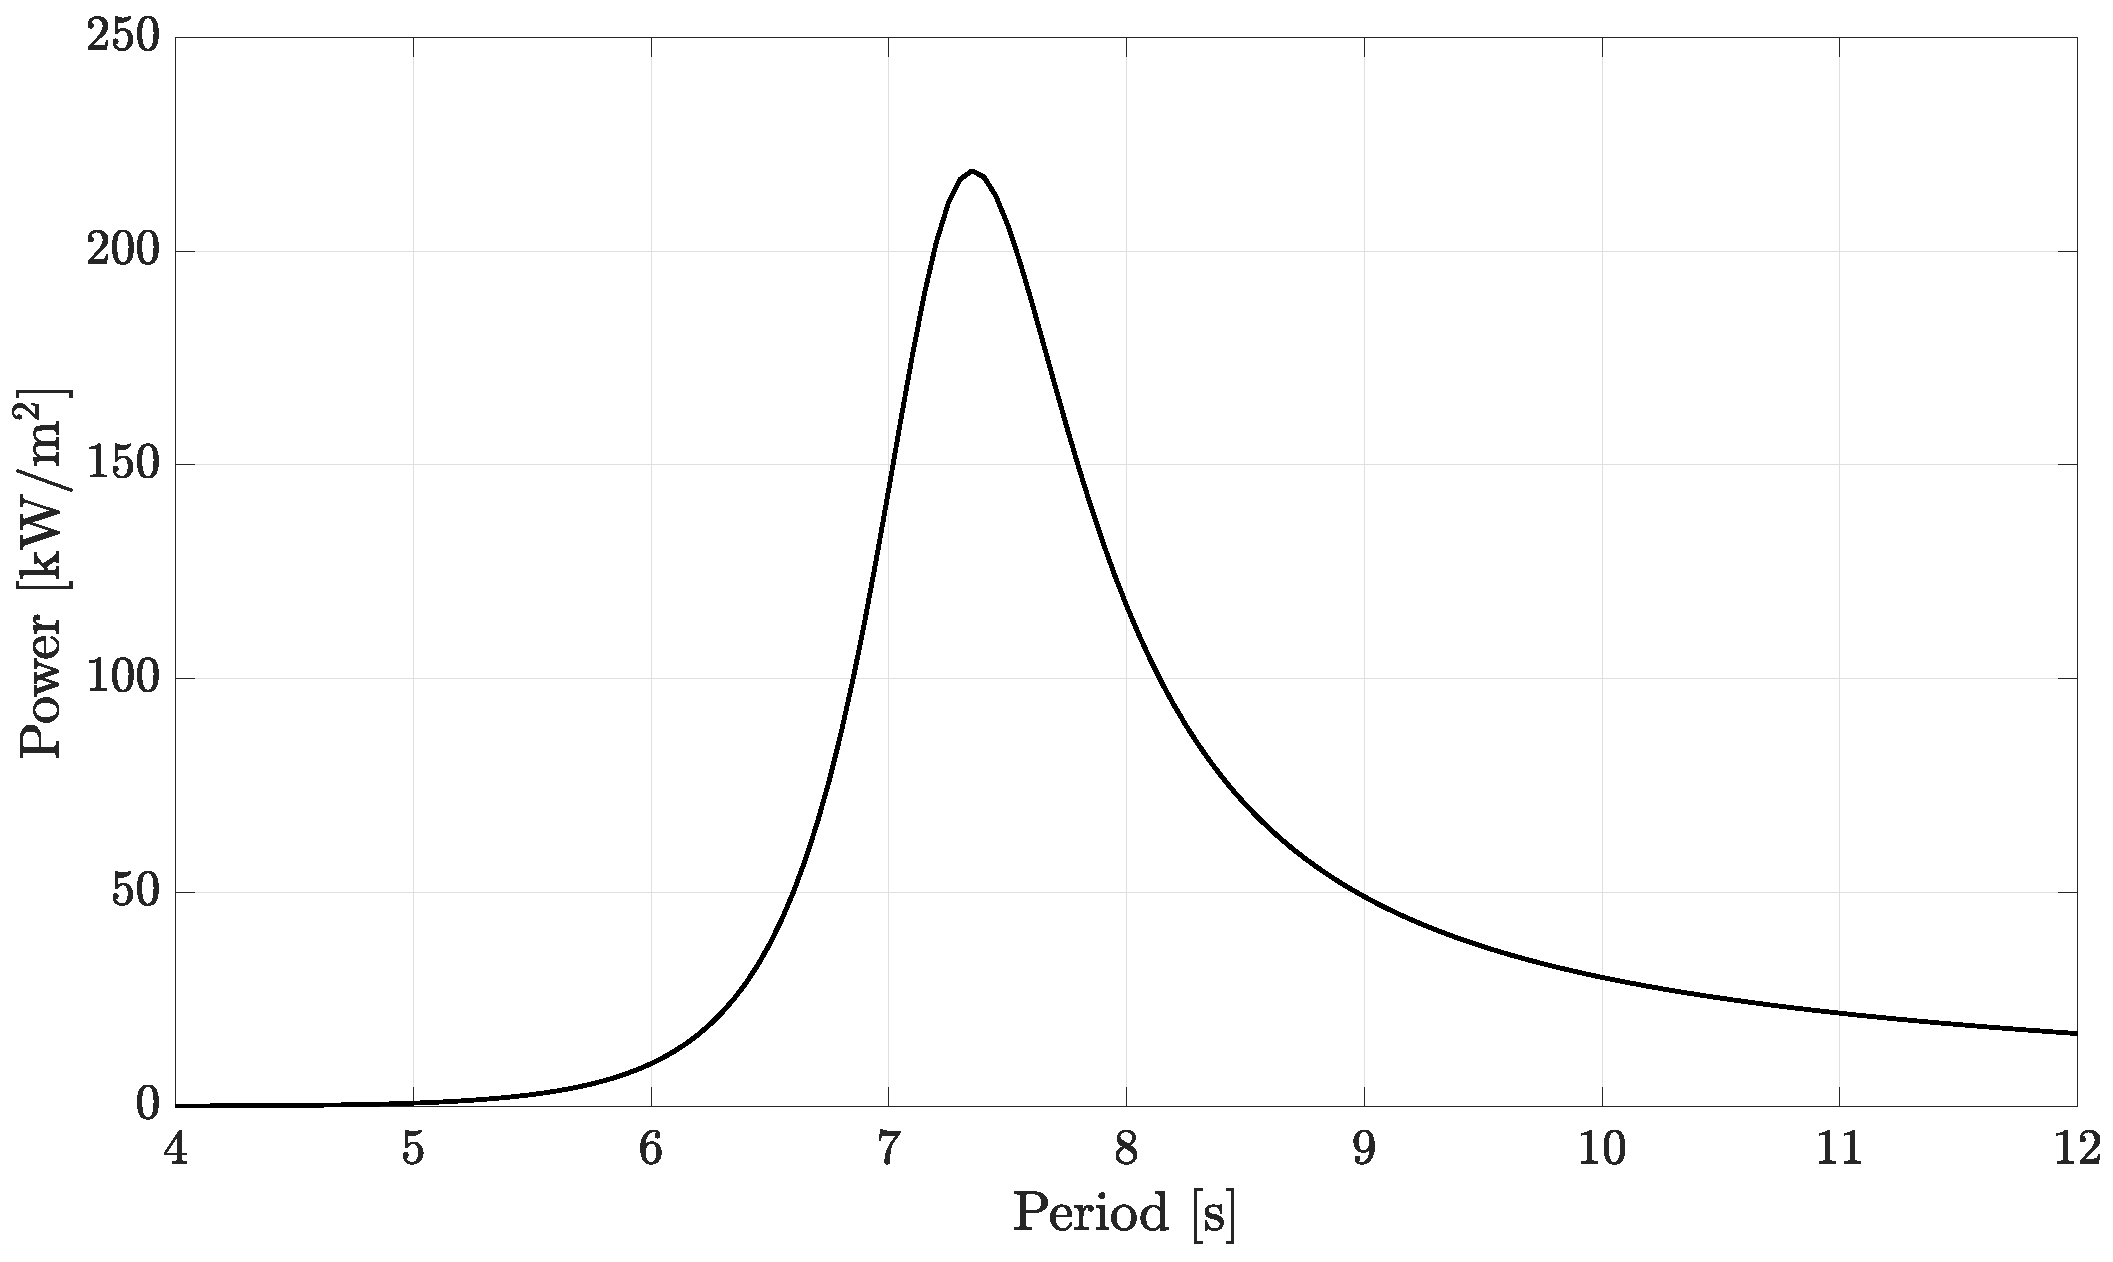
where and are the PTO damping coefficient and complex-valued damped motion, respectively. The power RAO for the cylinder shown in Figure 2 for regular wave periods was s with 7 MN/m applied to the heave motion, which was determined by maximising the peak power. A maximum of 220 kW/m2 occured at .
In the following subsections, the cases of a hinged barge and a pitching flap are used to illustrate further how the energy flux tool can be used to visualise the power surface of a moving body. Firstly, we show how the energy flux magnitude is affected by power take-off for a two-body hinged raft. Then, we use the tool to reveal why a flat pitching flap geometry is a more efficient captor than a curved flap geometry.
3.2. Hinged Barge
3.3. Pitching Flaps
4. Discussion
Specifically for WECs, three aspects are demonstrated in this paper. First, as demonstrated with the heaving cylinder example, the tool is a highly accurate method that can be used to predict power capture. Secondly, as demonstrated with the hinged barge example, the method provides a quick and effective way to analyse energy absorption of a WEC subject to different damping strategies. Thirdly, as demonstrated with the pitching flap example, the tool can be used to find the optimum geometry of a WEC for power absorption.
Such a design engineering tool as the one presented in this work adds significant value to the design process of any WEC, particularly in early design stages, when high experimental costs can prevent WEC technology from being developed. Furthermore, it allows the analysis of the power absorption of WECs with different geometry designs. Finally, the proposed model offers the possibility of coupling the method to other design strategies, such as control engineering and structural design. It is the intention of the authors of this paper that this method contributes to the growth and development of WEC technology across the globe.
5. Conclusions
The fact that power flows from the fluid through the body surface as the product of dynamic pressure and normal velocity is not new to physics. However, it appears not to be widely recognised and has not been applied in an engineering tool. To aid early-stage design, an open-source software tool has been developed to visualise the flow of power (energy flux) from a wave field through the moving body surface of a WEC. The tool takes a frequency domain solution to compute the energy flux surface. This offers a practical method to understand how WECs are working and which parts are radiating or absorbing energy.
The main conclusions of the results presented in this work are summarised as follows:
The energy flux tool can be used to accurately predict power capture of a WEC.
The method can be used to assess the effect of different damping strategies on the power performance of a WEC.
The method can be used for the geometric optimisation of a WEC.
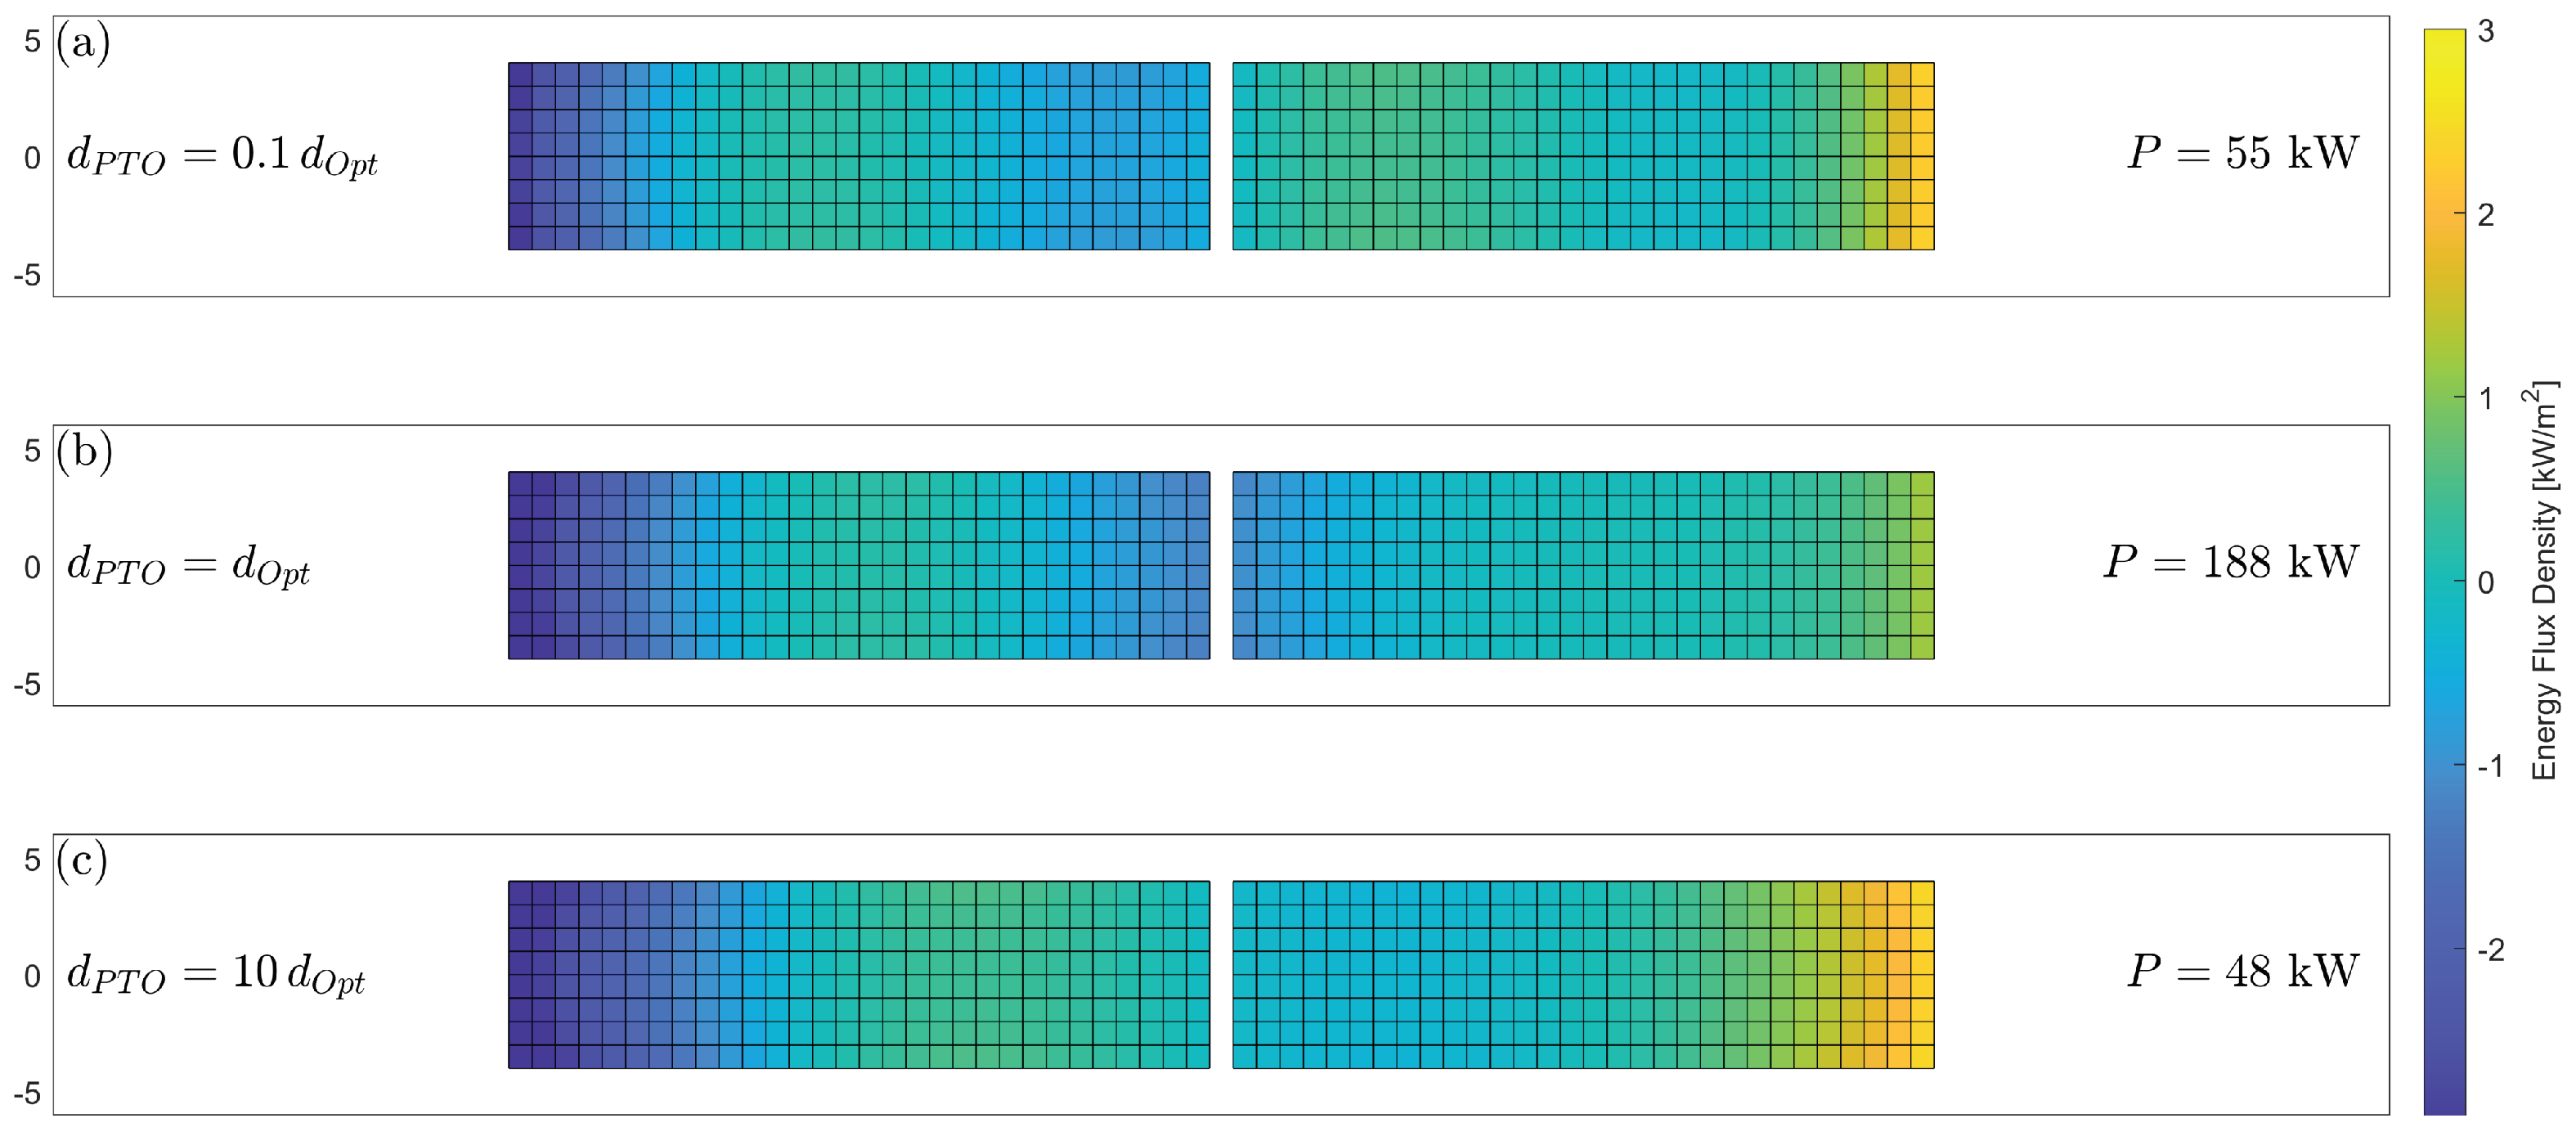
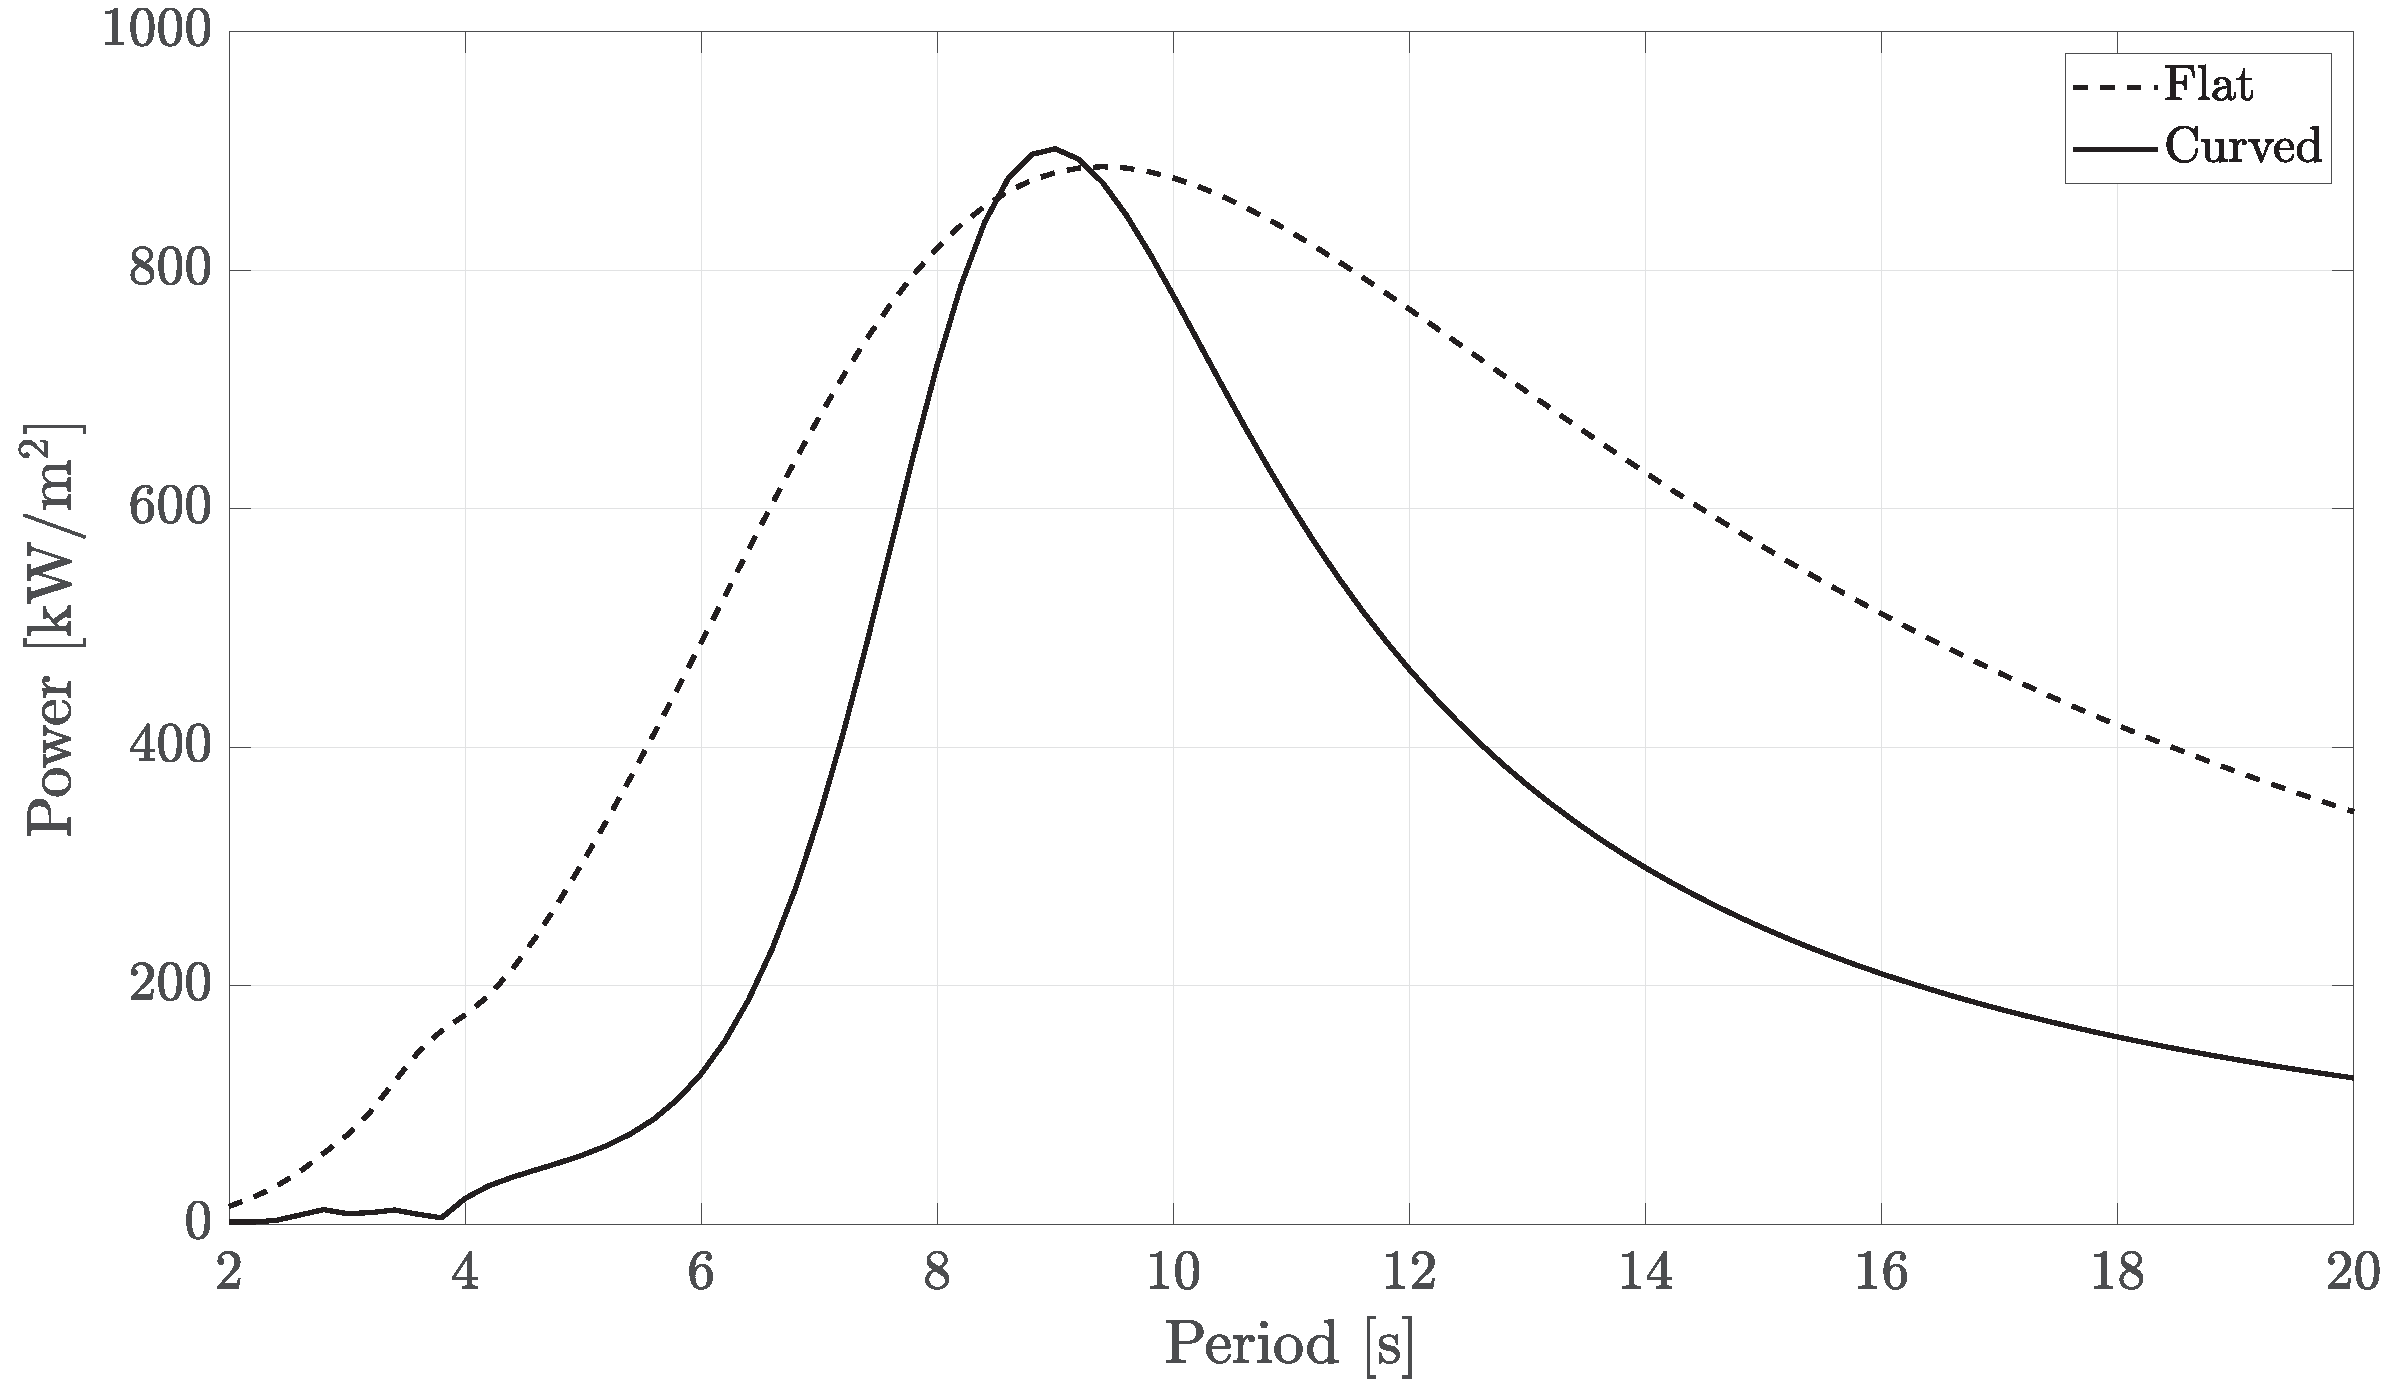
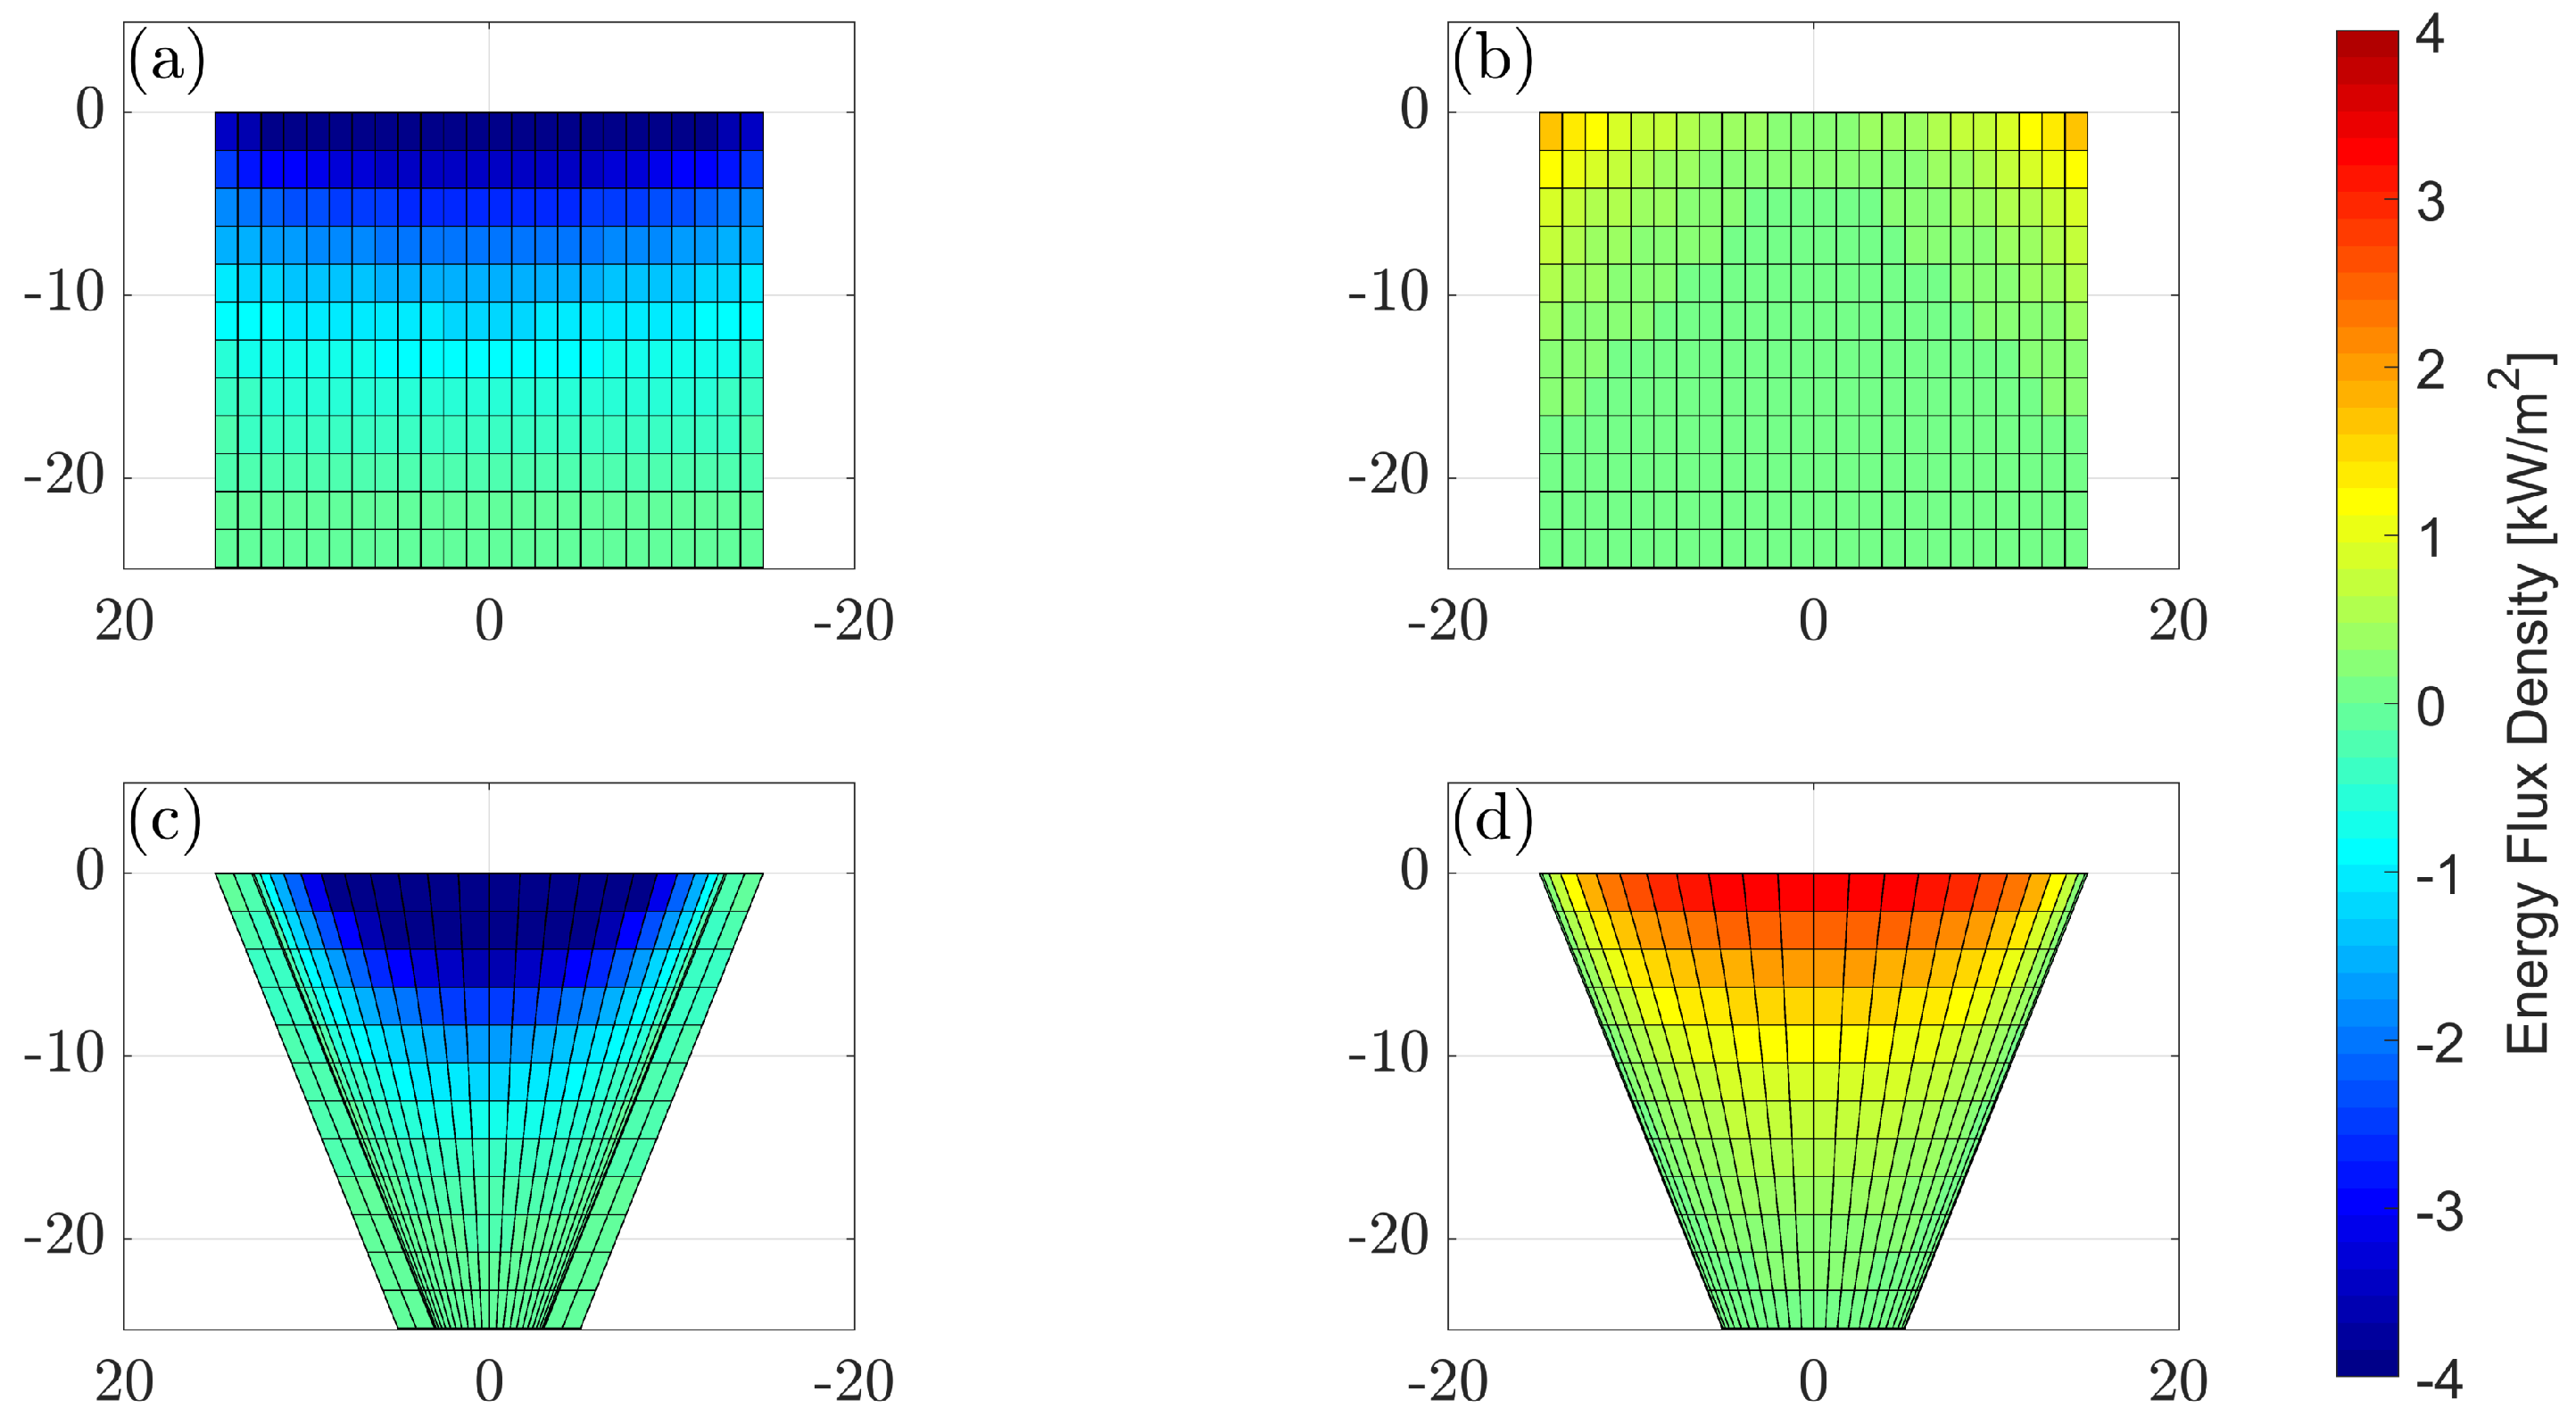
To evidence point 1, the method has been shown to accurately compute both peak power and average power in a wave spectrum compared with the conventional damped body motions approach. Subsequently, for point 2, the tool is used to visualise the hydrodynamic consequence of sub-optimal PTO damping for a twin-hulled hinged barge. This reveals that large portions of the aft body surface radiate power back into the wave field, which is most significant when the PTO is overdamped. Lastly, related to point 3, the performance of two pitching flap geometries is investigated: one flat and one curved, both geometrically comparable with similar peak power RAO values. However, the flat flap has a broader banded response, resulting in a 32% increase in average power capture during a wave spectrum with m and s, compared to the curved flap. By mapping the absorption and radiation energy flux surfaces for each flap, it is revealed that the curved flap radiates significantly more power back into the wave field due to it being curved.
We envisage future employment of the tool by developers to improve their device performance, increasing power absorption and making more efficient usage of materials. Optimisation could be carried out by using the energy flux tool to minimise surfaces which radiate significant portions of power back into the wave field. The tool could also be used to give a measure of efficiency by comparing the power absorbed to the power radiated. Future work will extend the tool to compute energy flux surfaces through a time domain solution.
Author Contributions
Conceptualization, G.T.S., J.C.M. and A.H.; formal analysis, G.T.S., J.C.M., A.H. and A.A.-G.; writing—original draft preparation, G.T.S.; writing—review and editing, G.T.S., J.C.M., A.H. and A.A.-G.; Funding acquisition, G.T.S., J.C.M., A.H. and A.A.-G. All authors have read and agreed to the published version of the manuscript.
Funding
This work is an outcome of the WEC.0 project which has been co-funded through the Ocean Energy ERA-NET by Scottish Enterprise, the Sustainable Energy Authority of Ireland, and the Swedish Energy Agency. This work was also funded by the UK Engineering and Physical Sciences Research Council (EPSRC) as part of the ‘Supergen ORE Impact Hub 2023’ [EP/Y016297/1].
Data Availability Statement
Data are contained within the article.
Acknowledgments
The authors would like to thank the members of the WEC.0 project and the funding bodies that made this work possible.
Conflicts of Interest
G.T.S. is employed by the company Mocean Energy. J.C.M is the Founder and Managing Director of Mocean Energy. A.H. is the Managing Director of Rockall Solutions. The remaining authors declare that the research was conducted in the absence of any commercial or financial relationships that could be construed as a potential conflict of interest.
References
- Wave Energy Scotland. Driving the Development of Wave Energy Technology in Scotland. Available online: https://www.waveenergyscotland.co.uk (accessed on 24 September 2024).
- WEC.0. Better Wave Energy Converters through Early-Stage Performance and Cost Design. Available online: http://wec0.eu/ (accessed on 24 September 2024).
- Falnes, J.; Kurniawan, A. Fundamental formulae for wave-energy conversion. R. Soci. Open Sci. 2015, 2, 140305. [Google Scholar] [CrossRef] [PubMed]
- Newman, J.N. The exciting forces of fixed bodies in waves. J. Ship Res. 1962, 6, 10–17. [Google Scholar] [CrossRef]
- Newman, J.N. The interaction of stationary vessel with regular waves. In Proceedings of the 11th Symposium on Naval Hydrodynamics, London, UK, 28 March–2 April 1976; pp. 491–501. [Google Scholar]
- Budal, K.; Falnes, J. A resonant point absorber of ocean-wave power. Nature 1975, 256, 478–479. [Google Scholar] [CrossRef]
- Evans, D.V. A theory for wave-power absorption by oscillating bodies. J. Fluid Mech. 1976, 77, 1–25. [Google Scholar] [CrossRef]
- McNatt, J.C. Cylindrical Linear Water Waves and their Application to the Wave-Body Problem. Ph.D. Thesis, The University of Edinburgh, Edinburgh, UK, 2015. [Google Scholar]
- Journée, J.; Massie, W. Offshore Hydromechanics, 1st ed.; Delft University of Technology: Delft, The Netherlands, 2001. [Google Scholar]
- Salter, S.H. Wave power. Nature 1974, 249, 720–724. [Google Scholar] [CrossRef]
- Mei, C.C. Power extraction from water waves. J. Ship Res. 1976, 20, 63–66. [Google Scholar] [CrossRef]
- Evans, D.; Jeffrey, D.; Salter, S.; Taylor, J. Submerged cylinder wave energy device: Theory and experiment. Appl. Ocean Res. 1979, 1, 3–12. [Google Scholar] [CrossRef]
- Evans, D.V. Some analytic results for two and three dimensional wave-energy absorbers. In Power from Sea Waves; Academic Press, Inc.: London, UK, 1980; pp. 213–249. [Google Scholar]
- Evans, D.V. Maximum wave-power absorption under motion constraints. Appl. Ocean Res. 1981, 3, 200–203. [Google Scholar] [CrossRef]
- Budal, K. Theory for absorbtion of wave power by a system of interacting bodies. J. Ship Res. 1977, 21, 248–254. [Google Scholar] [CrossRef]
- Folley, M. Numerical Modelling of Wave Energy Converters—State of the Art Techniques for Single Devices and Arrays; Elsevier: London, UK, 2016. [Google Scholar] [CrossRef]
- Wypych, M.; Le-Ngoc, L.; Alexander, K.; Gardner, A. On the application of circular–cylindrical waves to ocean wave power absorption. Ocean Eng. 2012, 40, 69–75. [Google Scholar] [CrossRef]
- Stansell, P.; Pizer, D.J. Maximum wave-power absorption by attenuating line absorbers under volume constraints. Appl. Ocean Res. 2013, 40, 83–93. [Google Scholar] [CrossRef]
- Newman, J.N. Absorption of wave energy by elongated bodies. Appl. Ocean Res. 1979, 1, 189–196. [Google Scholar] [CrossRef]
- Pizer, D.J. Maximum wave-power absorption of point absorbers under motion constraints. Appl. Ocean Res. 1993, 15, 227–234. [Google Scholar] [CrossRef]
- Todalshaug, J.H. Practical limits to the power that can be captured from ocean waves by oscillating bodies. Int. J. Mar. Energy 2013, 3–4, e70–e81. [Google Scholar] [CrossRef]
- Falnes, J. A review of wave-energy extraction. Marine Struct. 2007, 20, 185–201. [Google Scholar] [CrossRef]
- Ermakov, A.; Marie, A.; Ringwood, J.V. Optimal Control of Pitch and Rotational Velocity for a Cyclorotor Wave Energy Device. IEEE Trans. Sustain. Energy 2022, 13, 1631–1640. [Google Scholar] [CrossRef]
- Arredondo-Galeana, A.; Ermakov, A.; Shi, W.; Ringwood, J.V.; Brennan, F. Optimal control of wave cycloidal rotors with passively morphing foils: An analytical and numerical study. Mar. Struct. 2024, 95, 103597. [Google Scholar] [CrossRef]
- MWave. A Water Wave and Wave Energy Converter Computation Package. [Software]. GitHub. Available online: https://github.com/cmcnatt/mwave (accessed on 24 September 2024).
- Tuba Özkan-Haller, H.; Haller, M.C.; Cameron McNatt, J.; Porter, A.; Lenee-Bluhm, P. Analyses of Wave Scattering and Absorption Produced by WEC Arrays: Physical/Numerical Experiments and Model Assessment. In Marine Renewable Energy: Resource Characterization and Physical Effects; Yang, Z., Copping, A., Eds.; Springer International Publishing: Cham, Switzerland, 2017; pp. 71–97. [Google Scholar] [CrossRef]
- McNatt, J.C.; Porter, A.; Ruehl, K. Comparison of Numerical Methods for Modeling the Wave Field Effects Generated by Individual Wave Energy Converters and Multiple Converter Wave Farms. J. Mar. Sci. Eng. 2020, 8, 168. [Google Scholar] [CrossRef]
- Sheng, W.; Tapoglou, E.; Ma, X.; Taylor, C.; Dorrell, R.; Parsons, D.; Aggidis, G. Hydrodynamic studies of floating structures: Comparison of wave-structure interaction modelling. Ocean Eng. 2022, 249, 110878. [Google Scholar] [CrossRef]
- Newman, J.; Malenica, U.; Ouled Housseine, C. Added mass and damping of structures with periodic angular shape. J. Fluid Mech. 2022, 948, R1. [Google Scholar] [CrossRef]
- McNatt, J.C.; Retzler, C.H. The performance of the Mocean M100 wave energy converter described through numerical and physical modelling. Int. Mar. Energy J. 2020, 3, 11–19. [Google Scholar] [CrossRef]
- Caio, A.; Davey, T.; McNatt, J.C. Preliminary hydrodynamic assessment of Mocean Energy’s Blue Star WEC via fast turnaround physical model testing. In Proceedings of the 14th European Wave and Tidal Energy Conference, Plymouth, UK, 5–9 September 2021. under review. European Tidal and Wave Energy Conference. [Google Scholar]
- Cummins, C.P.; Scarlett, G.T.; Windt, C. Numerical analysis of wave–structure interaction of regular waves with surface-piercing inclined plates. J. Ocean Eng. Mar. Energy 2022, 8, 99–115. [Google Scholar] [CrossRef]
- Samuel, J.A.; Venugopal, V.; Retzler, C.; Ma, Q. Hydrodynamic Response of Mocean Wave Energy Converter in Extreme Waves. In Proceedings of the 15th European Wave and Tidal Energy Conference, Bilbao, Spain, 3–7 September 2023; Volume 15. [Google Scholar] [CrossRef]
- Renzi, E.; Doherty, K.; Henry, A.; Dias, F. How does Oyster work? The simple interpretation of Oyster mathematics. Eur. J. Mech.—B/Fluids 2014, 47, 124–131. [Google Scholar] [CrossRef]
- Choiniere, M.; Davis, J.; Nguyen, N.; Tom, N.; Fowler, M.; Thiagarajan, K. Hydrodynamics and load shedding behavior of a variable-geometry oscillating surge wave energy converter (OSWEC). Renew. Energy 2022, 194, 875–884. [Google Scholar] [CrossRef]
- Hillis, A.; Sell, N.; Chandel, D.; Plummer, A. Control of the CCell Oscillating Surge Wave Energy Converter. IFAC-PapersOnLine 2017, 50, 14686–14691. [Google Scholar] [CrossRef]
- Jonkman, J.M.; Matha, D. Dynamics of offshore floating wind turbines—Analysis of three concepts. Wind Energy 2011, 14, 557–569. [Google Scholar] [CrossRef]
- Arredondo-Galeana, A.; Brennan, F. Floating Offshore Vertical Axis Wind Turbines: Opportunities, Challenges and Way Forward. Energies 2021, 14, 8000. [Google Scholar] [CrossRef]
- Zeng, X.; Shao, Y.; Feng, X.; Xu, K.; Jin, R.; Li, H. Nonlinear hydrodynamics of floating offshore wind turbines: A review. Renew. Sustain. Energy Rev. 2024, 191, 114092. [Google Scholar] [CrossRef]
- Scarlett, G.T.; Sellar, B.; van den Bremer, T.; Viola, I.M. Unsteady hydrodynamics of a full-scale tidal turbine operating in large wave conditions. Renew. Energy 2019, 143, 199–213. [Google Scholar] [CrossRef]
- Scarlett, G.T.; Viola, I.M. Unsteady hydrodynamics of tidal turbine blades. Renew. Energy 2020, 146, 843–855. [Google Scholar] [CrossRef]
- Zilic de Arcos, F.; Vogel, C.R.; Willden, R.H. A numerical study on the hydrodynamics of a floating tidal rotor under the combined effects of currents and waves. Ocean Eng. 2023, 286, 115612. [Google Scholar] [CrossRef]
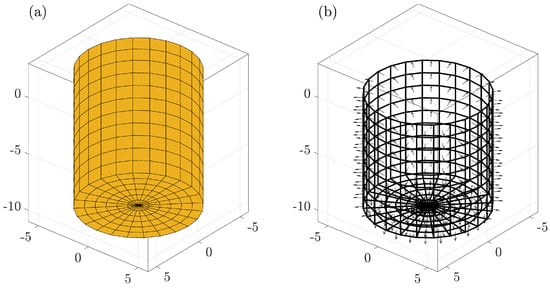
Cylindrical geometry showing (a) complete body mesh and (b) wetted flux surface mesh with normal vectors pointing outwards.
Figure 1.
Cylindrical geometry showing (a) complete body mesh and (b) wetted flux surface mesh with normal vectors pointing outwards.
Power RAO for an optimum damping coefficient of 7 MN/m applied in heave.
Figure 2.
Power RAO for an optimum damping coefficient of 7 MN/m applied in heave.
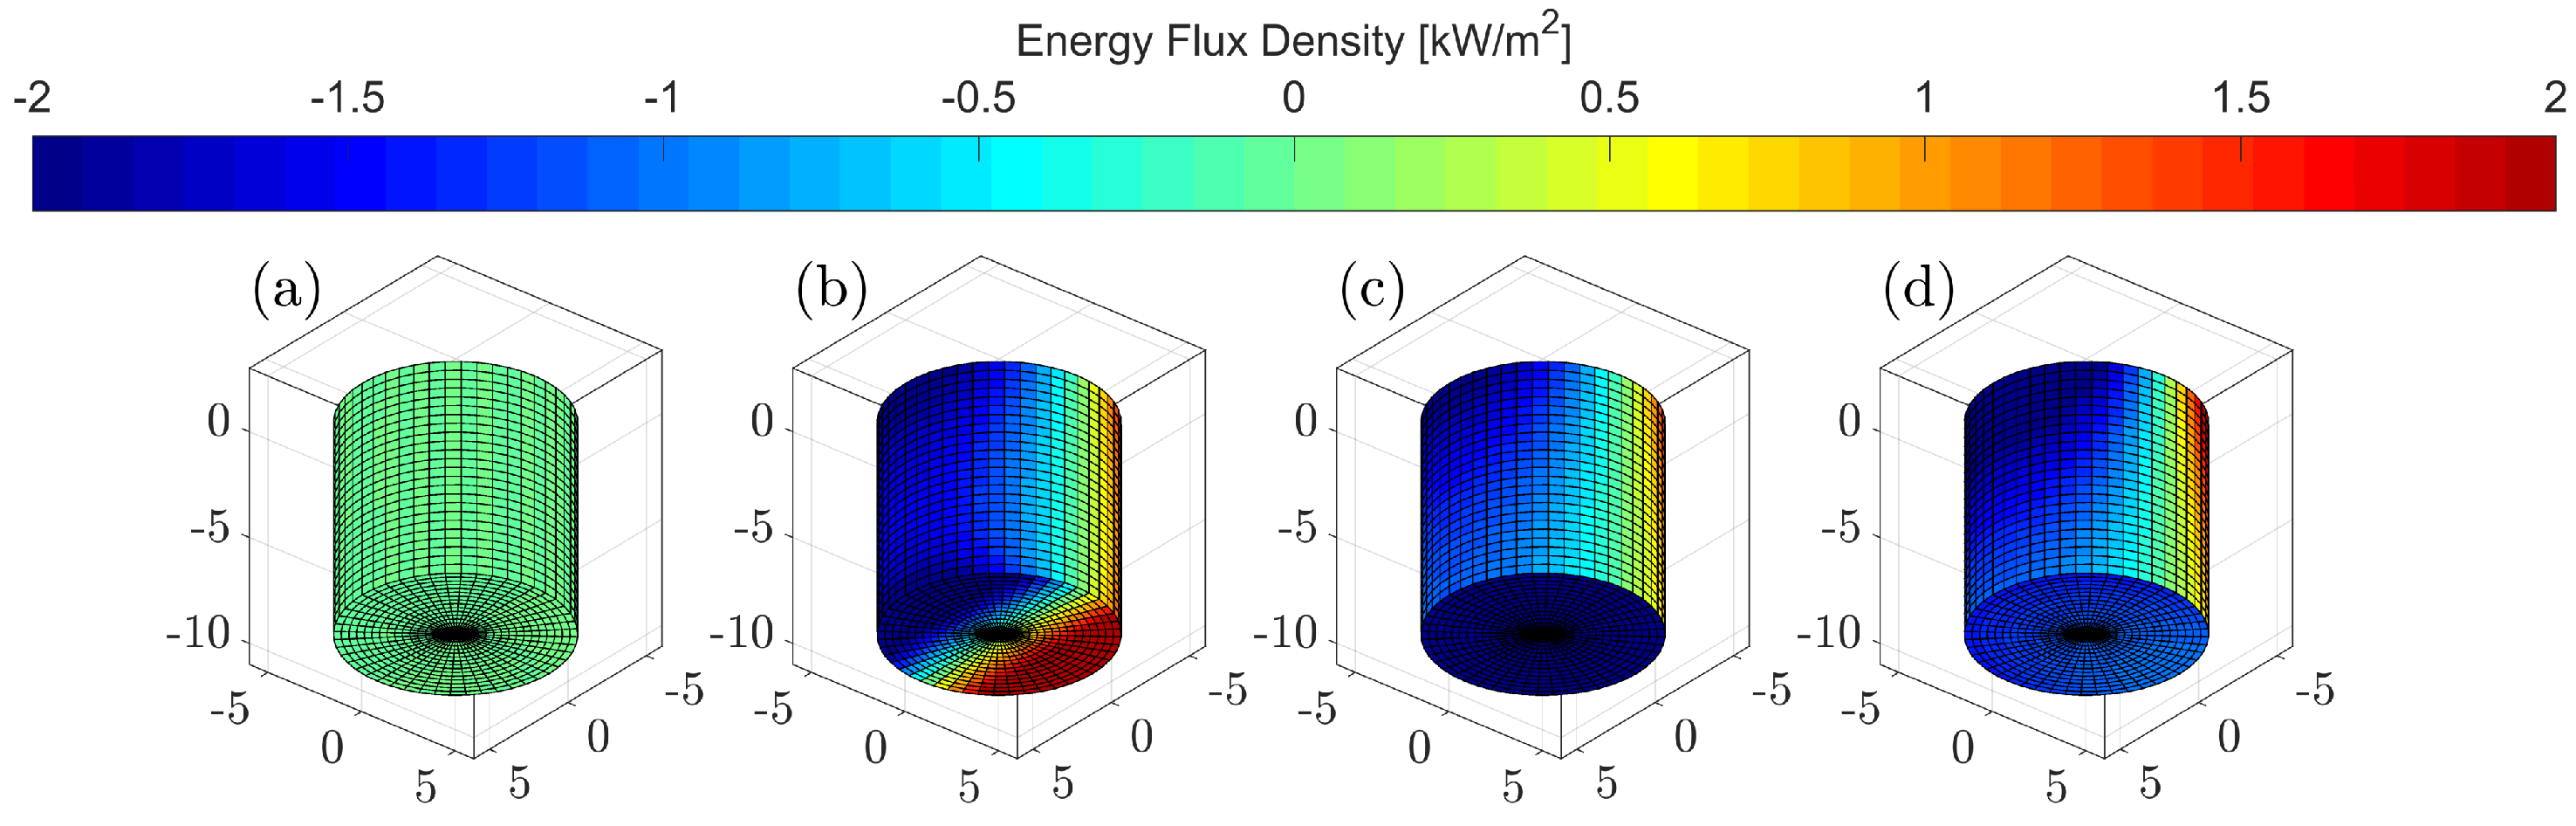
Energy flux surfaces on cylindrical geometry, showing monotonic ( s) cases for (a) diffracted wave field, (b) total wave field, and (c) total wave field with PTO damping in heave, and (d) the average total wave field for a wave spectrum with m and s with PTO damping in heave.
Figure 3.
Energy flux surfaces on cylindrical geometry, showing monotonic ( s) cases for (a) diffracted wave field, (b) total wave field, and (c) total wave field with PTO damping in heave, and (d) the average total wave field for a wave spectrum with m and s with PTO damping in heave.
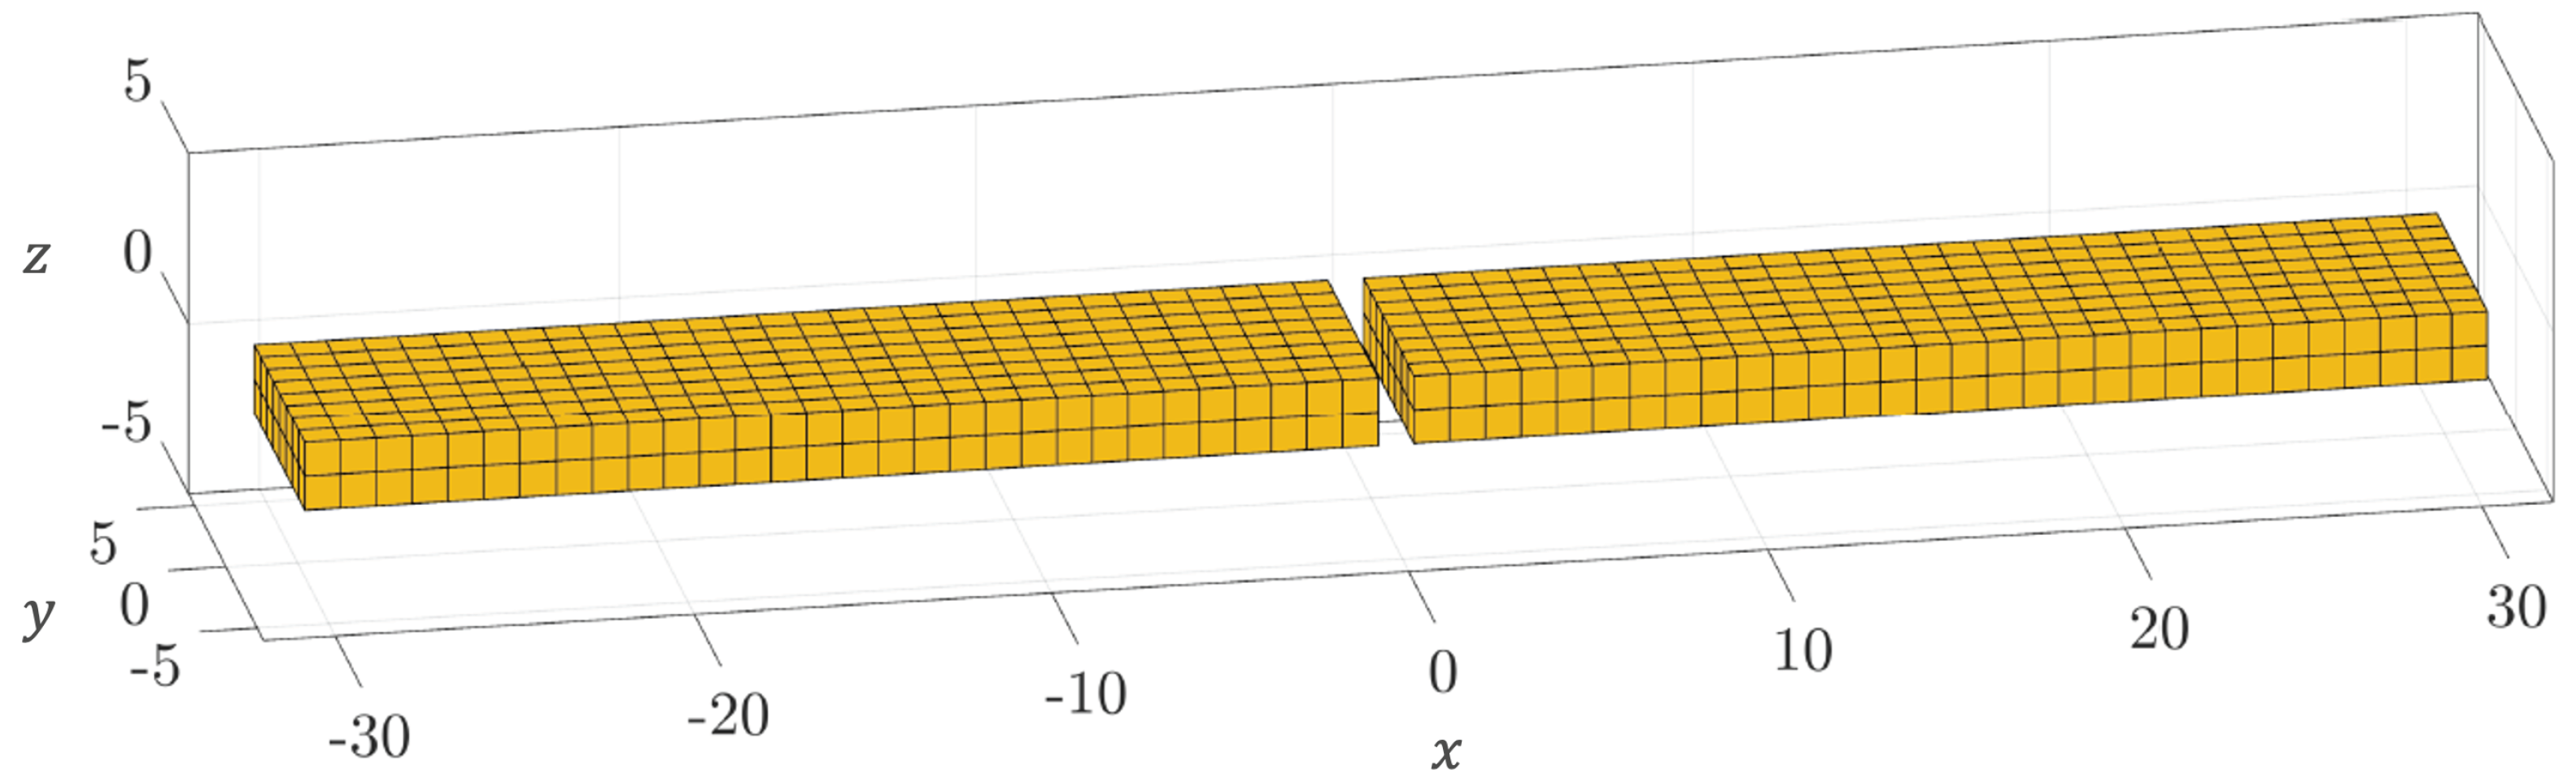
Twin-hulled hinged barge geometry.
Figure 4.
Twin-hulled hinged barge geometry.
Average energy flux surfaces during a wave spectrum ( m, s) on twin-hull hinged barge geometries, showing (a) underdamped power take-off, (b) optimum power take-off, (c) and overdamped power take-off.
Figure 5.
Average energy flux surfaces during a wave spectrum ( m, s) on twin-hull hinged barge geometries, showing (a) underdamped power take-off, (b) optimum power take-off, (c) and overdamped power take-off.
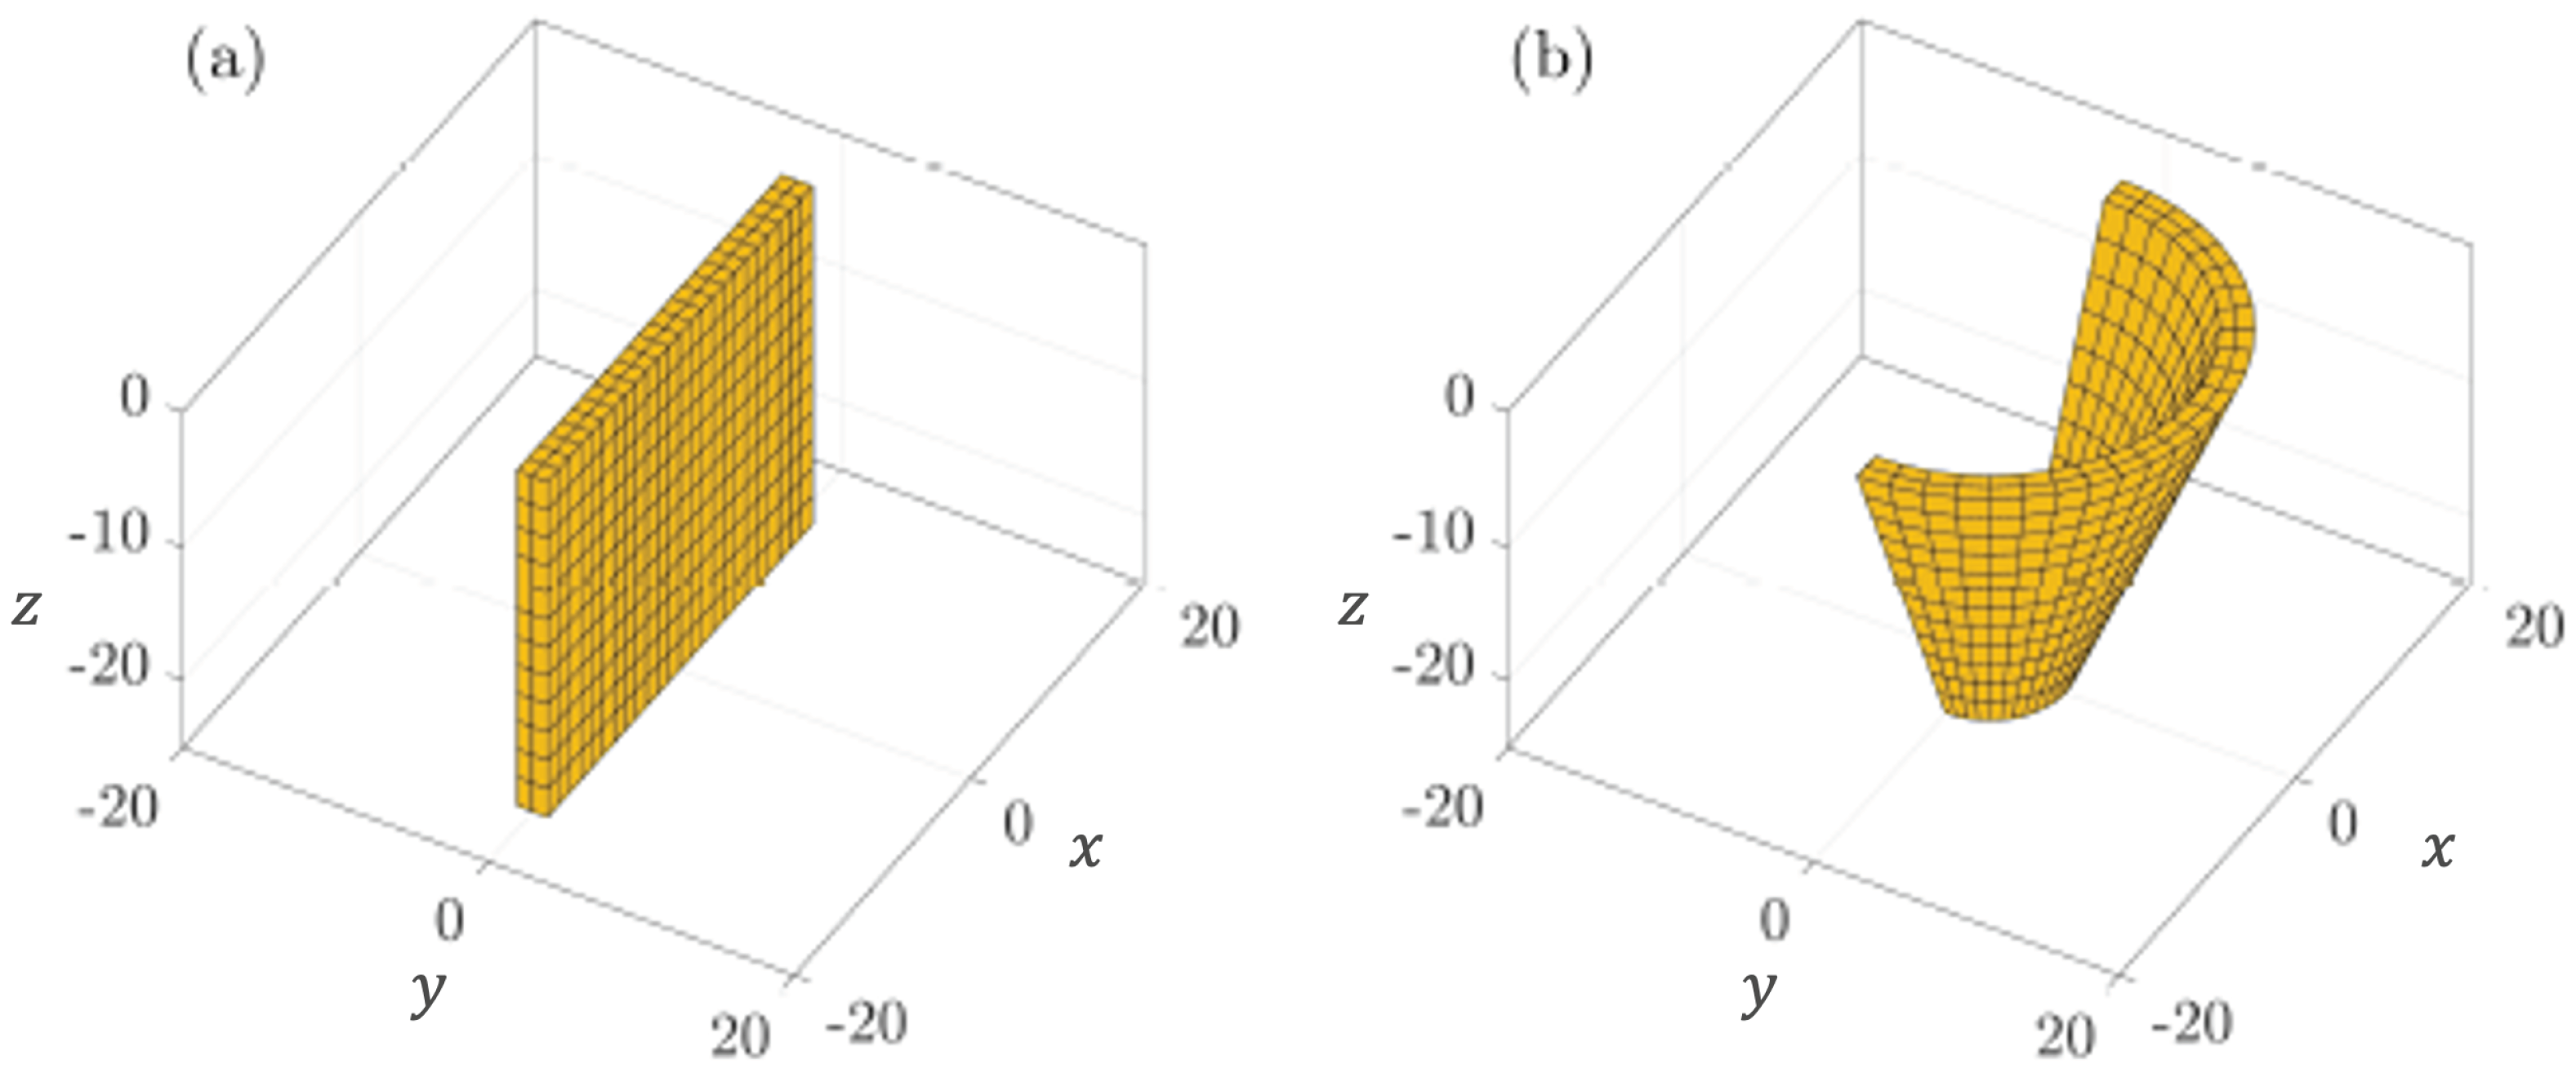
Geometries for (a) flat and (b) curved pitching flap WECs.
Figure 6.
Geometries for (a) flat and (b) curved pitching flap WECs.
Power RAO curves for a flat and a curved pitching flap.
Figure 7.
Power RAO curves for a flat and a curved pitching flap.
Average energy flux surfaces during a wave spectrum ( m and s) on pitching flap geometries, showing flat-flap (a) absorption and (b) radiation surfaces and curved flap (c) absorption and (d) radiation surfaces.
Figure 8.
Average energy flux surfaces during a wave spectrum ( m and s) on pitching flap geometries, showing flat-flap (a) absorption and (b) radiation surfaces and curved flap (c) absorption and (d) radiation surfaces.
Comparison of expected (body motions) and predicted (energy flux surface) power for monotonic (a–c) and spectral (d) waves, as shown in Figure 3.
Comparison of expected (body motions) and predicted (energy flux surface) power for monotonic (a–c) and spectral (d) waves, as shown in Figure 3.
| Case | Motions Prediction (kW) | Energy Flux Prediction (kW) |
|---|---|---|
| (a) | 0 | 0 |
| (b) | 0 | 0 |
| (c) | 219.46 | 219.47 |
| (d) | 93.48 | 93.48 |
Disclaimer/Publisher’s Note: The statements, opinions and data contained in all publications are solely those of the individual author(s) and contributor(s) and not of MDPI and/or the editor(s). MDPI and/or the editor(s) disclaim responsibility for any injury to people or property resulting from any ideas, methods, instructions or products referred to in the content. |
Source link
Gabriel Thomas Scarlett www.mdpi.com