1. Introduction
C-reactive protein (CRP) is an acute-phase protein produced by the liver, forming part of the immune system’s response [
1]. In healthy adults, CRP levels are typically low, generally below 1 mg/L [
2]; however, under pathological conditions such as infections, trauma, inflammation, or tumors, its concentration significantly increases [
3]. As an important inflammatory marker, the level of CRP can reflect the degree of inflammation in the body and the progression of certain diseases. Therefore, in clinical practice, CRP testing is widely used in various fields such as inflammatory diseases [
4], cardiovascular diseases [
5], and postoperative complications monitoring [
6]. Particularly in cardiovascular disease diagnosis, high-sensitivity CRP is considered one of the key indicators for predicting the risk of cardiovascular events [
7]. Given this, developing rapid, sensitive, and highly specific CRP detection technologies is crucial for early disease diagnosis and therapeutic monitoring.
Traditional methods for CRP detection mainly include enzyme-linked immunosorbent assay (ELISA) [
8], turbidimetry [
9], and fluorescent labeling [
10]. Although these methods have high sensitivity and specificity, they often require complex operational steps, long detection times, and expensive instrumentation support, making it difficult to meet the needs of point-of-care testing (POCT) [
11]. In recent years, with the development of biosensing technology, immunosensors have received widespread attention due to their simple and quick operation process, short response time, and high sensitivity, gradually becoming one of the important means of CRP detection [
12]. Among various types of immunosensors, fiber-optic immunosensors have been intensively studied and applied in the biomedical field due to their miniaturized design, high sensitivity, and electromagnetic interference resistance [
13]. These sensors use fiber optics as the medium for sensing and transmitting biological signals and capture target antigens by immobilizing specific antibodies on the fiber surface, thereby achieving real-time monitoring of target molecules. Based on different working principles, fiber-optic immunosensors can be categorized into several types, including those based on fiber grating [
14], surface plasmon resonance (SPR) [
15], lossy mode resonance [
16], interferometer [
17], etc. For example, in 2021, Esposito et al. reported a long-period grating fiber-optic sensor coated with graphene oxide to enable CRP detection [
18]; in 2023, Cao et al. reported a fiber-optic SPR biosensor for the specific detection of CRP [
19]; and in 2024, Cierpiak et al. reported an interferometry-based fiber-optic sensor for the assessment of CRP in human urine [
20]. Tapered fibers are particularly favored by researchers due to their simple structure, ease of fabrication, and higher sensitivity [
21]. Moreover, the larger surface area of tapered fibers provides more possibilities for subsequent biofunctionalization. However, the sensitivity enhancement of traditional tapered fibers is achieved by reducing the diameter of the sensing fiber while elongating it. This can bring inconvenience to detection and increase the amount of biological sample required.
In 2021, Wang et al. first proposed a localized surface plasmon resonance (LSPR) biosensor based on a tapered-in-tapered fiber structure [
22]. They further tapered down a conventional taper to a diameter of 40 μm to generate more optical field excitation of plasmon waves. In 2022, Gong et al. built upon the traditional tapered structure and further tapered it down to 20 μm, introducing a mode interferometer based on the tapered-in-tapered fiber structure, thereby enhancing the detection performance of the sensor [
23]. In the same year, Kumar et al. successfully excited the LSPR effect using the tapered-in-tapered fiber structure, achieving efficient detection of cresol [
24]. Previous studies have demonstrated that the tapered-in-tapered fiber structure can more effectively excite the evanescent field, thereby improving the performance of the sensor.
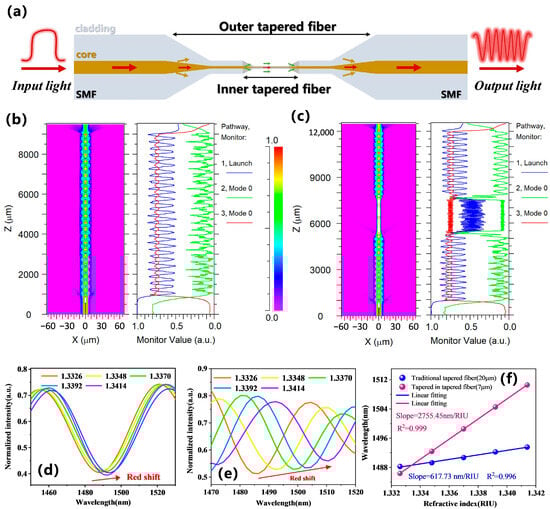
This study aimed to explore a fiber-optic biosensor structure—the tapered-in-tapered fiber-optic biosensor. The design integrates a micro-tapered section into a single tapered fiber structure, enhancing the contrast of interference fringes, reducing the full width at half maximum (FWHM) of the interference fringes and significantly improving detection sensitivity while also shortening the length of the sensing fiber. The experimental results show that this novel sensor exhibited excellent performance in liquid refractive index (RI) tests, achieving an ultra-high sensitivity of 3266.78 nm/RIU when the solution RI ranged from 1.3326 to 1.3414, approximately 1.7 times higher than that of traditional tapered fiber-optic sensors. Furthermore, we successfully immobilized human CRP antibodies (Anti-h CRP) onto the surface of the tapered-in-tapered fiber using glutaraldehyde cross-linking technology, endowing the sensor with the ability to specifically recognize CRP. After validation, this fiber-optic biosensor can accurately determine CRP content within different concentration ranges with a detection limit (LOD) of 0.278 μg/mL, while maintaining good repeatability and stability. This research achievement not only opens a new pathway for the development of high-performance fiber-optic immunosensors but also provides strong technical support for the rapid and accurate detection of biomolecules.
3. Results and Discussion
3.1. Spectral Analysis
To further study the advantages of the tapered-in-tapered fiber-optic sensor, this part comparatively analyzed the spectral differences between traditional tapered fiber and tapered-in-tapered fiber before and after incorporating the built-in micro-tapered fiber structure in deionized water.
Figure 3a presents the response transmission spectrum of the traditional tapered fiber-optic sensor in the wavelength range of 1450–1650 nm. It can be seen that the insertion loss of the traditional tapered fiber sensor was −2.65 dB, the interference fringe contrast was 6.5 dB, and the corresponding FWHM of the resonance peak was 32.6 nm. For a more intuitive analysis of spectral characteristics,
Figure 3b shows the spatial frequency distribution of the spectrum obtained by fast Fourier transform (FFT). As a signal analysis method, in our experiment, the transmission spectrum data were converted into the spatial frequency domain to more intuitively analyze the interference signal of the sensor. The FFT analysis indicated that the interference signal of the traditional tapered fiber was mainly concentrated around 0.015 nm
−1, exhibiting a typical two-beam interference pattern.
As for the tapered-in-tapered fiber-optic sensor,
Figure 3c displays its detection response transmission spectrum. The results show a significant improvement in interference fringe contrast compared to the traditional tapered fiber-optic sensor, reaching 12.05 dB, with the corresponding FWHM narrowing down to 7 nm. The enhancement in interference fringe contrast can be attributed to the design of incorporating micro-tapered fiber within the tapered-in-tapered fiber structure, which not only strengthens the mode coupling effect of the fiber but also excites additional higher-order cladding modes. A narrower FWHM implies that the tapered-in-tapered fiber-optic sensor can respond more precisely to minor signal variations in wavelength-modulated target measurements [
29]. The improvements in interference fringe contrast and FWHM performance significantly enhanced the detection accuracy and signal-to-noise ratio of the tapered-in-tapered fiber-optic sensor, thereby boosting the sensor’s resolution capability and stability. However, the insertion loss of the tapered-in-tapered fiber significantly increased to about −6.57 dB. The further increase in insertion loss can be attributed to light leakage due to the further reduction in the waist diameter, as well as additional transmission loss caused by the re-excitation of higher-order cladding modes.
Figure 3d illustrates the corresponding spatial frequency distribution of the tapered-in-tapered fiber-optic sensor. From the figure, it can be observed that the mode interference signals of the tapered-in-tapered fiber were concentrated at two frequencies: 0.015 nm
−1 and 0.045 nm
−1, indicating that the built-in micro-tapered fiber indeed introduced additional interference coupling modes. Moreover, compared to the traditional tapered fiber, the tapered-in-tapered fiber had an increased peak intensity at 0.015 nm
−1. The built-in micro-tapered fiber not only enhanced the strength of low-frequency modes but also promoted the excitation of higher-order modes, thereby effectively improving the sensor’s responsiveness to subtle changes.
3.2. Sensor Performance
To investigate the superiority of tapered-in-tapered fiber-optic sensors in detection sensitivity, we compared and analyzed the spectral response characteristics of the traditional tapered fiber-optic sensor and tapered-in-tapered fiber-optic sensor with the same minimum waist diameter under different liquid RI variations. A second traditional tapered fiber was fabricated with a waist diameter similar to that of the tapered-in-tapered fiber. The experimentally fabricated traditional tapered fiber had a waist diameter of 7.25 µm and a length of 20 mm, while the tapered-in-tapered fiber had a waist diameter of 7.18 µm and a length of 13 mm. Tapered-in-tapered fiber allows for a further reduction of the waist diameter while effectively preventing an increase in the overall sensor size. This optimized design reduced the amount of biological sample required for the assay. NaCl solutions with RIs of 1.3326, 1.3349, 1.3371, 1.3392, and 1.3414 were prepared and calibrated using an Abbe refractometer (INESA Instrument Physics & Optics Co., Ltd., Shanghai, China, WAY-2S) at a room temperature of 25 °C.
Figure 4a,b show the spectral shifts for the traditional tapered fiber-optic sensor and the tapered-in-tapered fiber-optic sensor under different RIs, respectively. It can be observed that as the detected RI increased, redshifts occurred in the transmission spectra due to changes in the effective RI difference caused by external RI changes. For the traditional tapered fiber-optic sensor, the responses of Dip1, Dip2, and Dip3 with varying RI in the wavelength range of 1450–1650 nm were monitored, and the linear fitting analysis results are shown in
Figure 4c. The RI sensitivities were found to be 1591.08 nm/RIU, 1633.29 nm/RIU, and 1863.88 nm/RIU, respectively. Dip3 exhibited the highest sensitivity, which was consistent with the higher sensitivity at longer wavelengths as described in Equation (3). The RI sensitivities for the tapered-in-tapered fiber-optic sensor are shown in
Figure 4d, where the RI responses for Dip1, Dip2, and Dip3 were found to be 2713 nm/RIU, 2794.95 nm/RIU, and 3266.78 nm/RIU, respectively. Clearly, under the same fiber waist diameter, the tapered-in-tapered fiber structure significantly improved the RI detection sensitivity by approximately 1.7 times compared to the traditional tapered fiber structure.
The comparative experimental results demonstrate that the tapered-in-tapered fiber-optic sensor significantly outperformed the traditional tapered fiber in terms of performance. These improvements are primarily attributed to the additional interference coupling modes brought about by a micro-tapered fiber in a tapered fiber. Moreover, comparing the traditional tapered fiber and tapered-in-tapered fiber with identical waist diameters, not only was the sensitivity of the sensor been significantly improved, but the length of the sensing fiber was also reduced, which substantially decreased the sample volume required for detection. MAPE (mean absolute percentage error) is a commonly used error assessment indicator, typically employed to measure the relative error between predicted values and actual values [
30]. We analyzed the RI detection accuracy of our sensor, as shown in the
Table 1. From this, the MAPE was found to be 0.026%.
3.3. Sensor Surface Treatment and Immunofuntionalization for CRP Detection
In order to achieve specific detection of the target CRP by the proposed fiber-optic sensor, the modification of an immuno-recognition sensitive membrane on the sensor surface is particularly important. In this study, we employed glutaraldehyde crosslinking [
31] to immobilize the CRP recognition molecule Anti-h CRP onto the sensor surface for immunofuntionalization.
Figure 5a describes the specific fiber modification steps:
Step 1: The fiber-optic sensor, thoroughly cleaned with ethanol solution and deionized water, was immersed in piranha solution for 30 min, then rinsed several times with deionized water, and finally dried at room temperature. Piranha solution possesses strong oxidizing properties, effectively removing organic contaminants from the fiber surface and creating hydroxyl groups (-OH) on it.
Step 2: The fiber-optic sensor was immersed in a 10% (v/v) APTES ethanol solution for 2 h, then washed several times with ethanol solution, and finally dried at room temperature. The treatment with APTES ethanol solution introduces amino groups (-NH3) onto the fiber surface, providing chemical binding sites for subsequent coupling reactions.
Step 3: The fiber-optic sensor was immersed in a 10% (v/v) glutaraldehyde solution for 1 h, followed by several washes with PBS buffer. The purpose of the glutaraldehyde solution treatment is to further functionalize the fiber surface by introducing aldehyde groups (-CHO), enabling it to covalently bind with the amino groups of antibodies.
Step 4: The fiber-optic sensor was immersed in a 50 µg/mL Anti-h CRP solution for 1 h, anchoring antibody molecules to the fiber surface and endowing the fiber-optic sensor with the capability for specific CRP detection. Then, it was washed several times with PBS buffer to remove any unbound free antibody molecules.
Step 5: The fiber-optic sensor was immersed in a 1% (w/v) BSA solution for 30 min, followed by several washes with PBS buffer to remove any unbound protein molecules. The BSA solution treatment acts as a blocking step, preventing nonspecific reactions with other non-target molecules and enhancing the sensor’s resistance to interference.
Step 6: Once the surface functionalization is complete, the fiber-optic sensor can capture the target CRP, translating the antibody-antigen binding signal into a recognizable optical signal change.
Figure 5b,c records the interference signals after each step described above, showing that each step caused a significant redshift in the interference peaks. The surface modification process of protein molecules lead to a larger redshift.
Figure 5.
Bio-modification of the sensor: (a) Step-by-step process flow for sensor surface treatment and immunofuntionalization for CRP detection. (b) Sensing signal spectra during the surface treatment steps. (c) Sensing signal spectra during the immunofuntionalization steps.
Figure 5.
Bio-modification of the sensor: (a) Step-by-step process flow for sensor surface treatment and immunofuntionalization for CRP detection. (b) Sensing signal spectra during the surface treatment steps. (c) Sensing signal spectra during the immunofuntionalization steps.
3.4. CRP Detection Performance
After the immunofunctionalization process, the stability of the fiber-optic biosensor was first assessed. The biosensor was immersed in PBS solution, and the response wavelength of the interference peak was monitored continuously for 20 min (collecting data every 1 min), as shown in
Figure 6a. The results indicate that during the 20 min monitoring period, the standard deviation of the wavelength shift was 0.026 nm, demonstrating good stability of the sensor.
Next, to evaluate the sensitivity of the biosensor for CRP detection, CRP sample solutions with concentrations of 0.5 µg/mL, 2 µg/mL, 5 µg/mL, 10 µg/mL, 50 µg/mL, and 100 µg/mL were prepared using PBS as the background solution. These CRP solutions were injected onto the biosensor in ascending order of concentration, with a detection time of 30 min each. Notably, PBS buffer was used as the baseline reference before and after the detection of each concentration sample, and the sensor responses were recorded, as shown in
Figure 6b. The detection results for different concentrations of CRP are shown in
Figure 6c. As the detected CRP concentration increased, the sensor response wavelength change was consistent with the Langmuir adsorption curve model. In the low concentration range of 0–5 µg/mL, the sensor response was essentially linear, while in the high concentration range of 10–100 µg/mL, the sensor response tended toward saturation. After antibodies on the sensor surface captured CRP, the specific binding of CRP to Anti h-CRP caused an increase in the RI of the medium on the sensing area surface, resulting in a shift in the sensor response wavelength towards longer wavelengths. The inset in
Figure 6c presents the results of a linear fitting analysis conducted within the low concentration range of 0–5 µg/mL for the CRP antigen. The analysis indicates a detection sensitivity of 0.28 nm/(µg/mL). The LOD is an important indicator of biosensor performance, aimed at evaluating the sensor’s ability to detect the minimum concentration of the target antigen. The calculated LOD for CRP antigen detection is 0.278 μg/mL by the formula of
[
32],where σ = 0.026 nm is the standard deviation of the sensor signal under a blank sample and S is the linear slope of the sensor response signal versus target antigen concentration. To further verify the repeatability of the biosensor, three biosensors with the same parameters were prepared and subjected to CRP detection with the same gradient concentrations. The error bars in
Figure 6c represent the standard deviation of wavelength response for the three sensors at the same CRP concentration, indicating good repeatability of our biosensor.
Response time and selectivity are also important parameters for evaluating biosensor performance [
33]. To assess its response time, real-time monitoring of the wavelength response change was conducted during the detection of a 5 µg/mL CRP solution by our biosensor, as shown in
Figure 6d. The results indicate that it took 8.5 min for the detection signal to reach 90% of its final stabilized state after the sensor captured CRP. Subsequently, the fluctuation amplitude did not exceed 1% over the following period. To further evaluate the selectivity of the biosensor, we tested its response to BSA, H-IgG, and OVA under the same experimental conditions.
Figure 6e displays the response results of the biosensor to different protein molecules. It can be observed that the biosensor only had a significant response to CRP while showing minimal response to other protein molecules. This indicates that the tapered-in-tapered fiber-optic biosensor has good selectivity in CRP detection.
Finally, a comparison of different types of CRP biosensors is listed in
Table 2. The long response time is mainly attributed to the efficiency of the antigen–antibody affinity binding reaction. To shorten the response time, on one hand, an oriented antibody immobilization method for sensor surface biomodification can be designed. Since the antibody immobilized by the biomodification method in this manuscript is not oriented, the binding sites of the antibody may face different directions, rather than uniformly and directionally exposing the antigen binding sites in the most favorable direction for antigen binding, resulting in hindered antigen–antibody binding. Oriented immobilization of antibodies can shorten the response time. On the other hand, antibodies with higher affinity can be sought to improve detection efficiency.