1. Introduction
For concrete dams built in areas with frequent seismic activities, the safety of the dam against earthquakes is crucial [
1,
2]. The dynamic loadings are generally complex and may lead to the fast cracking of the concrete, which exerts an adverse influence on the bearing capacity and durability of the structures [
3,
4]. The study on the fracture behavior of mass concrete, especially under dynamic loadings, is beneficial for postponing and mitigating crack initiation and propagation, and provides technical support for measures taken to alleviate the cracking, thus improving the durability and safety of the dam [
5,
6,
7].
Fracture mechanics was introduced to investigate the nonlinearity of concrete ever since Kaplan conducted fracture tests on concrete beams based on Griffith’s theory in 1961 [
8]. Opening-mode cracks have been the focus of experimental research, as they cause the low-stress fractures of structures. For the tests of opening-mode cracks, the wedge-splitting test and the three-point bending test have been widely used by scholars, and formulae for calculating the fracture toughness are available. Bruhwiler et al. [
9] conducted wedge-splitting tests on concrete containing preset cracks, and there was no size effect on the fracture toughness obtained by the two-parameter model. Zhang et al. [
10] evaluated the double-K fracture toughness of concrete using wedge-splitting tests and the simplified Green’s function method, simplified equivalent cohesive force method, four-terms weight function method, and Gauss–Chebyshev integral method, and found that the results obtained from the experiment were in good agreement with the four analysis methods. Xu et al. [
11] proposed a numerical method to obtain the
KR curve of concrete by considering the fracture process zone in three-point bending tests. Dai et al. [
12] investigated the fracture process zone (FPZ) of concrete using digital image correlation (DIC) and the acoustic emission (AE) for the three-point bending test containing preset cracks. Zhang et al. [
13] captured the crack initiation based on the AE for three-point bending tests containing preset cracks. In addition, Lu et al. [
14] explored a nonlinear uniaxial strength criterion for concrete under dynamic loading conditions. Chen et al. [
15] investigated the ultimate load-carrying capacity of short thin-walled steel tubes reinforced with highly ductile concrete experimentally. This study provides an important experimental basis and theoretical support for the application of thin-walled steel pipe–concrete composite structures in bridges and buildings. Zhang et al. [
16] focused on analyzing the multi-crack stress intensity factor of rib-to-floor beam weld details in orthotropic anisotropic steel bridge panels under vehicle loading. The results of the study are important for guiding the design and maintenance of orthotropic anisotropic steel bridge panels. Fang et al. [
17] evaluated the early crack resistance performance of concrete mixed with ternary minerals using a temperature stress testing machine.
Many concrete structures are subjected to dynamic loads in addition to static loads, and the effects of these loads may have a larger impact on concrete fracture. Different concrete structures have different fracture mechanical properties due to differences in their properties, and these differences may be more pronounced under dynamic loading. Therefore, it is necessary to perform fracture tests on concrete. Nogueira et al. [
18] conducted tests on mortar and plain concrete under direct shear by ultrasonic pulse velocity. Musiket et al. [
19] found that the fracture toughness and fracture energy release rate of recycled aggregate concrete increased with the increase in the loading rate. Cadoni et al. [
20] and Brara et al. [
21] carried out SHPB tests, Mindess et al. [
22] performed drop hammer impact tests, and Zhang et al. [
23] conducted three-point bending tests, and each found that the fracture energy increased with an increasing loading rate. Ruiz et al. [
24] found that the fracture toughness and fracture energy increased with the loading rate by conducting three-point bending tests. At high loading rates, the increase in the fracture toughness and fracture energy is significant due to the inertial effect and the initiation of multiple microcracks under impact loading. John et al. [
25] and Ngo et al. [
26] found that the rate of concrete crack expansion increased with an increasing loading rate by using the three-point bending test.
The experimental study mentioned above was carried out on small-sized wet-sieved concrete specimens, which is a concrete mix in which large-sized aggregates are screened out after mixing well, whereas mass concrete is used in practical dam projects. Since it is difficult to cast and test mass concrete specimens, the parameters of the sieved specimens are often revised to approximate those of mass concrete. However, there are limitations in this practice, mainly because the content of cement mortar and aggregates in mass concrete differs from that of wet-sieved concrete, and the internal composition of the specimens changes after being sieved. Li et al. [
27,
28] conducted direct tension tests on mass concrete and wet-sieved concrete and found that the fracture energy of the mass concrete was approximately 1.40–2.23 times that of wet-sieved concrete. Due to limited experimental data, the relationship between the fracture parameters obtained from the mass concrete and wet-sieved concrete could not reach a consensus, so it is necessary to carry out fracture tests on mass concrete. Guan et al. [
29] carried out wedge-splitting tests on mass concrete and found that the initial fracture toughness and fracture energy increased with age. Li et al. [
30,
31] carried out fracture tests on mass concrete including preset cracks through wedge-splitting tests and found that the fracture energy of the specimens cast in summer was higher than those cast in winter. Gao et al. [
32] and Guan et al. [
33] conducted wedge-splitting tests on mass concrete including precast cracks and found that, if the ratio between the ligament height and maximum aggregate particle size ratio exceeded six, the initial fracture toughness and unstable fracture toughness did not change with the ratio. Saouma et al. [
34] and Mohsen et al. [
35] performed wedge-splitting tests on mass concrete including preset cracks and found that there was no significant size effect on the fracture toughness when the ratio of the ligament height to the maximum aggregate size was equal to eight. Xu et al. [
36] found that the fracture toughness and fracture energy were insensitive to the change in the preset crack length by conducting wedge-splitting tests. Zhao et al. [
3] and Ghaemmaghami et al. [
37] found that the fracture energy of the mass concrete of a dam increased with the increase in the specimen height by conducting wedge-splitting and three-point bending tests. Bakour et al. [
38] carried out wedge-splitting tests on mass concrete and evaluated the local FPZ properties by using DIC monitoring.
Although it is convenient to calculate the fracture toughness and fracture energy for three-point bending tests, the specimens may break during handling, and, more importantly, the self-weight of the specimens may affect the test results. The wedge-splitting test avoids the influence of self-weight, lowers the requirements concerning the stiffness, and is simpler to install. However, the vertical loading induces additional moments that affect the stress field at the crack tip, which may affect the fracture parameters of the specimens obtained. It is known that concrete is more vulnerable when subjected to tension as compared to compression [
39,
40]. As the most direct method of determining the tensile properties of concrete, the tensile strength measured by direct tension testing is the closest to the real strength of concrete [
41]. Wittmann et al. [
42] determined the fracture parameters of concrete with the compact tension test. Chen et al. [
43] investigated the tensile properties of concrete at high strain rates using the split Hopkinson pressure bar. Wang et al. [
44] drilled core samples of an arch dam and obtained the dynamic tensile strength by carrying out direct tension tests. Guo et al. [
41] conducted direct tension tests on plain concrete cylinders using AE and DIC techniques. By detecting the AE signals, the internal fracture damage of the specimen can be monitored, and by using the DIC technique, the microcracks and macrocracks on the surface of the specimen can be tracked. By using the AE technique in the direct tension testing of prismatic concrete specimens, Li et al. [
45] found that microcracks are easy to nucleate and grow in the aggregate–mortar interface transition zone, and they eventually develop into macrocracks, resulting in the overall failure of the material. Fan et al. [
46] carried out direct tension tests on concrete, monitored the internal damage of the concrete in real time by the AE, and studied the dynamic performance and failure mechanism of the concrete. The direct tension test is the most straightforward method to measure the strength and fracture parameters of concrete; however, the testing process is difficult due to the stress concentration at both ends and the centering of the specimen during the test.
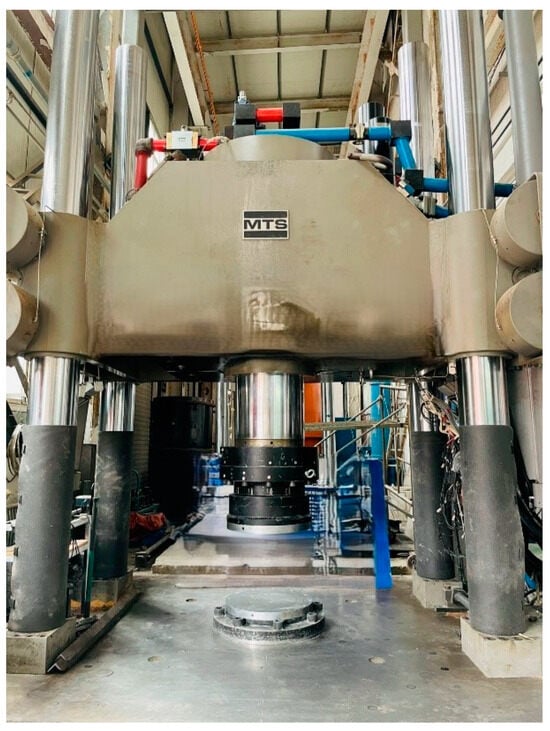
Therefore, this study was conducted to determine the fracture characteristics of mass concrete in the context of high concrete dam seismicity. Direct tension tests on cylindrical mass concrete specimens of the size φ450 mm × 450 mm, including a ring of precast cracks, were carried out on an MTS servo-controlled testing machine for quasi-static loading and dynamic loading in this paper. The peak load, energy absorption capacity, fracture energy, and characteristic length of mass concrete under static and dynamic loading were investigated. The fracture toughness was calculated and the crack propagation process was modeled by using the extended finite element method.
4. Numerical Simulations
The numerical simulation in this paper (a) calculates the fracture toughness by building 3D models as well as considering the influence of the loading eccentricity of the tests; (b) simulates the process of crack propagation by building axisymmetric models, extracting the P–CMOD curves and comparing them with the tests.
In 1996, Melenk et al. [
47] proposed the unit decomposition method; in 1999, Belytschko et al. [
48] studied crack extension in elastomer models based on minimally reconfigurable meshes; in 2000, Daux et al. [
49] introduced continuous functions in the study of multi-crack problems and named it the extended finite element method (XFEM). Compared with the finite element method (FEM), XFEM is based on the unit decomposition method, in which the crack is allowed to pass through the mesh, as shown in
Figure 6. At this time, due to the jumping phenomenon on both sides of the crack, its displacement field is no longer continuous, and the stress concentration phenomenon occurs at the tip of the crack. The intermittency is reflected by introducing strengthening functions, including the stress asymptotic function at the crack tip and the intermittent jump function, which are used to increase the nodal degrees of freedom. The displacement field functions as follows:
where Ni and ui are the shape function and corresponding node displacement of the regular unit node; Nj and αj are the shape function and corresponding node displacement of the completely penetrated unit node, whose corresponding node sets are shown as in Figure 6; Nk and are the shape function and corresponding node displacement of the unit node at the crack tip, whose corresponding node sets are shown as  in Figure 6; H(x) is the hopping function, which denotes the discontinuity of the displacement at the crack surface, also called the Heaviside function; ϕα(x) is the stress asymptotic function, which denotes the stress singularity at the crack tip, whose expression in the polar coordinate system is as in Equation (5).
Since no analytical solution is available regarding the fracture toughness of the current tests, a coupled approach of experimental and numerical simulation based on XFEM was used. The stress intensity factor was calculated by employing the
J-integral method. The
J-integral is path-independent for curved surface integrals around the crack tip, and its fracture toughness index is presented in the form of energy. The interaction integral method provides a reasonable and natural description of the total energy release. The interaction integral method was obtained by introducing an auxiliary field (denoted as state 2 in the following equations) superimposed on the real field (denoted as state 1) to obtain the
J-integral component, which is expressed as follows:
where A is an arbitrarily closed loop around the crack tip, W(1,2) is the strain energy density, and qj is the unit normal vector of the closed loop, with the direction pointing outward.
4.1. Fracture Toughness
The importance of calculating the fracture toughness of concrete is to ensure the safety and durability of the structure. By accurately calculating the fracture toughness of concrete, the overall stability and durability of the structure can be assessed by better understanding the crack extension behavior of concrete under stress conditions. This is important for preventing structural damage and extending the service life. The direct tension test of the mass concrete was modeled using ABAQUS 2021 software, as shown in
Figure 7. The material parameters of the concrete are shown in
Table 2. Vertical displacement was applied at the upper face of the model, while the lower face was constrained in the same direction. Based on the theory of linear elasticity, the deformation and stress of the model can be obtained and the stress intensity factors for the preset crack can be calculated. If the sum of the nodal forces on the upper face resulting from the vertical displacement is equal to the measured peak load, the stress intensity factor calculated is the critical stress intensity factor of the crack. The results are shown in
Table 5. It is found that the critical stress intensity factor under dynamic loading has increased compared to the quasi-static loading, and the rate of increase is similar to that of the peak load.
Although a pair of ball hinges were used to apply the load and reduce the eccentricity of the specimens during the tests, the results of the laser displacement meters indicate certain eccentricity phenomena. In order to avoid the undesirable influence of the eccentricity and better reflect the real state of the crack, the tilt of the upper face during the loading process resulting from the eccentricity was considered in the numerical simulation. The finite element model is shown in
Figure 8. Vertical displacement was applied to the upper face, which was tilted but maintained a plane during the loading process. The displacement measured by the laser displacement meter at the peak loading moment in the test was fitted to obtain the equation for the displacement of the nodes on the upper face, which are shown in
Table 6. If the sum of the nodal forces on the upper face resulting from the vertical displacement was equal to the measured peak load, the stress intensity factor calculated was taken as the critical stress intensity factor.
The critical stress intensity factors calculated are shown in
Table 5. If the eccentricity phenomenon is not considered, the critical stress intensity factors for specimens C01, C02, and C03 are 0.546 MPa·m
1/2, 0.868 MPa·m
1/2, and 0.862 MPa·m
1/2, respectively. The expression of the stress intensity factor for a cylindrical specimen with a ring of preset cracks during the direct tensile test is shown as Equation (10) [
50]. The stress intensity factors for specimens C01, C02, and C03 are 0.519 MPa·m
1/2, 0.824 MPa·m
1/2, and 0.818 MPa·m
1/2, calculated from Equation (10), respectively. The relative errors between the stress intensity factors obtained according to the coupled experimental–numerical simulation approach and the results obtained from Equation (10) are 5.10%, 5.05%, and 5.04%, respectively. It can be seen that a coupled approach of experimental and numerical simulation can lead to relatively accurate stress intensity factors.
Conversely, if the eccentricity is considered in the numerical simulation, the critical stress intensity factors are 0.939 MPa·m1/2, 1.394 MPa·m1/2, and 1.379 MPa·m1/2, showing a significant increase as compared to the former case. Since the eccentricity makes a part of the ring of the crack tips reach the critical state earlier than the other, the fracture toughness of the material should be calculated from the crack tip that propagates first. So, here, the critical stress intensity factors calculated by considering the eccentricity are taken as the fracture toughness. The static fracture toughness is 0.939 MPa·m1/2, and the dynamic fracture toughness is taken as an average of specimens C02 and C03, which equals 1.387 MPa·m1/2. The fracture toughness under quasi-static and dynamic loading, considering the eccentricity, is improved by 71.98% and 60.35%, respectively, as compared to that without considering the eccentricity. As compared to the static fracture toughness, the dynamic toughness has increased by 47.71%.
4.2. Simulation of Crack Propagation Process
The cracking process of the mass concrete specimens due to direct tension was modeled based on the XFEM in ABAQUS. By assuming the axisymmetric problem, a slice of the specimen was modeled, as shown in
Figure 9. The elastic modulus and Poisson’s ratio of the mass concrete are taken from
Table 2. The tensile strength and fracture energy of the concrete at a strain rate of 10
−6/s are taken from those of specimen C01, while those at a strain rate of 10
−3/s are taken from the average of specimens C02 and C03. The tensile strength is approximated by the ratio of the measured peak load to the net area of the fracture zone. The parameters are shown in
Table 7. The lower face of the model is constrained in the vertical direction, while vertical displacement is applied at the upper face, which is increased linearly during the loading process.
The energy-based linear softening principal relationship was assumed, and the maximum principal stress criterion was taken as the fracture criterion.
In order to investigate the effect of the mesh density, the case of quasi-static loading was modeled by employing different mesh sizes, i.e., 0.002 m, 0.004 m, and 0.006 m, respectively. The
P–
CMOD curves obtained are shown in
Figure 10. It is found that the curves for the three mesh densities basically coincide with each other, with the peak loads equal to 175.83 kN, 176.46 kN, and 177.75 kN, respectively, while the maximum difference is 1.09%. The corresponding
CMODs are 0.01267 mm, 0.01295 mm, and 0.01269 mm, respectively, with a maximum difference of 2.21%. So, since the mesh density has little effect on the modeling results, the mesh size of 0.004 m was adopted in the subsequent modeling.
Figure 11 shows the
P–
CMOD curves of the specimen obtained from the experiment and the numerical simulation for the case of quasi-static loading. It can be found that the two curves are in good agreement concerning the peak load, and the gradient of the ascending section and the descending section. This verifies the numerical procedure and the fracture parameters obtained by the experiment. The peak loads obtained by the experiment and the numerical simulation are 178.82 kN and 176.51 kN, respectively, and the latter is 1.31% lower. A possible reason for this could be the presence of coarse aggregates in the specimens, where the interlocking between them may have increased the strength of the specimen.
Figure 12 shows the vertical stress contour during the crack propagation process obtained by the numerical simulation for quasi-static loading. By assuming homogeneous material, a typical mode I crack problem is presented. This could be different from the experiment, in which aggregates exist in the specimens, causing asymmetry in the deformation. Three stages of cracks in the propagation process can be identified from
Figure 11 and
Figure 12.
Stage 1: Linear elastic. At the beginning of the loading, the tensile stress is symmetrically distributed in the two halves of the specimen, and the stress concentration is observed at the crack tip, but the crack does not propagate, as shown in
Figure 12a. In this phase, the CMOD increases linearly with the load and the gradient of the P-CMOD curve, representing the specimen stiffness, remains constant.
Crack initiation. As the load increases, the crack tip reaches a critical state when the tensile stress at the crack tip reaches the maximum principal stress, which is when the crack starts to grow and the stress at the crack faces is released, as shown in
Figure 12b. The crack propagates in the direction perpendicular to the load; in the meantime, the CMOD increases. Here, the load at the instant that the crack reaches a critical state for the first time is defined as the initial cracking load.
Stage 2: Stable propagation. As the load continues to grow, the relation between the load and CMOD becomes nonlinear, and the specimen stiffness decreases. When the peak load is reached, the specimen stiffness decreases to zero, as shown in
Figure 12c.
Stage 3: Unstable propagation. For the stage beyond the peak load, the specimen stiffness decreases remarkably. With the growth of the crack, the CMOD increases while the load continues to decrease.
The vertical stress in the specimen is symmetrically distributed throughout the loading process, since the crack is in a mode I fracture state.
Figure 13 shows a comparison of the
P–
CMOD curves obtained by the experiment and the numerical simulation for dynamic loading conditions. It can be found that they are in good agreement, where the peak load obtained by the numerical simulation is slightly smaller than that of specimens C02 and C03. Additionally, the stiffness of the curves for the whole loading and unloading processes is also quite similar, with the numerical result being slightly higher.
Figure 14 shows the vertical stress contour. The cracks also experience three stages during the propagation process, as in the quasi-static case, i.e., the linear elastic stage, stable propagation stage, and unstable propagation stage.
5. Conclusions
To investigate the fracture characteristics of mass concrete under quasi-static and dynamic loading, direct tension tests were carried out on cylindrical mass concrete specimens containing a ring of preset cracks using an MTS servo-controlled testing machine, and two loading rates were tested, i.e., 10−6/s and 10−3/s. Numerical simulation was employed to calculate the fracture parameters and simulate the fracture propagation process. The following conclusions can be drawn. (1) All of the specimens fractured along the plane that the preset crack lies in. Under quasi-static loading, the aggregate–matrix interfaces are fractured, which are relatively weak in the specimen, while, for dynamic loading, several coarse aggregates are fractured to form a short crack path. (2) The peak load, energy absorption capacity, fracture energy, and fracture toughness of the mass concrete under dynamic loading increase by 58.51%, 145.75%, 124.48%, and 47.71%, respectively, as compared to static loading, whereas the characteristic length reduces by 11.67%. (3) The fracture toughness was obtained by coupling laboratory tests and numerical simulations based on XFEM. In this process, the influence of the loading eccentricity was compensated by non-uniform loading in the numerical simulation. It is found that, by considering this influence, the fracture toughness increases by 71.98% for quasi-static loading and 60.35% for dynamic loading when compared with not considering the influence. (4) The P–CMOD curves of the crack propagation process under quasi-static and dynamic loading were obtained by XFEM. The numerical simulation results are in good agreement concerning the peak load, and the gradient of the ascending section and the descending section of the curves in the two operating conditions.

 in Figure 6; H(x) is the hopping function, which denotes the discontinuity of the displacement at the crack surface, also called the Heaviside function; ϕα(x) is the stress asymptotic function, which denotes the stress singularity at the crack tip, whose expression in the polar coordinate system is as in Equation (5).