1. Introduction
Bedforms such as ripples and dunes [
1] are prevalent sedimentary structures in alluvial river channels. Their development and evolution significantly influence the flood risk, river transport, and infrastructure stability [
2,
3,
4]. The kinetic energy of water flow primarily shapes these bedforms, such as dunes [
5,
6], and both bed resistance and sediment transport undergo changes during their formation and development [
1,
7,
8]. Additionally, bed resistance plays a crucial role in river energy dissipation [
9,
10], and it is closely related to sediment transport. Consequently, bedforms, sediment transport, and bed resistance interact in a complex network [
11,
12], which complicates the accurate prediction of sediment transport and bed resistance. Thus, research into the characteristics of bedform evolution and their impact on sediment transport is essential to provide technical support for the stable operation of river engineering projects and flood control and siltation reduction practices.
Extensive research on river dynamics has focused on the features of bedforms, sediment transport patterns, and the characteristics of bed resistance distribution, yielding significant results. The data for bedforms characterization are primarily obtained through indoor flume experiments and field observations. These data are used to elucidate the mechanisms of interaction between the physical characterization parameters of bedforms (e.g., dune length and height) and hydrodynamic factors (e.g., discharge and velocity). This approach has led to the establishment of empirical relationships between these parameters and the development of bedform size recognition tools [
13,
14,
15,
16,
17,
18]. Certain researchers have quantified the distribution patterns of bedforms using statistical analysis of field-measured physical parameters [
5,
19]. Bed resistance significantly influences sediment transport. It is worth mentioning that the research results on bed resistance changes caused by changes in bed morphology can be roughly divided into the following categories. The first approach involves the determination of the effective shape roughness height using empirical methods [
20]. The second approach is based on numerical simulations that yield empirical formulas for hydraulic roughness of different bedforms with varying lee side angles [
21]. Most recently, research has integrated the actual flow patterns and dune geometry influences by applying the principles of momentum and energy balance equations and introduced an empirical bed form drag coefficient to study the contribution of dunes to flow resistance [
22].
Additionally, numerical simulations of river bedforms have been conducted based on experimental data [
23,
24,
25]. Regarding sediment transport patterns, most existing studies have derived empirical sediment transport formulas from indoor experimental data [
26,
27,
28,
29,
30], typically using uniform sand particles. In recent years, numerical simulation methods have been employed to develop sediment transport prediction models [
31,
32,
33,
34,
35]. Bed resistance comprises sediment resistance caused by sediment particles and shape resistance caused by dunes. In the presence of dunes on the bed, shape resistance often dominates bed resistance [
36,
37,
38,
39]. The development and evolution of dunes directly affect shape resistance, thereby determining the sediment transport capacity. These findings indicate that research has extensively explored the bedform features, the sediment transport patterns, and the bed resistance distribution characteristics, establishing empirical relationships and numerical models related to hydrodynamics and dune bedforms [
21,
40,
41,
42,
43,
44]. However, owing to the complexity of changes in bedforms, sediment transport patterns, bed resistance distribution, and their interactions, the practical application of these empirical relationships and models often yields unsatisfactory results [
3,
45,
46].
The previous studies have made significant theoretical and numerical advancements in understanding bedforms and their effects. However, there remains a lack of the quantitative analysis of bedforms and the thorough examinations of empirical data. Moreover, the existing empirical formulas require enhancements in terms of applicability and accuracy, especially under complex bed conditions such as dune bedforms. Prior research has not adequately distinguished between the features of 2D and 3D dune bedforms, overlooking their differences in development and sediment transport capabilities, which results in the misinterpretation of dune characteristics. The traditional formulas for sediment transport rates have been designed for uniform sediment and are less effective when applied to dune bedforms, leading to inaccuracies in predicting the sediment transport processes. Furthermore, the resistance characteristics of dune bedforms and the impact of bedload transport have not been comprehensively explored, resulting in an incomplete understanding of the development of dune bedforms and sediment transport mechanisms.
To address these limitations, this study established a flow–sediment movement and 3D bedform measurement system within a large-scale flume and conducted a series of movable-bed dune experiments. The objectives of this study were to (1) quantitatively analyze the features of 2D and 3D dune bedforms, (2) investigate the impact of dune bedforms on the bedload transport rate, and (3) examine the relationships between bed resistance, dune morphology, and sediment transport. The goal was to elucidate the processes by which dune bedforms influence sediment transport and bed resistance through experimental observations and theoretical analysis, thereby enhancing the accuracy of sediment transport predictions and providing scientific support for river management and engineering practices.
2. Experimental Setup and Methods
2.1. Experimental Setup
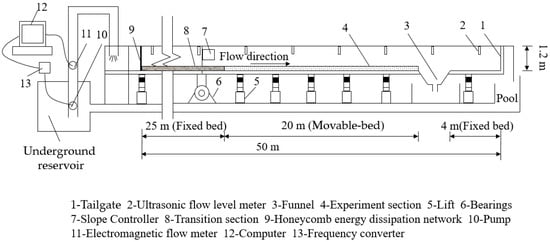
The experiments were conducted at the Daxing experiment base of the China Institute of Water Resources and Hydropower Research. The experiment flume, as depicted in
Figure 1, measures 50 m in length, 1 m in width, and 1.2 m in height, with an adjustable slope range of 0–0.01 and a 200 m
3 underground reservoir. The flume is equipped with a sophisticated measurement and control system that adjusts the flow rate through a computer-controlled frequency converter with feedback closed-loop control and measures the flow rate using an electromagnetic flow meter before flow enters the flume. The flow level and depth along the flume are monitored by eight ultrasonic-level meters mounted above the flume and twelve steel straightedges affixed to the flume sides. The transparent glass sides of the flume enable clear observation of sediment particle movement on the bed surface and the dynamics of dune movement. The slope gradient refers to the glass flume inclination angle. The slope gradient was adjusted using lifts, which automatically set the flume to the desired inclination before the experiment.
Approximately 25 m upstream of the flume, a transition section consisting of a 10 cm thick layer of 20 mm pebbles was installed, and the experiment section was situated about 20 m downstream of the flume. A funnel (length: 1 m; width: 1 m; depth: 0.8 m) was positioned between the end of the experiment section and the tailgate to collect sediment. The sediment captured in the funnel during the experiment was classified as bedload particles. The experiment sediment comprised uniformly sized crushed quartz sand particles with a median grain size of 0.83 mm, as depicted in the grading curve displayed in
Figure 2.
2.2. Experimental Design and Methods
Prior to initiating the experiment, a 10 cm thick layer of experiment sand was placed in the experiment section of the flume. To preserve the bedforms, the tailgate was initially closed, the flow rate at the inlet was set to a low value, and reverse flow from downstream was utilized. Once the water depth in the flume reached approximately 5 cm, the speed of the flume pump was adjusted to achieve the desired discharge for the experiment. Subsequently, the tailgate was adjusted to equalize the flow levels upstream and downstream of the flume, and the formal experiment commenced following the establishment of uniform flow.
Each experiment lasted between 14 and 20 h, with the exact duration depending primarily on the stability of the bedforms. The height of the bedforms was monitored and recorded every half hour. Once the bedforms stabilized, the experiment concluded. At the end of each experiment, the tailgate was closed, and the remaining water in the flume was gradually drained to prevent damage to the bedforms. After draining all the water, the bedforms were measured.
The conventional measurement methods for dune bedforms provide only basic data, such as dune length and height, which limit the depth of spatial analysis that can be conducted on the dunes. In contrast, a 3D laser scanner, specifically the Faro S350, offers high accuracy, speed, and a large volume of data. Practical experience has demonstrated that when the scanner head is oriented upwards, it can be obscured by the surrounding bedforms, creating a blind zone that hinders measurements at the flume bottom. Consequently, in this study, the scanner head was oriented downward, as illustrated in
Figure 3.
In this study, six white target balls were uniformly distributed along the inner side of the experiment section in the flume. Four measurement positions were established to assess the bedforms across the entire experiment section. The topographic data from these positions were integrated using the target balls to create a complete point cloud representation of the bedforms of the experiment. Data integration was performed using Faro SCENE software (v. 2024.0), resulting in a point cloud containing over 100 million points. To enhance the data processing efficiency, while maintaining measurement accuracy, we employed a spatial thresholding method, wherein data points spaced less than 1 mm apart were excluded.
The experimental setup included three slope gradients: 1‰, 2‰, and 4‰. For each slope, seven trials were conducted, i.e., twenty-one experiments in total. The parameters for each experiment are detailed in
Table 1. The minimum flow rate at which the bedload movement and partial bedforms formation started was determined experimentally. Initially, the bedforms in each experiment were flat. The flow rate plays a key role in the formation of bedforms. Specifically, when the open channel flow moves at a certain rate, the bedforms are subjected to shear stress from the water flow, causing sediment particles to move in a regular pattern, eventually forming bedforms with distinct characteristics.
Ripples are the initial stage of bedform development, and the size of the ripples is generally small. As the flow rate increases, the ripples continue to develop and gradually increase in size, forming dunes. There is no clear distinction between ripples and dunes, and both belong to the shape of bedforms. In this study, we focused on the shape characteristics of bedforms, and therefore made no distinction between the ripples and the dunes.
The water depth h was read using a steel ruler mounted on the outer wall of the glass flume. Twelve steel rulers were installed along the glass flume for the easy reading of water depth. The Froude number (Fr) and the friction velocity (u*) were calculated using formulas.
2.3. Measurement Parameters
2.3.1. Bedform Parameters
The bedforms generated in this experiment exhibit both 2D and 3D topographies. In this study, three longitudinal profiles were extracted: one from the center of the flume width and two others at intervals of 20 cm to the left and right. Additionally, cross-sectional profiles were extracted every 3 m along the length of the flume, starting from the 2 m position, as shown in
Figure 4. From the longitudinal profile perspective, the arrangement of crests and troughs on the 2D bedform is noticeably more regular than that on the 3D bedform (
Figure 4a,c). From the cross-sectional profile perspective, the elevation variation across the flume width is significantly smaller for the 2D bedform compared to that for the 3D bedform (
Figure 4b,d).
To analyze the evolution of bedform features, four longitudinal profiles of bed elevation were extracted at 20 cm intervals across the flume width (excluding the boundaries) from left to right for each experiment.
In this study, the 2D and 3D dune bedforms were analyzed after detrending using the original bed height as the zero axis at equilibrium. Subsequent to each experiment, the length, height, crest height, and trough depth of the dunes were examined. The relative positions of these bedform parameters are illustrated in
Figure 5.
(1) Dune length
This research defines four types of dune lengths: Lc, the horizontal distance between the adjacent crests; Lt, the horizontal distance between the adjacent troughs; Lupcr, the horizontal distance between two adjacent nodes with positive slopes on the zero axis at equilibrium; and Ldowncr, the horizontal distance between two adjacent nodes with negative slopes on the zero axis at equilibrium. The average lengths for each type are denoted as Lc-ave, Lt-ave, Lupcr-ave, and Ldowncr-ave, respectively. The “average” value for each bedform parameter was calculated as the arithmetic mean of the corresponding values obtained from the identified bedforms.
(2) Dune height
Dune heights are typically categorized into two types: the stoss-side dune height (Δs), which is the vertical distance between the crest and the adjacent upstream trough, and the lee-side dune height (Δl), which is the vertical distance between the crest and the adjacent downstream trough. The average stoss-side and lee-side dune heights are denoted as Δs-ave and Δl-ave, respectively.
(3) Crest height and trough depth
In this study, the crest height (ηc) is defined as the vertical distance from the crest to the zero axis at equilibrium, whereas the trough depth (ηt) represents the vertical distance from the trough to the zero axis at equilibrium. The average values for the crest height and the trough depth are represented as ηc-ave and ηt-ave, respectively.
2.3.2. Bedload Transport Intensity and Flow Intensity
The bedload transport rate during the experiment was measured using test pits. The sand captured by the funnel was considered as the bedload particles. The streamwise bedload transport rate (
gb) was calculated using the following formula:
where
gb denotes the streamwise bedload transport rate, kg/m/min;
m denotes the mass of the bedload falling into the funnel within the time interval t, kg;
t denotes the time interval, min; and
L indicates the width of the flume, m.
where Φ denotes the bedload transport intensity, N/(s·m); rs denotes the specific gravity of experiment sand, N/m3; r denotes the specific gravity of experiment water, N/m3; and D denotes the experiment sand particle size, m.
where Ψ denotes the flow parameter; θ denotes the Shields parameter, which represents the flow intensity and is expressed as ; and τ0 denotes shear stress on the bed. This is expressed as , N/m2.
The parameters Φ and θ are well-known Einstein parameters for the bedload transport rate. In this study, the calculation formulas for these two parameters are provided for an thorough explanation of the experimental process.
2.3.3. Bed Resistance
Predicting bed resistance is a challenging aspect of river dynamics. Bed resistance comprises sediment resistance, which arises from the uneven distribution of sediment particles on the bed surface, and shape resistance, which results from undulations of the dune bedforms [
27]. This study analyzed bed resistance using Manning’s formula, derived from the data obtained during the movable-bed dune experiments:
where u denotes the average flow velocity, m/s; n indicates Manning’s roughness, which represents the bed resistance; R represents the hydraulic radius, m; and J indicates the slope gradient.
3. Results
3.1. Statistical Patterns of Bedform Features
The topographic data collected using a 3D laser scanner revealed that at a 1‰ slope, two-dimensional (2D) bedforms formed at a discharge between 30 and 50 L/s, while three-dimensional (3D) bedforms developed at a discharge of 60–90 L/s. At slopes of 2‰ and 4‰, only 3D bedforms were observed across all the experiment discharges.
3.1.1. Dune Length Variation Characteristics
The probability density distribution of dune length, as fitted by the program, is depicted in
Figure 6. Panels (a) through (d) of
Figure 6 illustrate the distribution of the dune lengths (
Lc,
Lt,
Lupcr, and
Ldowncr) for the 2D bedforms, while panels (e) through (h) display the distribution for the 3D bedforms. The results indicate that the four dune lengths (
Lc,
Lt,
Lupcr, and
Ldowncr) for both the 2D and 3D bedforms adhere to a lognormal distribution. The parameters of the lognormal distribution for the dune length of the 2D and 3D bedforms are listed in
Table 2. According to
Table 2, the mean log standard deviations for the dune length of the 2D and 3D bedforms are 0.58 and 0.45, respectively. The mean log standard deviation for the 2D bedforms is marginally higher than that for the 3D bedforms by 0.13, which reflects a disparity in the distribution of dune lengths, as depicted in
Figure 6a–d.
3.1.2. Dune Height Variation Characteristics
The probability density distribution of dune height, as fitted by the program, is shown in
Figure 7. Panels (a) and (b) of
Figure 7 depict the distributions of dune heights (Δ
s and Δ
l) for the 2D bedforms, and panels (c) and (d) illustrate the distributions for the 3D bedforms. The results reveal that the dune heights (Δ
s and Δ
l) for the 2D bedforms follow a Gamma distribution, whereas those for the 3D bedforms follow a lognormal distribution. The distribution parameters for the dimensionless dune heights of the 2D and 3D bedforms are detailed in
Table 3. For the 2D bedforms, the Gamma distributions of Δ
s and Δ
l exhibit shape parameters of 15.185 and 15.610, respectively, and scale parameters of 0.066 and 0.064, respectively. The shape and scale parameters for Δ
s are similar to those for Δ
l. The mean and standard deviations corresponding to the lognormal distributions of Δ
s for the 3D bedforms exhibit characteristics similar to those of Δ
l.
3.1.3. Crest Height and Trough Depth Variation Characteristics
The probability density distributions of the crest height and the trough depth fitted by the program are shown in
Figure 8.
Figure 8a,b represents the distributions of the crest height
ηc and the trough depth
ηt of the 2D bedforms, and
Figure 8c,d represents the distributions of the crest height
ηc and the trough depth
ηt of the 3D bedforms. The results demonstrate that the
ηc and
ηt of the 2D bedforms obey the normal distribution, and the
ηc and
ηt for the 3D bedforms obey the Gamma distribution.
Table 4 outlines the distribution parameters for the dimensionless crest height and trough depth of both the 2D and 3D bedforms. The standard deviation for the crest height of the 2D bedforms, which follows a normal distribution, is 0.334. This value is slightly smaller than that for the trough depth, resulting in a steeper probability density distribution curve for the crest height compared to that of the trough depth. Conversely, the scale parameter for the trough depth of the 3D bedforms following a Gamma distribution is 0.324, which is slightly larger than that for the crest height. This attribute produced a more dispersed probability density distribution curve for the trough depth compared to that of the crest height.
3.2. Bedload Transport Rate on Dune Bedforms
In the late 19th century, Du Boys in France initially proposed a theory of drag forces for bedload transport [
47]. Subsequently, numerous researchers have expanded on this topic, developing a variety of formulas and theoretical frameworks [
48]. Notable among these are the Meyer–Peter formula [
26,
27] and the Engelund formula [
29]. Later, Chinese scholars streamlined these bedload transport formulas and standardized their format [
49].
Based on the bedload transport rate measured during the experiment and the flow conditions (
Table 1), the bedload transport intensity and the flow intensity at the different slopes were computed. These calculations were performed using the representative bedload transport formulas derived from the experimental results, as illustrated in
Figure 9.
Figure 9 indicates that in the presence of dunes, the bedload transport rates estimated by the representative formulas for uniform sediment deviate from the measured sediment transport rates. These deviations are more pronounced at higher flow intensities and in more fully developed dune bedforms. Specifically, at a low flow intensity (
θ < 0.1), the sediment transport rates calculated by the representative formulas approximate the average measured sediment transport rate; however, at a medium-to-high flow intensity (
θ ≥ 0.1), the calculated rates generally exceed the average measured rate.
At low flow intensities, significant variability was observed in the bedload transport rates measured in each experiment group, particularly in the experiments conducted on low-slope bedforms, where the maximum rate exceeded the minimum by more than fivefold. This variability can be attributed to the group transport of bedload particles. When dunes are present on the bed surface, their movement during the low-flow-intensity tests (θ < 0.1) is relatively slow. Consequently, during the measurement of the bedload transport rates, the dune crests and troughs alternately enter the pit during different measurement periods, leading to substantial fluctuations in the measured transportation rates. Conversely, in the experiments conducted at medium-to-high flow intensities (θ ≥ 0.1), the dunes move more rapidly, and multiple dunes enter the pit during each measurement period, thereby reducing the variability in the measured bedload transport rates.
This study employed a nonlinear least square fitting method to derive a bedload transport formula for dune bedforms based on the measured rates and flow intensities as follows. The meaning of each physical parameter is the same as above:
The comprehensive error of the bedload transport formula for dune bedforms was quantified using the Mean Square Error (MSE) between the experimentally measured and calculated sediment transport rates, as expressed in Equation (6). The results indicate a comprehensive error of 0.016, demonstrating the high accuracy of the proposed formula.
where N denotes the total number of measurements of bedload transport intensities; Φi-measured and Φi-computed denote the i-th measured and calculated bedload transport intensities, respectively.
3.3. Bed Resistance
The experimental data were used to determine the average lengths and heights of the dunes under the different slopes, and these were analyzed alongside corresponding the bed resistance measurements, as illustrated in
Figure 10.
On the same slope, an increase in flow intensity generally corresponds to an increase in dune height, with bed resistance exhibiting a significant positive correlation with dune height. Notably, the maximum bed resistance recorded was 0.0204 on both the 2‰ and 4‰ slopes. However, the dune heights at these slopes were 12.2 cm and 13.8 cm, respectively, indicating that although bed resistance increases with flow intensity, the dune height does not consistently follow this trend.
The relationship between bed resistance and dune length under varying flow conditions across the three slopes is not clearly defined. From the experiments results, there is no direct and obvious correlation between bed resistance and the dune length.
To further examine the patterns of change in bed resistance, the correlation between measured bed resistance and bedload transport intensity was analyzed and is illustrated in
Figure 11. This figure reveals a significant positive correlation between bed resistance and bedload transport intensity. Within the same slope, the data from the different experiment groups are distributed across distinct regions; however, they exhibit a consistent overall trend of increasing bed resistance with heightened bedload transport intensity.
5. Conclusions
This study developed a system for measuring flow–sediment movement and three-dimensional bedforms, collected data under various slopes and flow conditions, and analyzed the statistical distribution patterns of two-dimensional and three-dimensional bedforms characterization parameters. It also examined the characteristics of bedload transport on dune bedforms and assessed the impact of bedload transport on bed resistance. The major conclusions are stated as follows:
The experiments demonstrated that the bedforms can evolve into two-dimensional and three-dimensional dunes under different slopes and flow conditions. The statistical analysis of bedform parameters, such as the dune length, the dune height, the crest height, and the trough depth exhibited that the dune length followed a lognormal distribution, whereas the dune height followed Gamma and lognormal distributions for the two-dimensional and three-dimensional bedforms, respectively. The crest height and the trough depth followed normal and Gamma distributions, respectively. These findings provide a quantitative framework for predicting bedform evolution.
This study challenged the applicability of the traditional bedload transport formulas to dune bedforms and experimentally showed that the sediment transport rates calculated by these formulas significantly deviated from the measured values in the presence of dunes. A new bedload transport formula was proposed and derived from fitting the measured data using the nonlinear least squares method. This formula considers the relationship between bedload transport intensity and flow intensity, demonstrating high accuracy, with a comprehensive error of 0.016. This proposed formula is significant for improving the accuracy of the prediction of bedload transport rates.
At high flow intensities, mass bedload transport significantly contributes to increased bed resistance. The dune height was positively correlated with bed resistance, whereas the influence of dune length on bed resistance was less significant. Although the dune height did not consistently increase with rising flow intensity, the increase in bedload transport notably contributed to bed resistance. This insight is crucial for understanding and predicting the sediment transport capacity of rivers.