Author Contributions
Conceptualization, D.-S.J. and L.C.; methodology, K.S., B.C. and L.C.; validation, M.W.; formal analysis, M.W., W.S. and Y.G.; investigation, M.W., W.S. and Y.G.; resources, D.-S.J., K.S., B.C. and H.Z.; data curation, M.W., W.S. and Y.G.; writing—original draft preparation, M.W.; writing—review and editing, D.-S.J., L.C., K.S., B.C. and H.Z.; visualization, M.W.; supervision, D.-S.J. and L.C.; project administration, D.-S.J.; funding acquisition, D.-S.J. All authors have read and agreed to the published version of the manuscript.
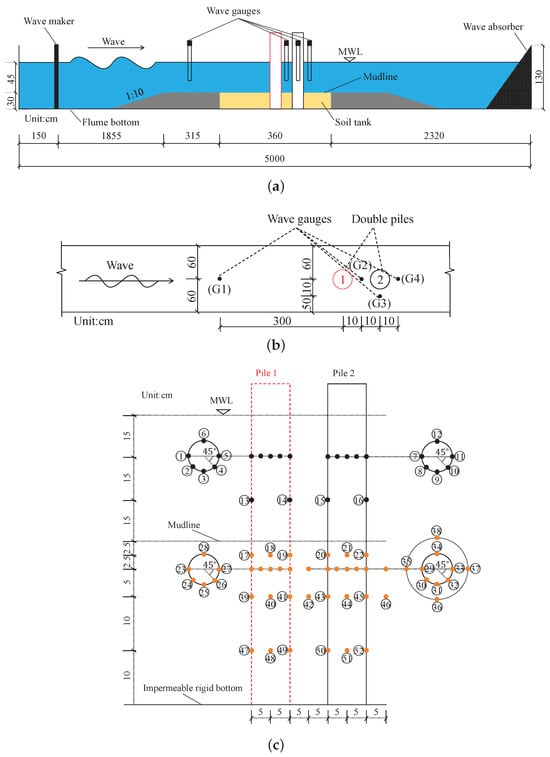
Schematic diagram of the experimental setup: (a) the side view of the wave flume; (b) plane view of wave flume and locations of wave gauges; and (c) location of wave pressure sensors and pore pressure sensors.
Figure 1.
Schematic diagram of the experimental setup: (a) the side view of the wave flume; (b) plane view of wave flume and locations of wave gauges; and (c) location of wave pressure sensors and pore pressure sensors.
Arrangement schemes for the single-pile case (Case A) and the double-pile cases that include double piles with various spacing (Case B and Case C), different pile diameters (Case D and Case E), staggered piles (Case F), and side-by-side piles (Case G).
Figure 2.
Arrangement schemes for the single-pile case (Case A) and the double-pile cases that include double piles with various spacing (Case B and Case C), different pile diameters (Case D and Case E), staggered piles (Case F), and side-by-side piles (Case G).

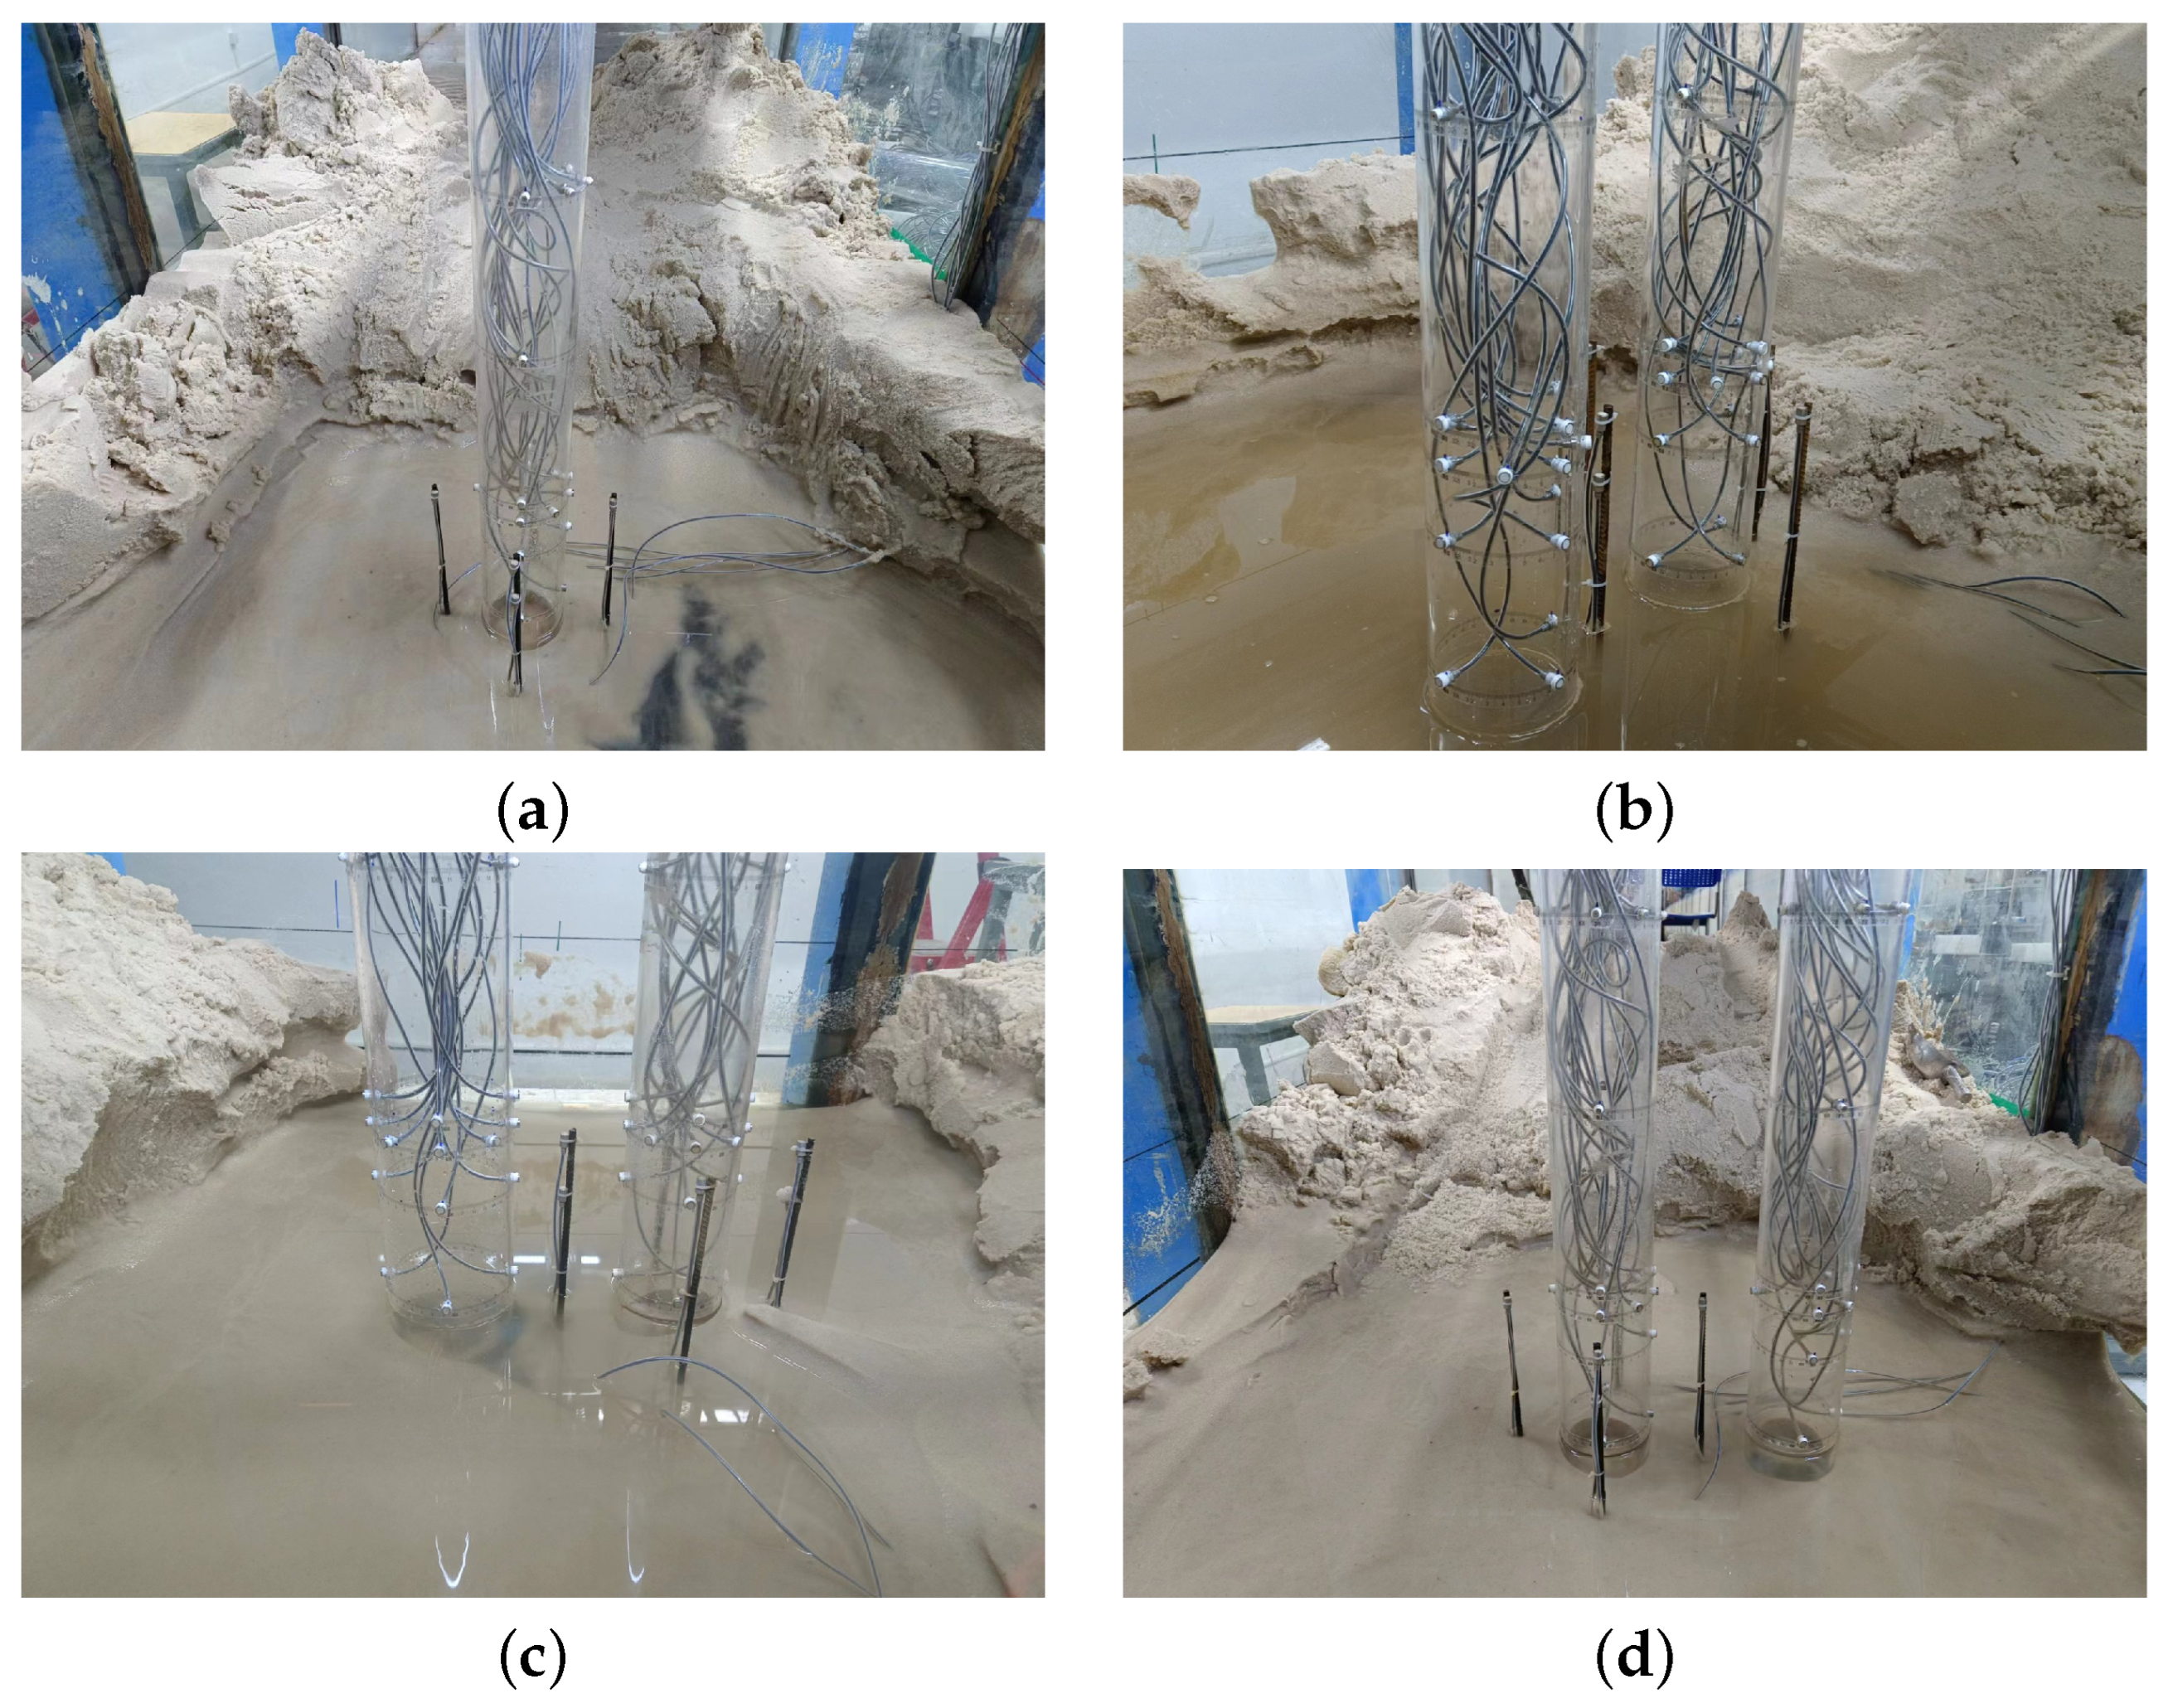
Photos of the experimental sites: (a) single pile (Case A); (b) double piles with , , m (Case B); (c) double piles with , , m (Case E); (d) double piles with , , m (Case G).
Figure 3.
Photos of the experimental sites: (a) single pile (Case A); (b) double piles with , , m (Case B); (c) double piles with , , m (Case E); (d) double piles with , , m (Case G).
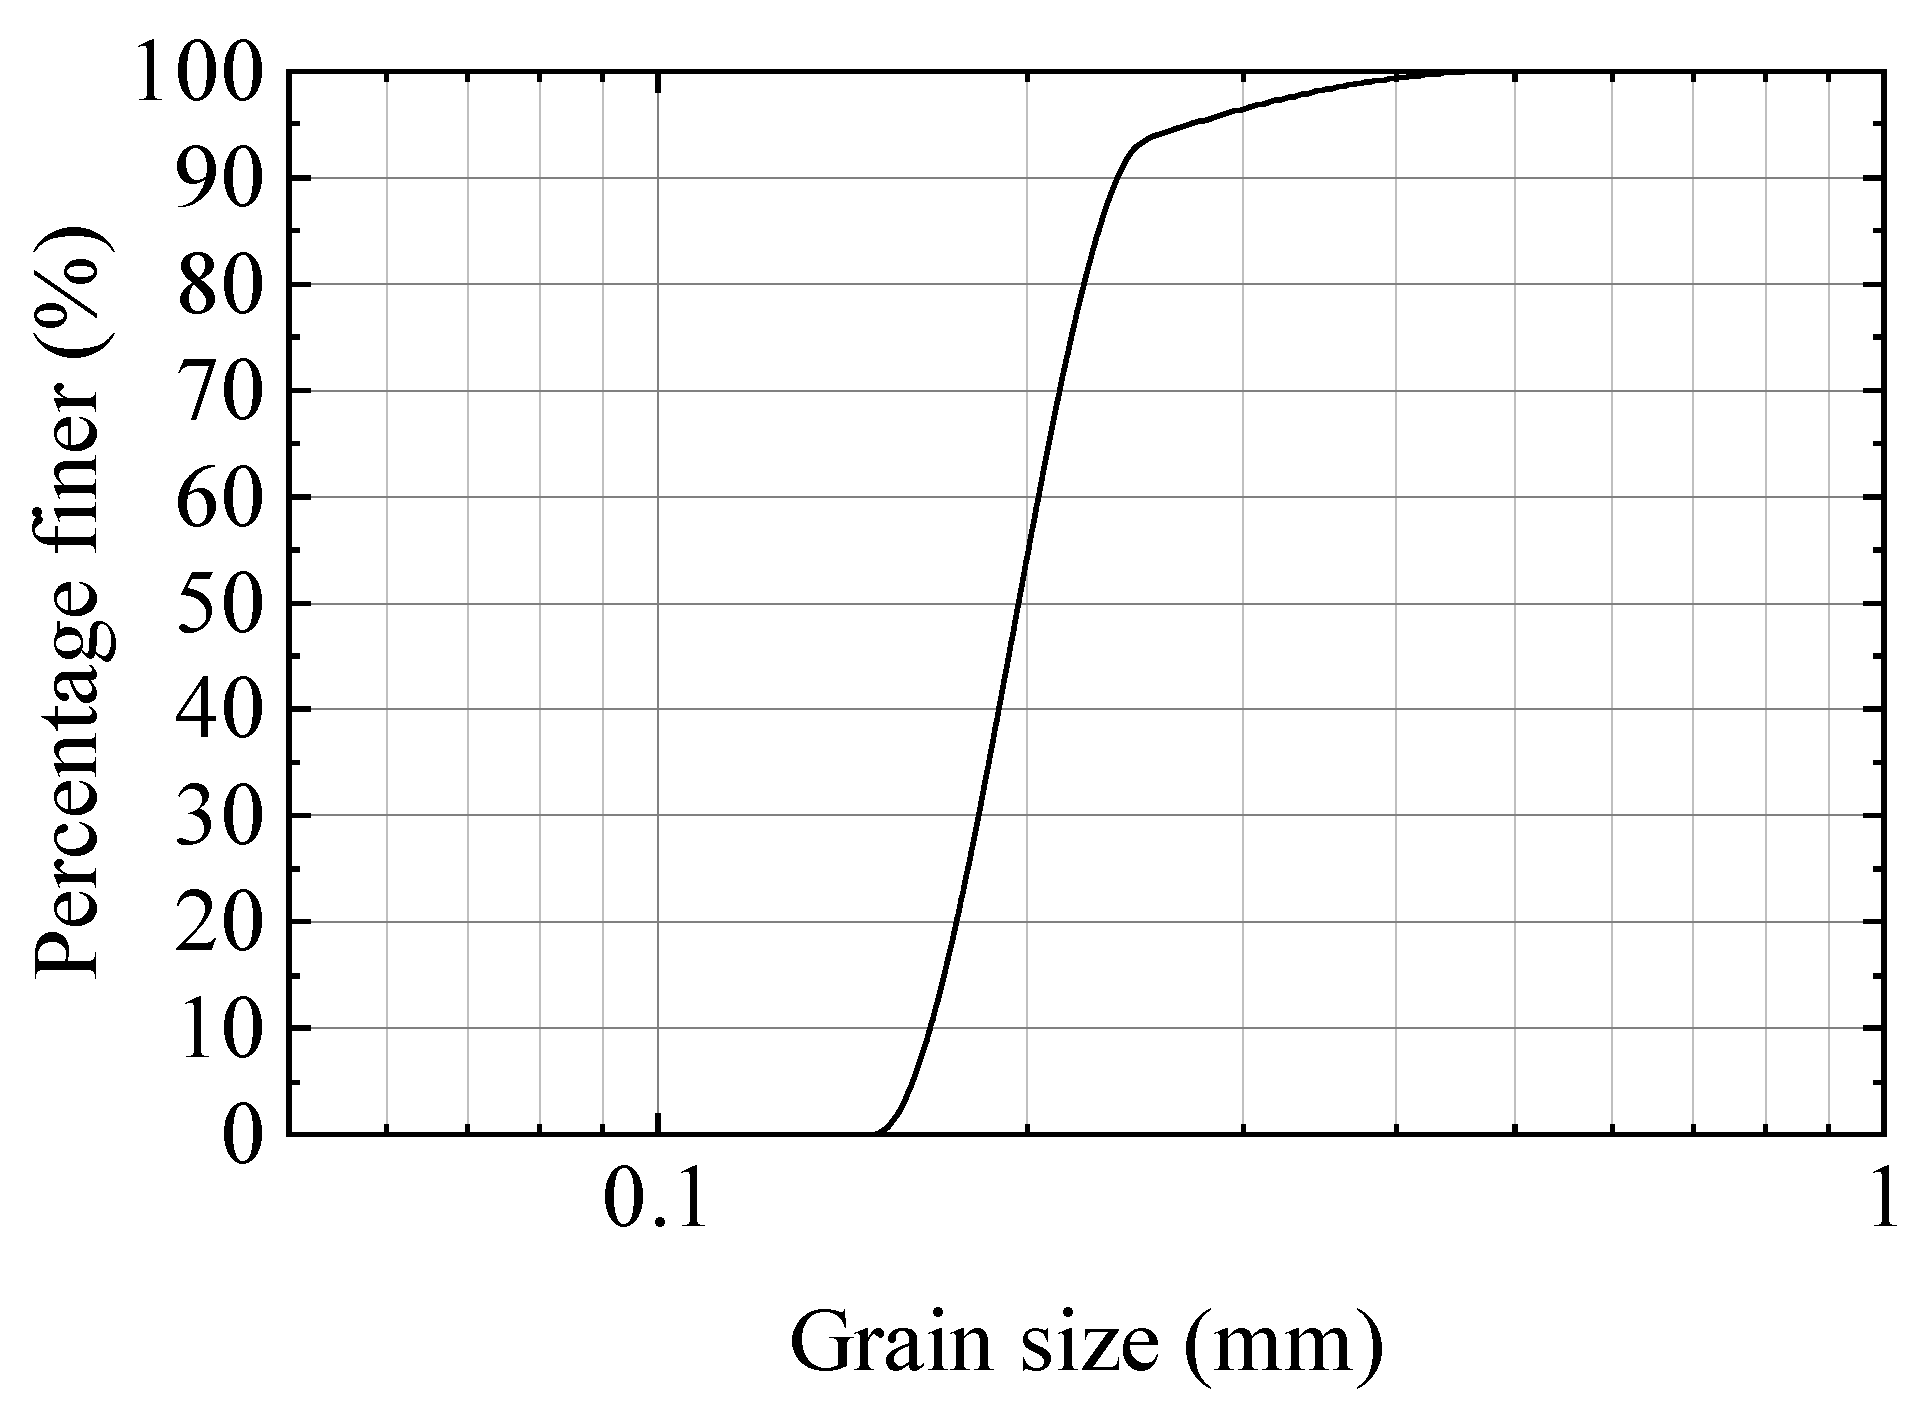
The grain size distribution of the soil sample: mm, mm, mm, mm, , and .
Figure 4.
The grain size distribution of the soil sample: mm, mm, mm, mm, , and .
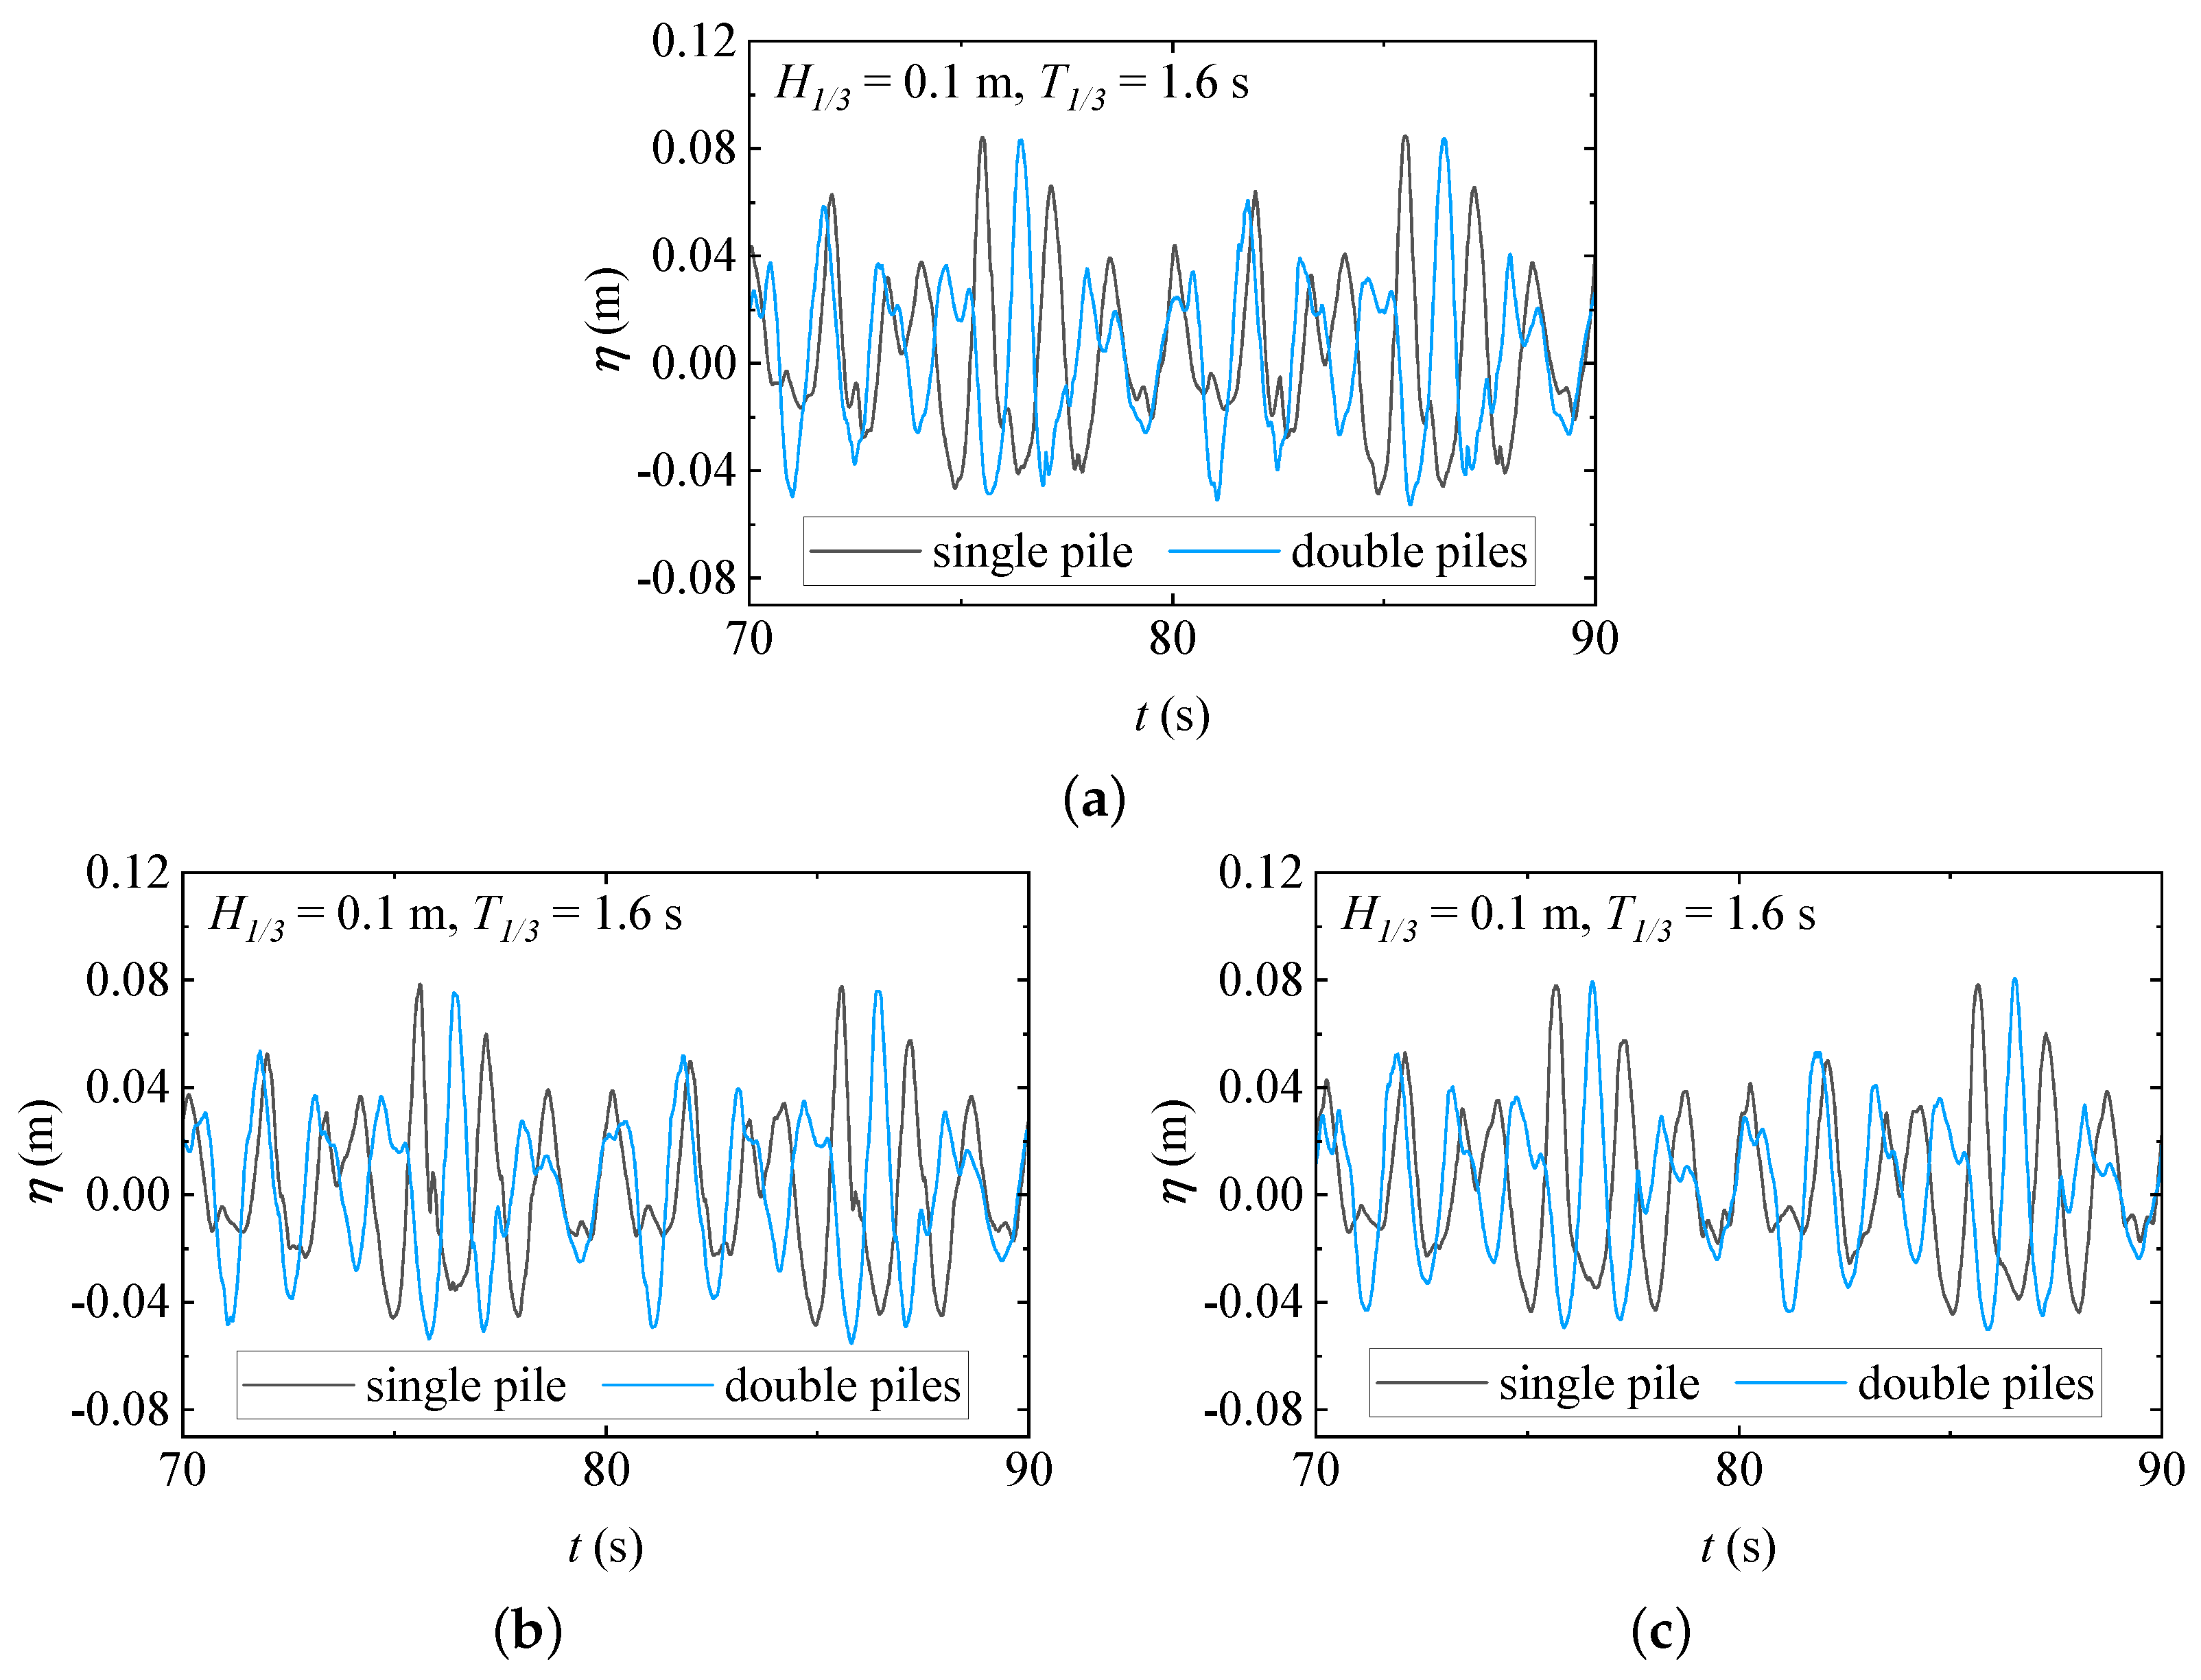
Wave profiles at a distance of 0.05 m around the single and double piles under the action of random waves: (a) G2 (single and double piles); (b) G3 (single and double piles); (c) G4 (single and double piles). ( m, s.)
Figure 5.
Wave profiles at a distance of 0.05 m around the single and double piles under the action of random waves: (a) G2 (single and double piles); (b) G3 (single and double piles); (c) G4 (single and double piles). ( m, s.)
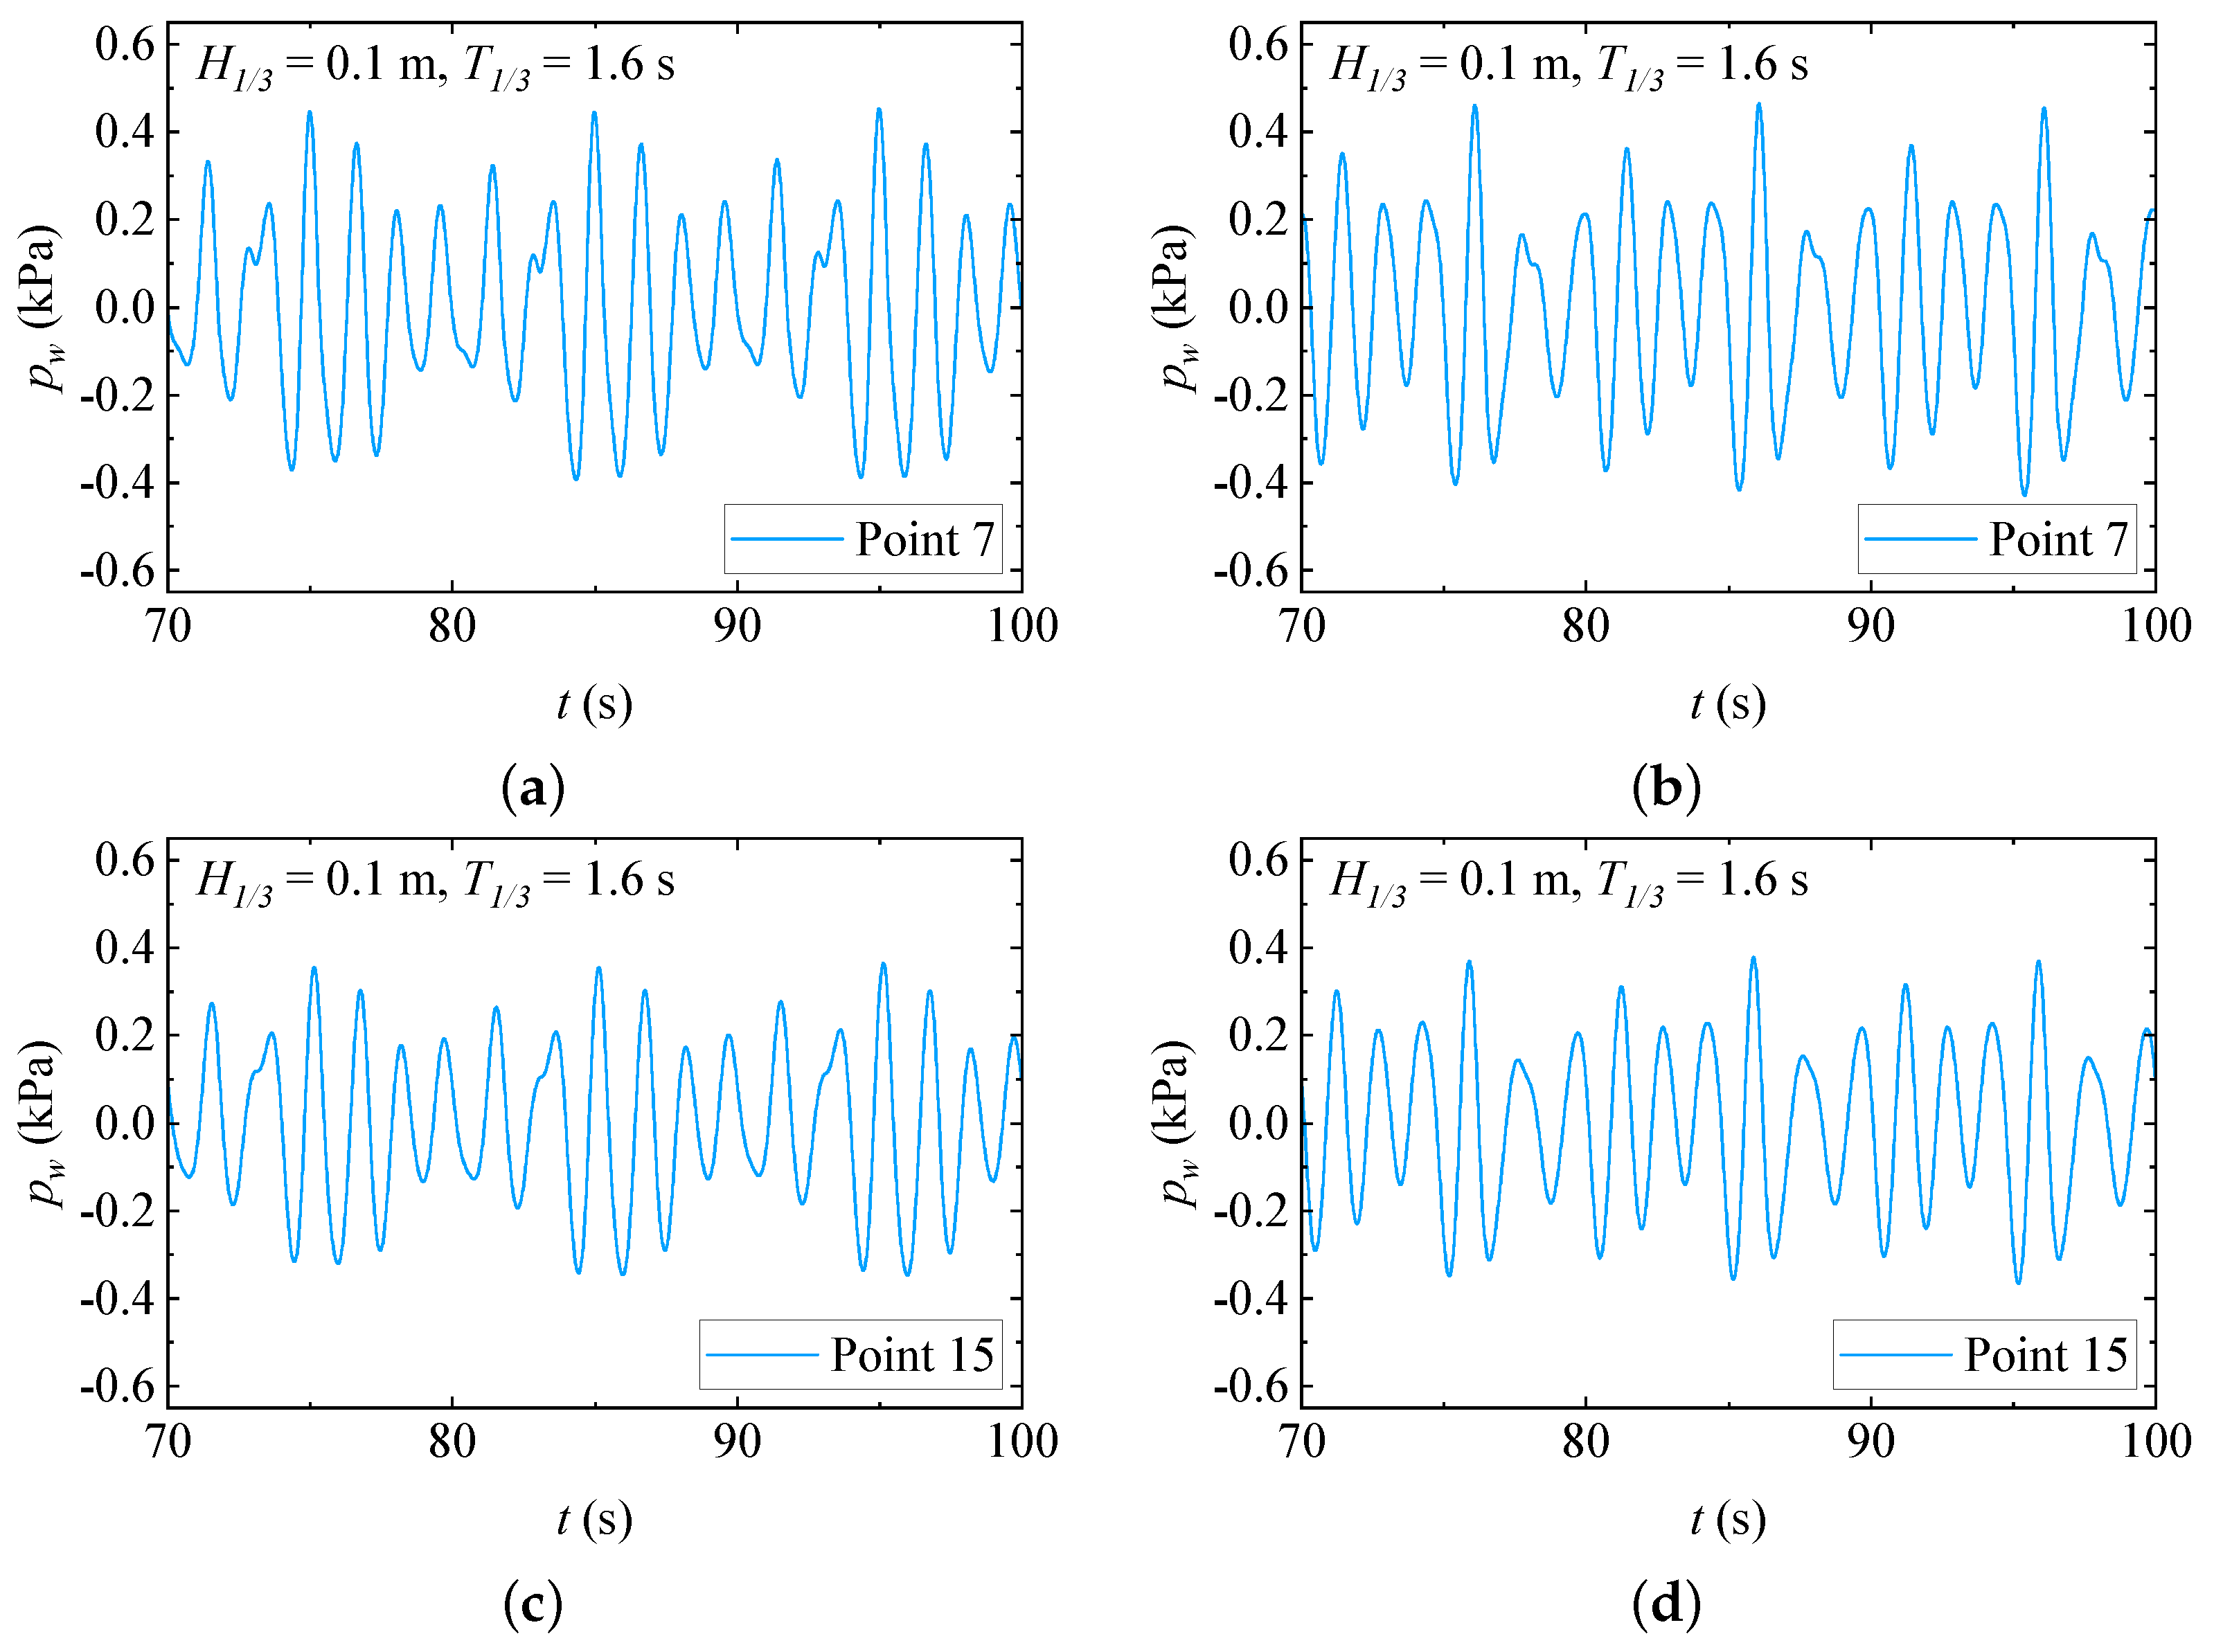
Time history of the dynamic wave pressures on the front surface of single pile and pile 2: (a,c) single pile (Case A); (b,d) pile 2 in the double piles (Case B). ( m, s). (a) P7 (single pile), (b) P7 (pile 2), (c) P15 (single pile), (d) P15 (pile 2).
Figure 6.
Time history of the dynamic wave pressures on the front surface of single pile and pile 2: (a,c) single pile (Case A); (b,d) pile 2 in the double piles (Case B). ( m, s). (a) P7 (single pile), (b) P7 (pile 2), (c) P15 (single pile), (d) P15 (pile 2).
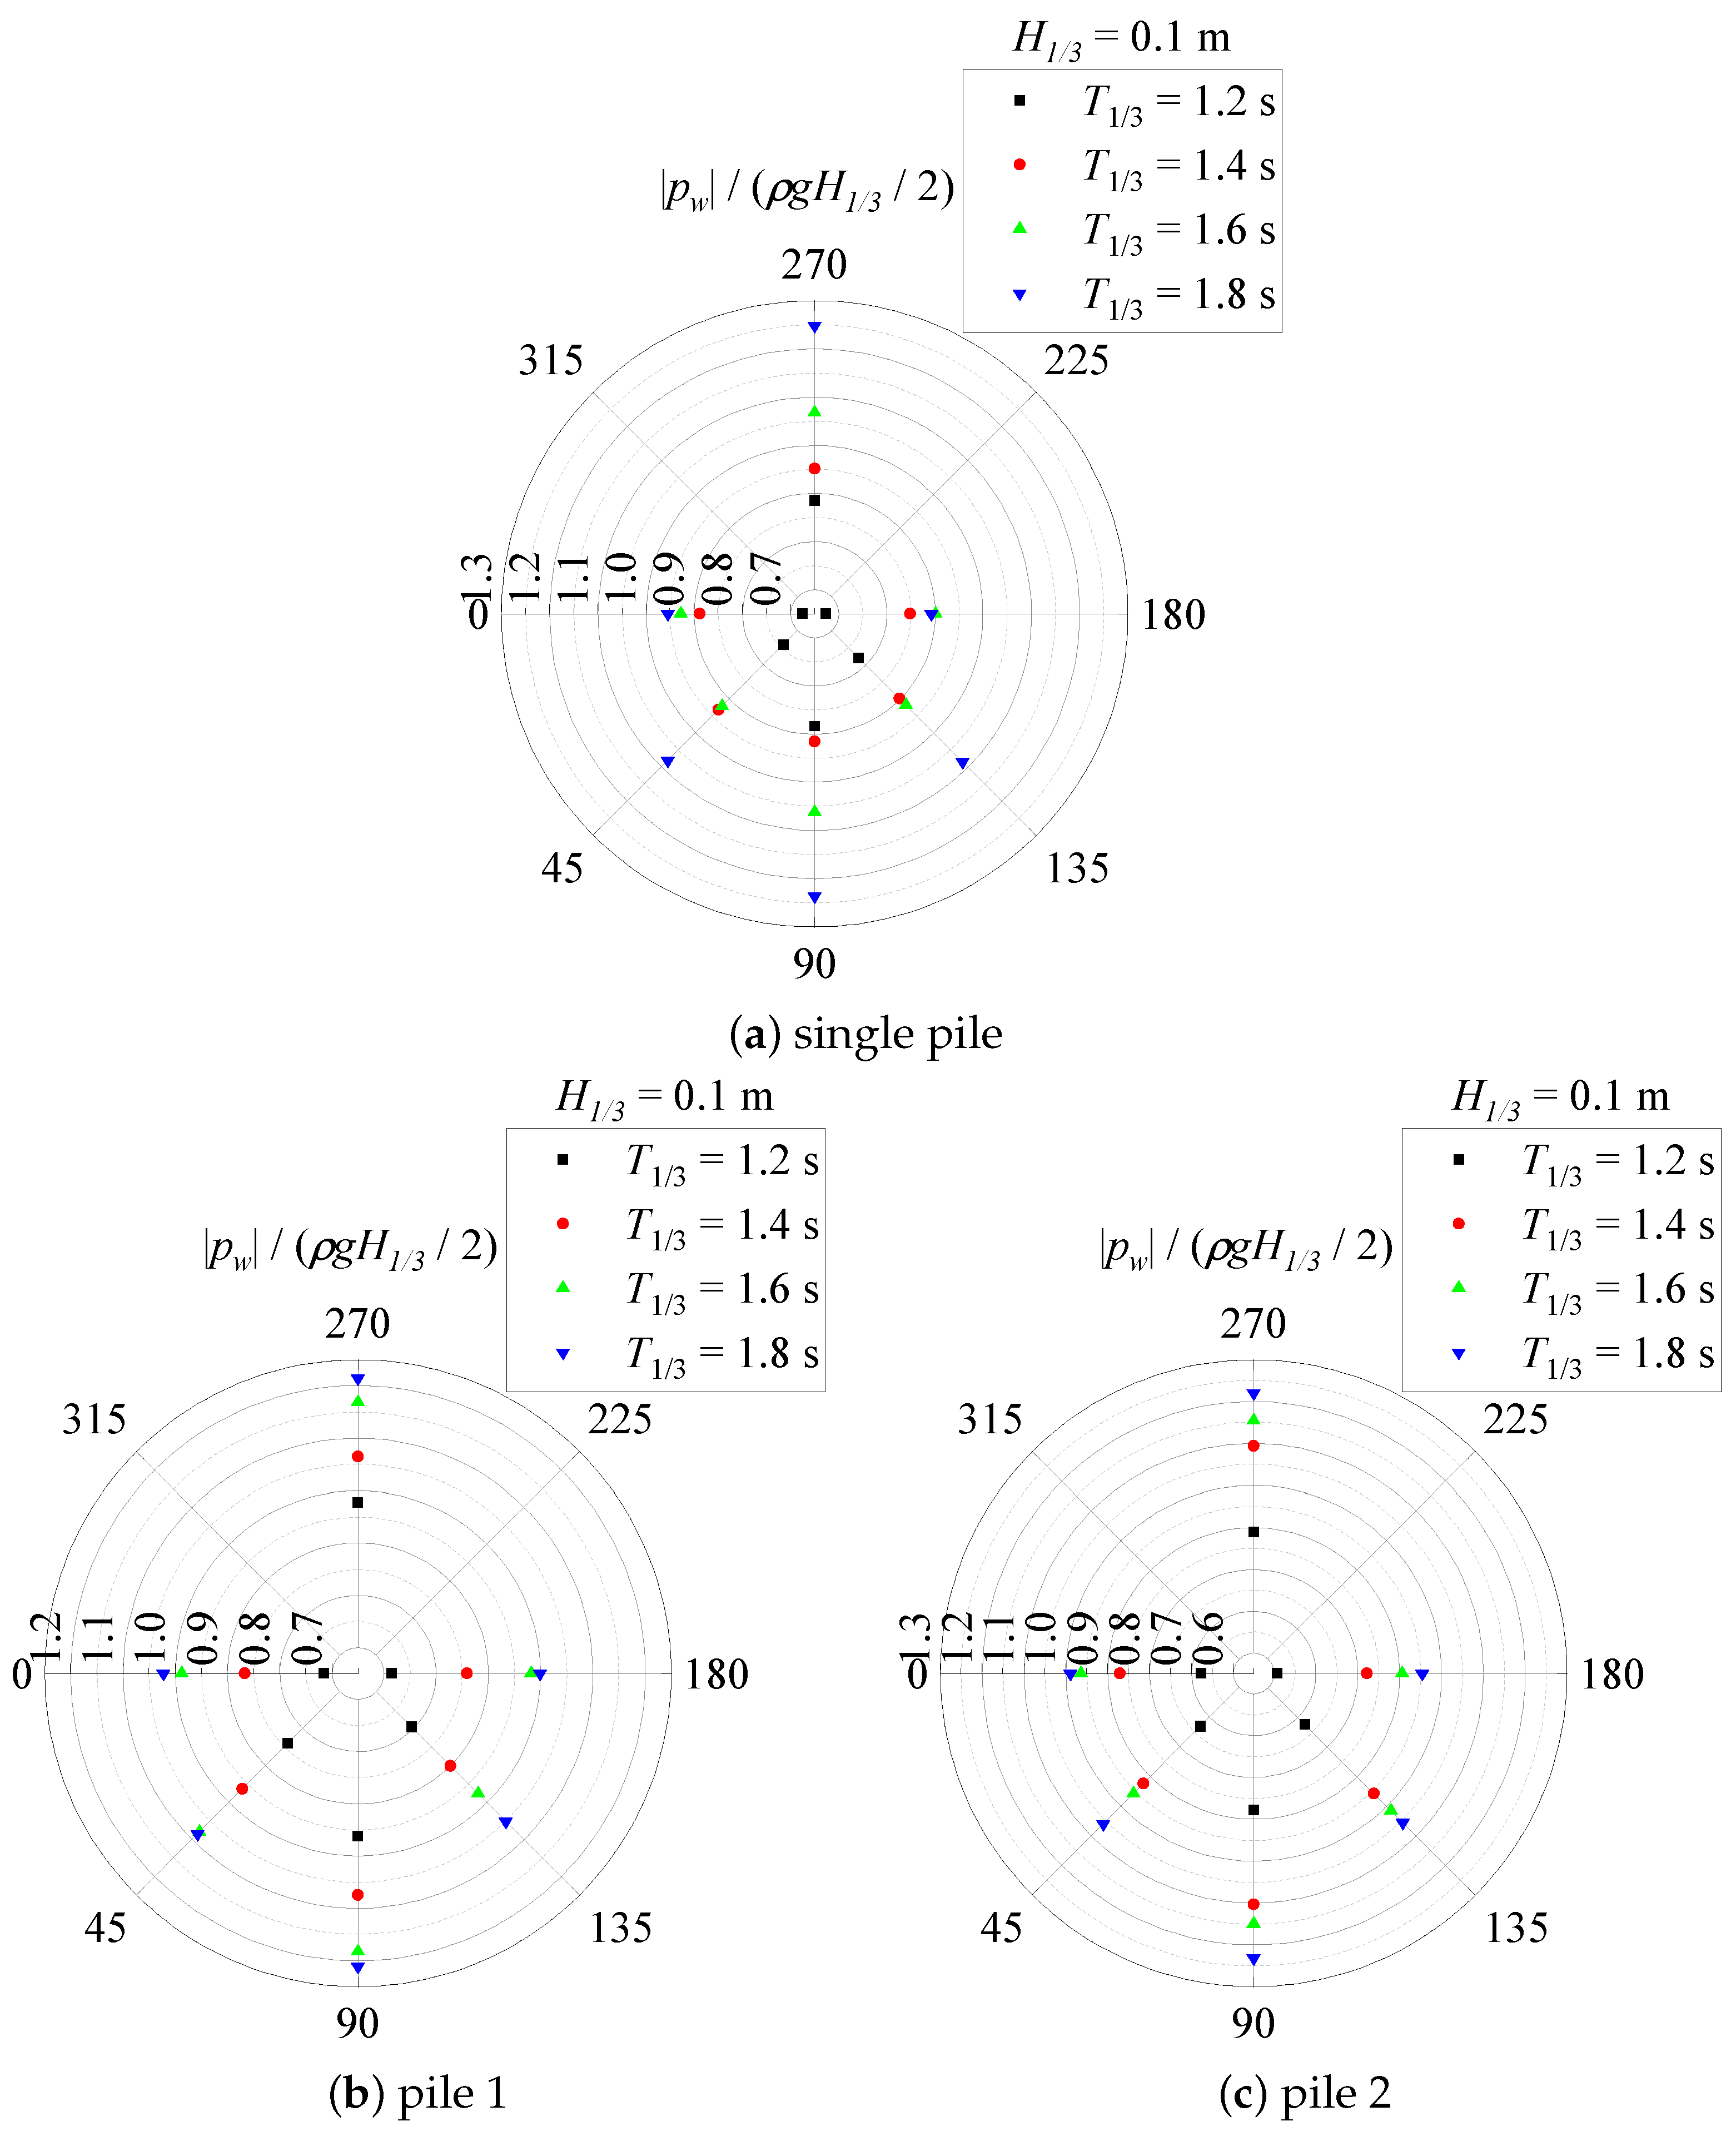
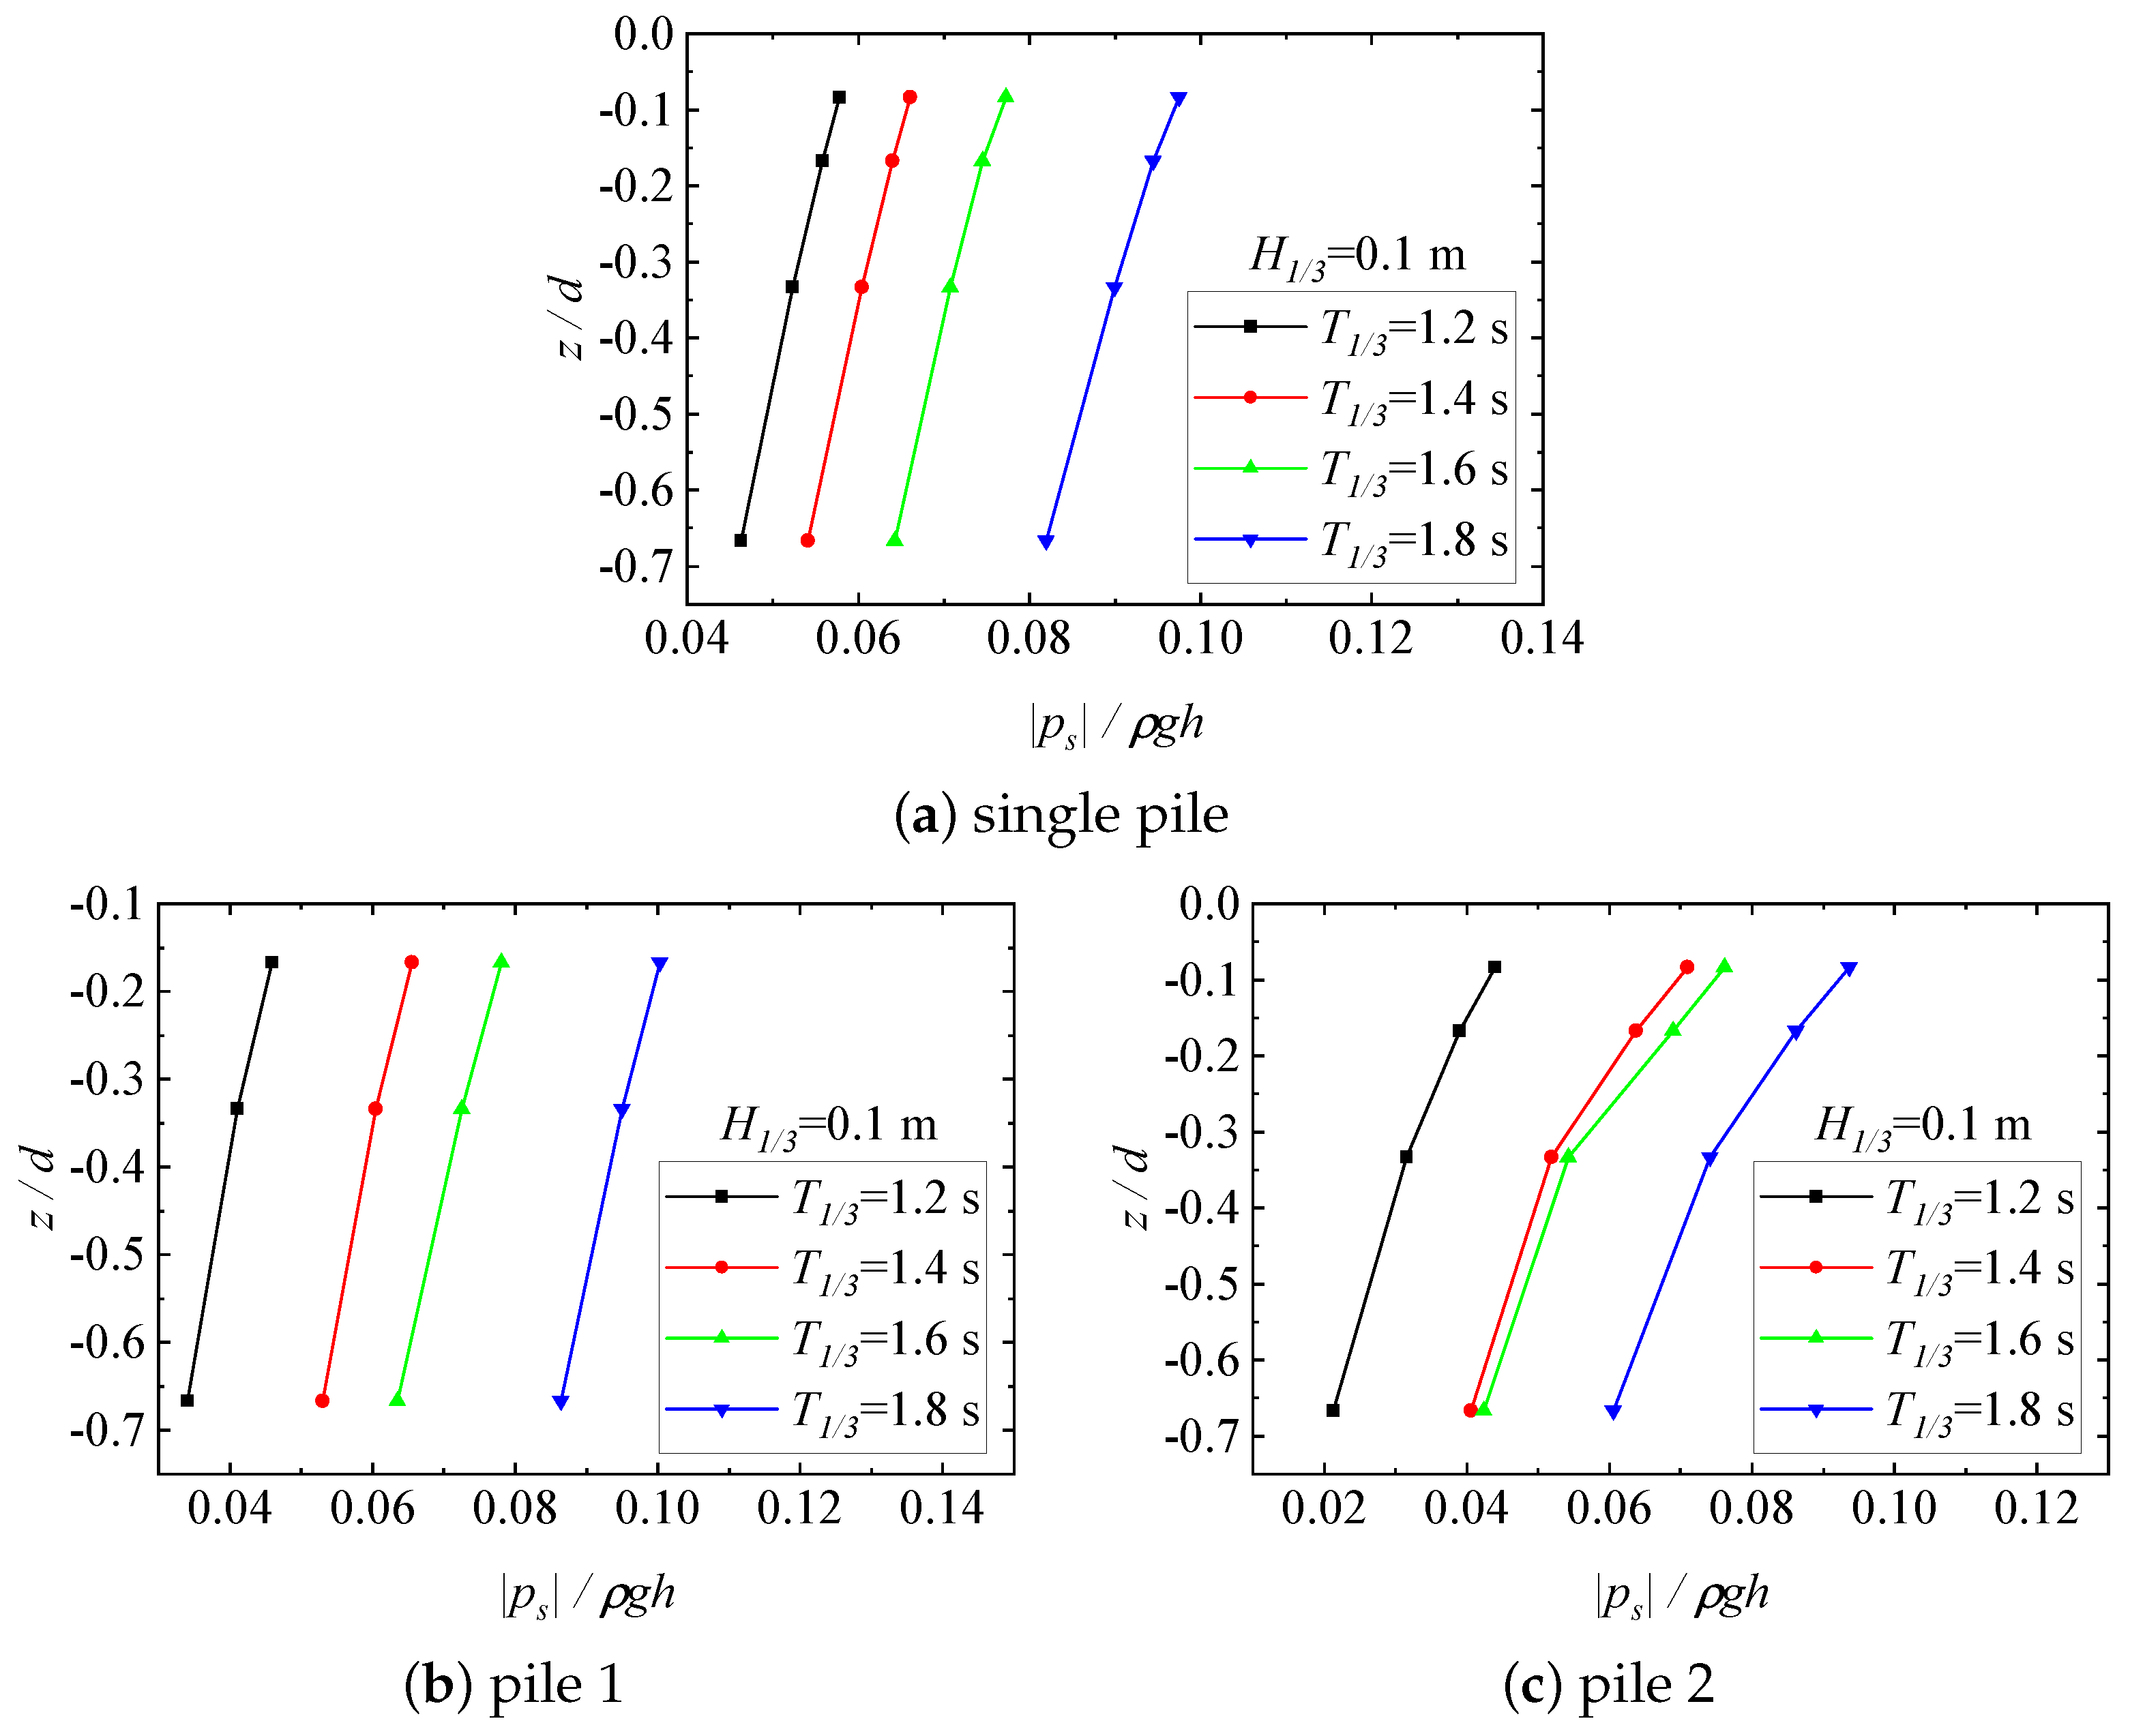
Spatial distributions of the dynamic wave pressures on the surface of the single and double piles caused by random waves under different significant wave periods: (a) single pile (Case A); (b) pile 1 in double piles (Case B); (c) pile 2 in double piles (Case B). ( m, s. Pile 1: m, , points 1–6. Pile 2 and single pile: m m, , points 7–12.)
Figure 7.
Spatial distributions of the dynamic wave pressures on the surface of the single and double piles caused by random waves under different significant wave periods: (a) single pile (Case A); (b) pile 1 in double piles (Case B); (c) pile 2 in double piles (Case B). ( m, s. Pile 1: m, , points 1–6. Pile 2 and single pile: m m, , points 7–12.)
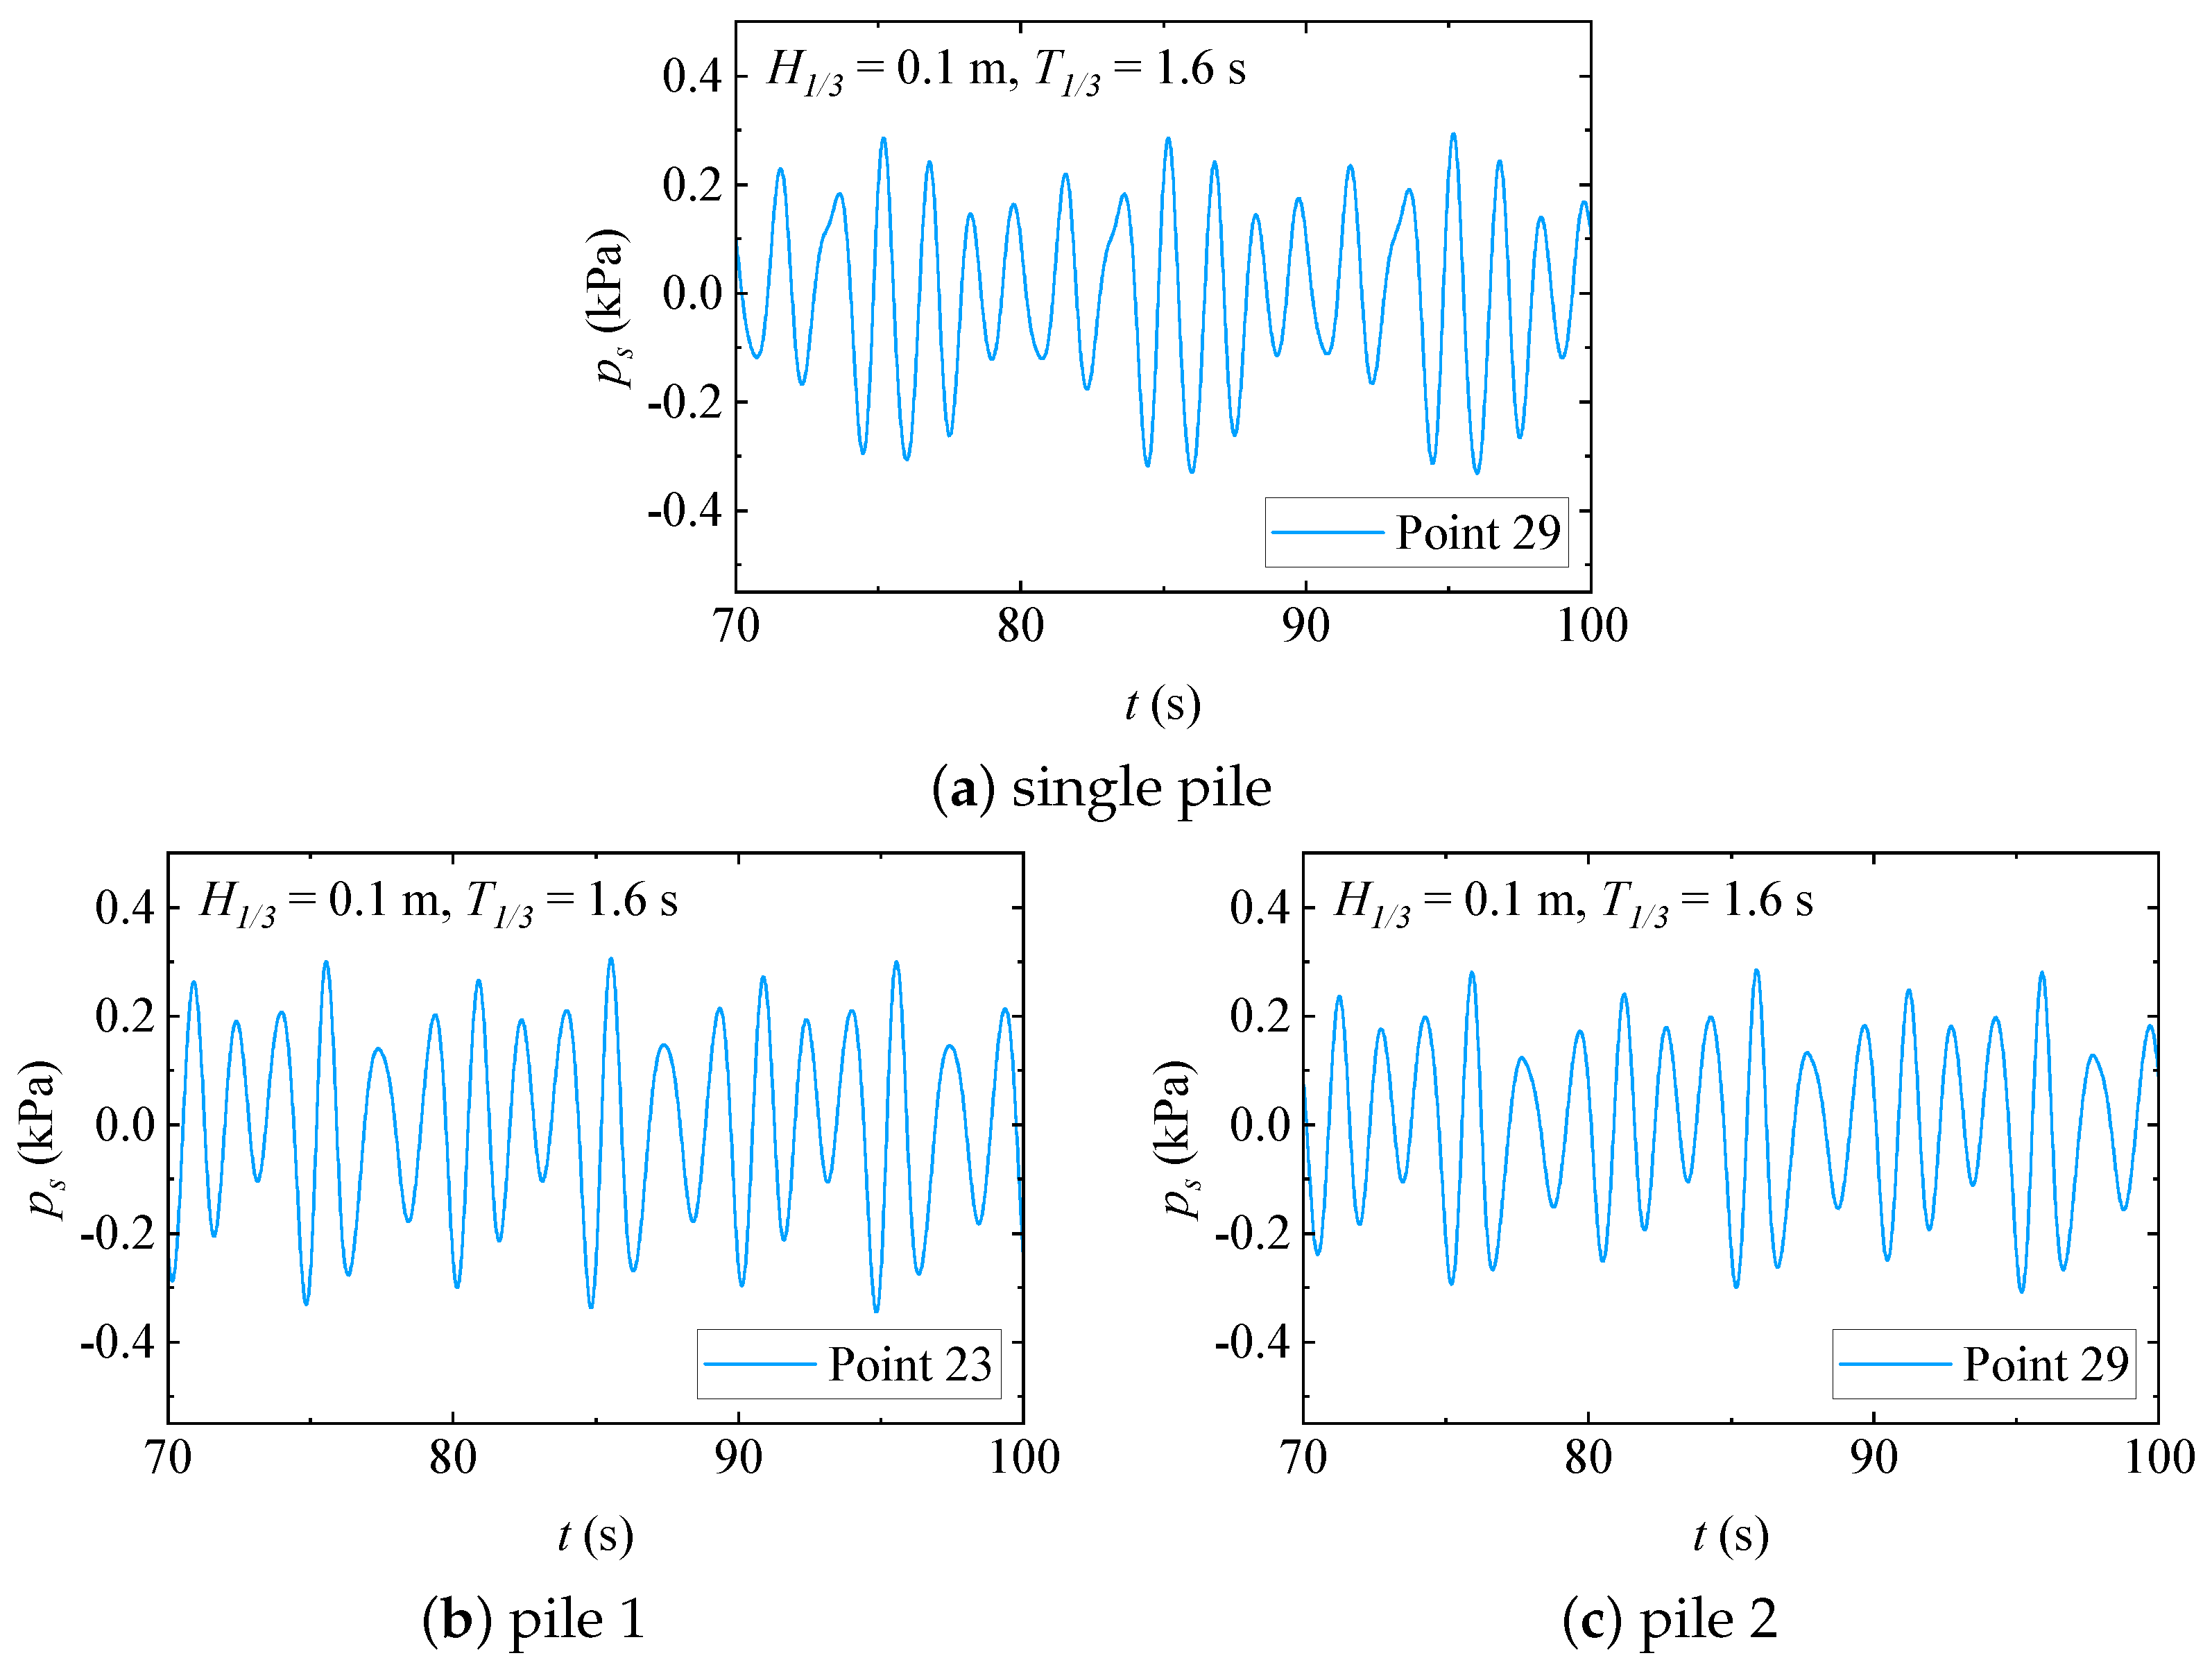
Time history of the pore pressures at a distance of 0.05 m below the seabed surface in front of the single and double piles under random wave action: (a) single pile (Case A); (b) pile 1 in double piles (Case B); (c) pile 2 in double piles (Case B). ( m, s. Pile 1: m, , point 23. Pile 2 and single pile: m, , point 29.)
Figure 8.
Time history of the pore pressures at a distance of 0.05 m below the seabed surface in front of the single and double piles under random wave action: (a) single pile (Case A); (b) pile 1 in double piles (Case B); (c) pile 2 in double piles (Case B). ( m, s. Pile 1: m, , point 23. Pile 2 and single pile: m, , point 29.)
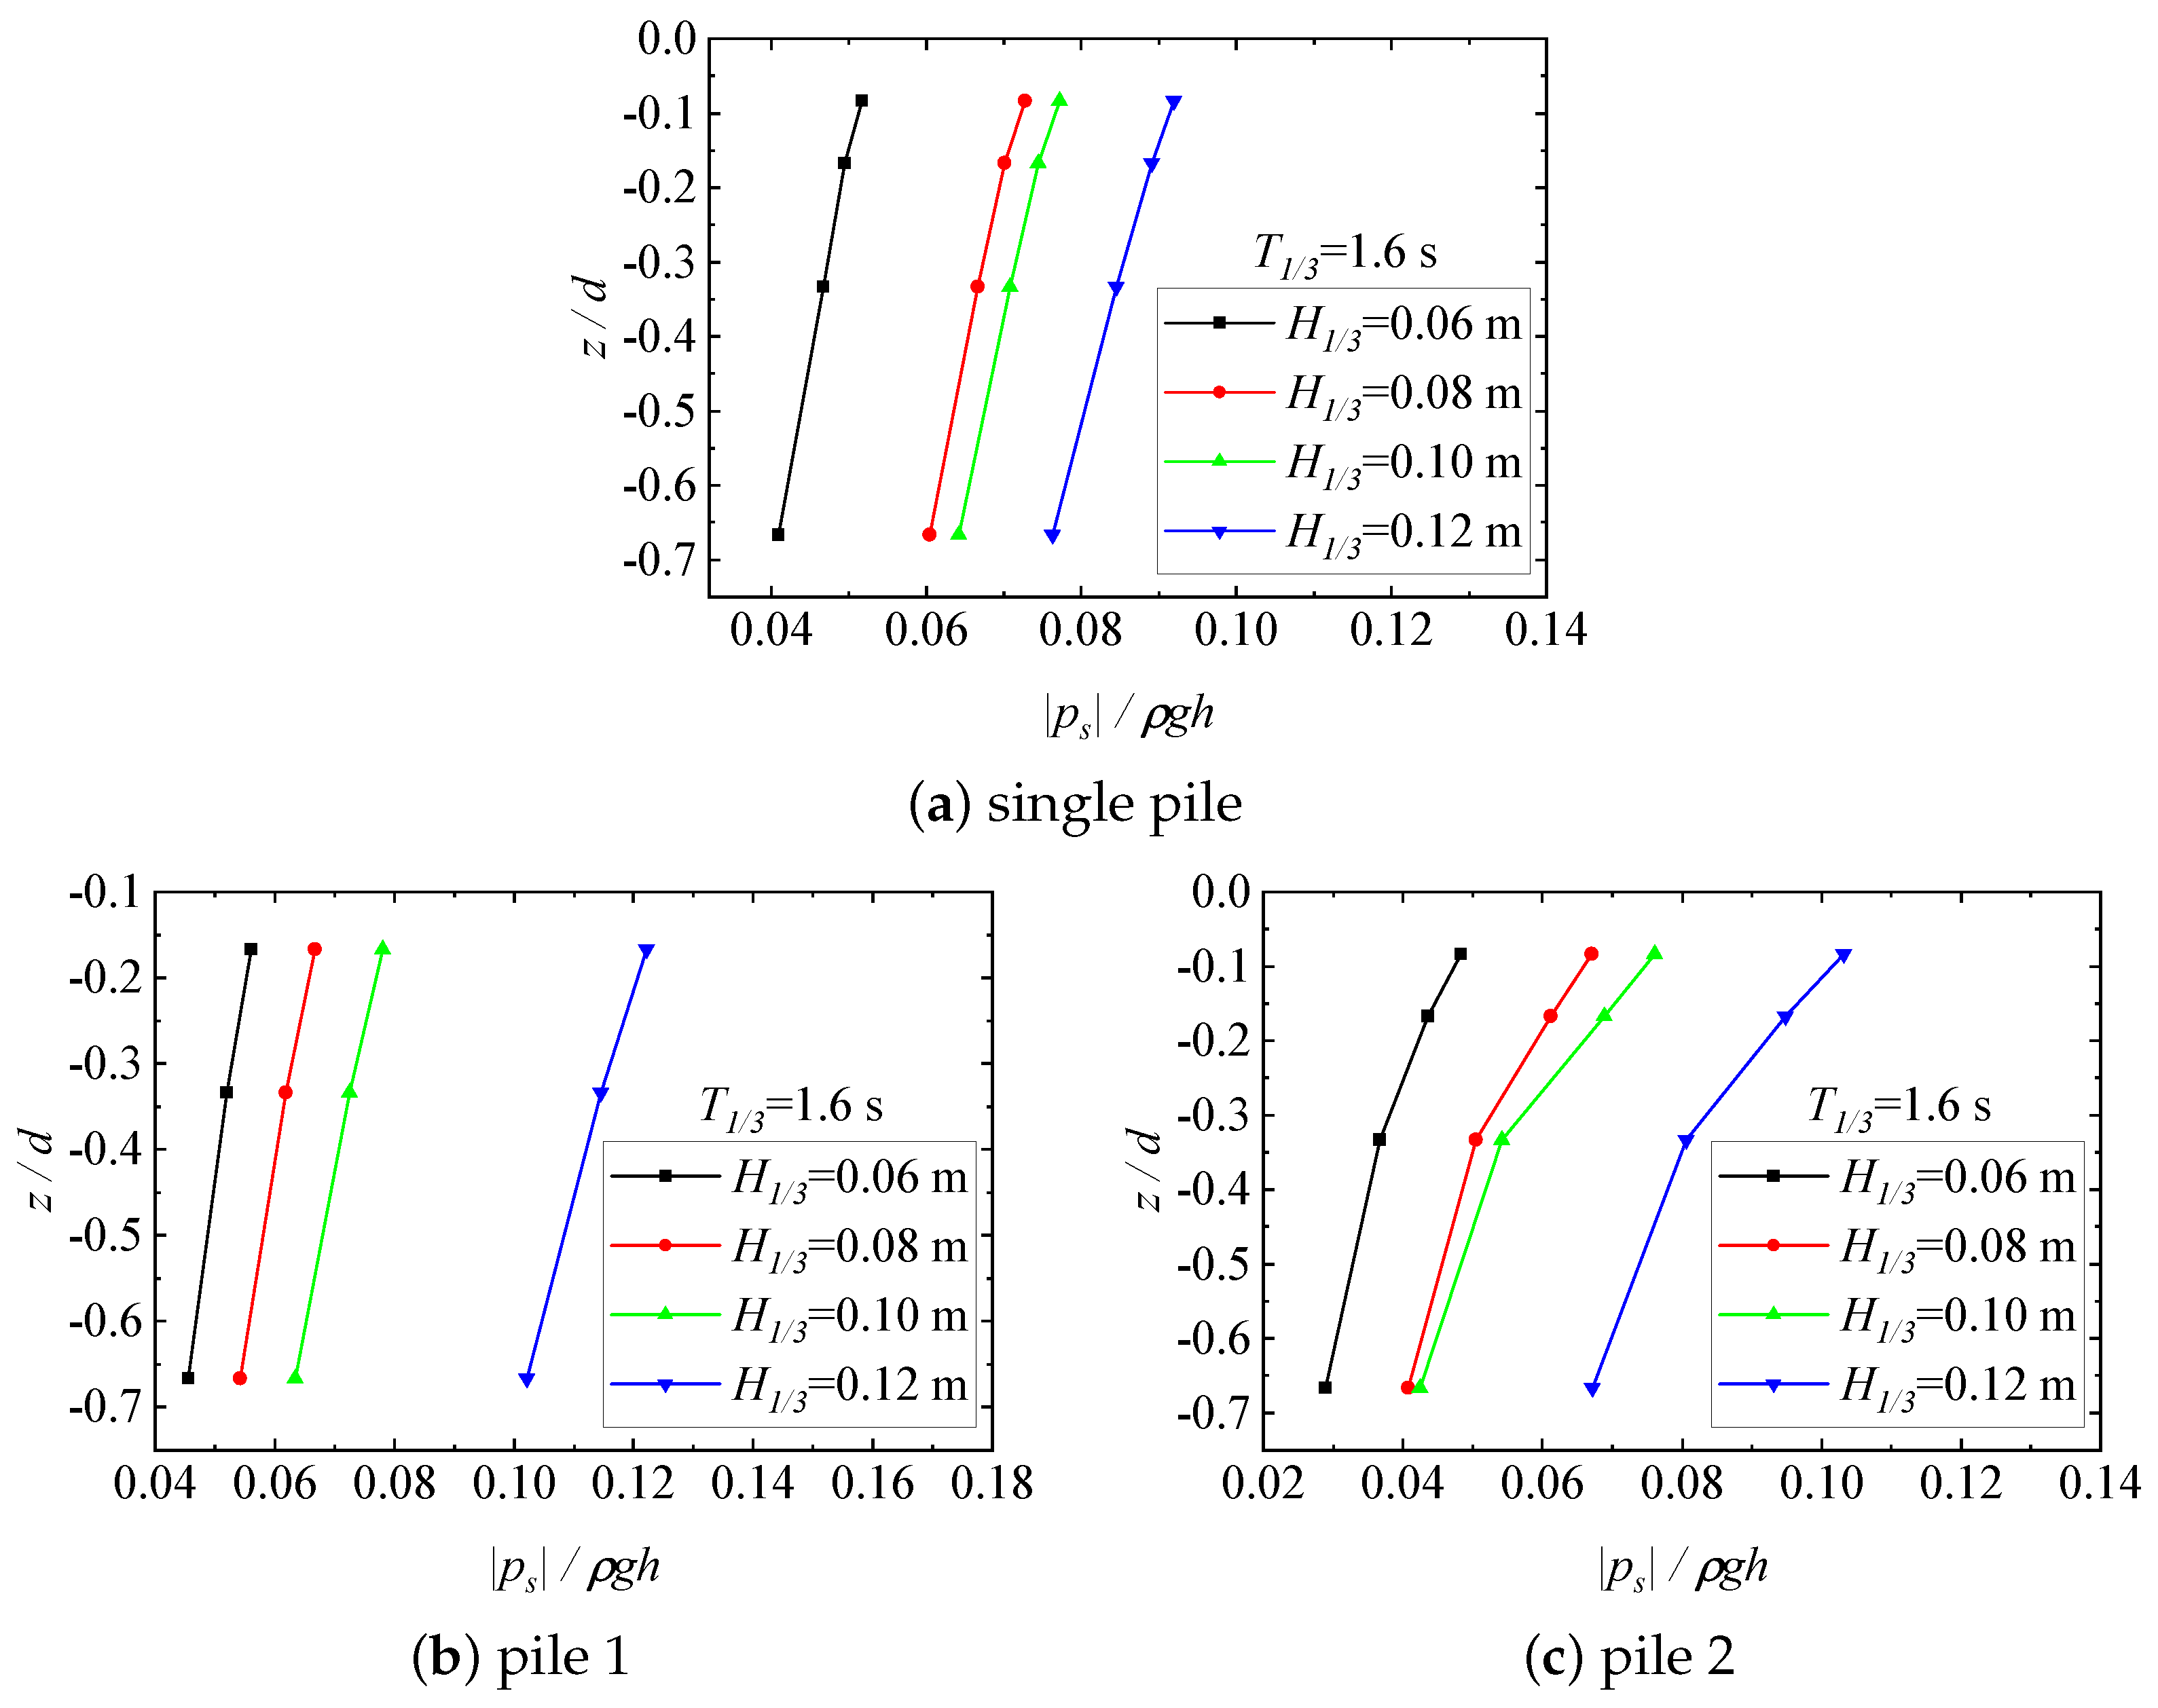
Vertical distributions of the maximum pore pressure caused by random waves on the front surface of the single and double piles as a function of the significant wave height: (a) single pile (Case A); (b) pile 1 in double piles (Case B); (c) pile 2 in double piles (Case B). ( s. Pile 1: m, points 23, 39, and 47. Pile 2 and single pile: m, points 20, 29, 43, and 50.)
Figure 9.
Vertical distributions of the maximum pore pressure caused by random waves on the front surface of the single and double piles as a function of the significant wave height: (a) single pile (Case A); (b) pile 1 in double piles (Case B); (c) pile 2 in double piles (Case B). ( s. Pile 1: m, points 23, 39, and 47. Pile 2 and single pile: m, points 20, 29, 43, and 50.)
Vertical distributions of the maximum pore pressure caused by random waves on the front surface of the single and double piles as a function of the significant wave period: (a) single pile (Case A); (b) pile 1 in double piles (Case B); (c) pile 2 in double piles (Case B). ( m. Pile 1: m, points 23, 39, and 47. Pile 2 and single pile: m, points 20, 29, 43, and 50.)
Figure 10.
Vertical distributions of the maximum pore pressure caused by random waves on the front surface of the single and double piles as a function of the significant wave period: (a) single pile (Case A); (b) pile 1 in double piles (Case B); (c) pile 2 in double piles (Case B). ( m. Pile 1: m, points 23, 39, and 47. Pile 2 and single pile: m, points 20, 29, 43, and 50.)
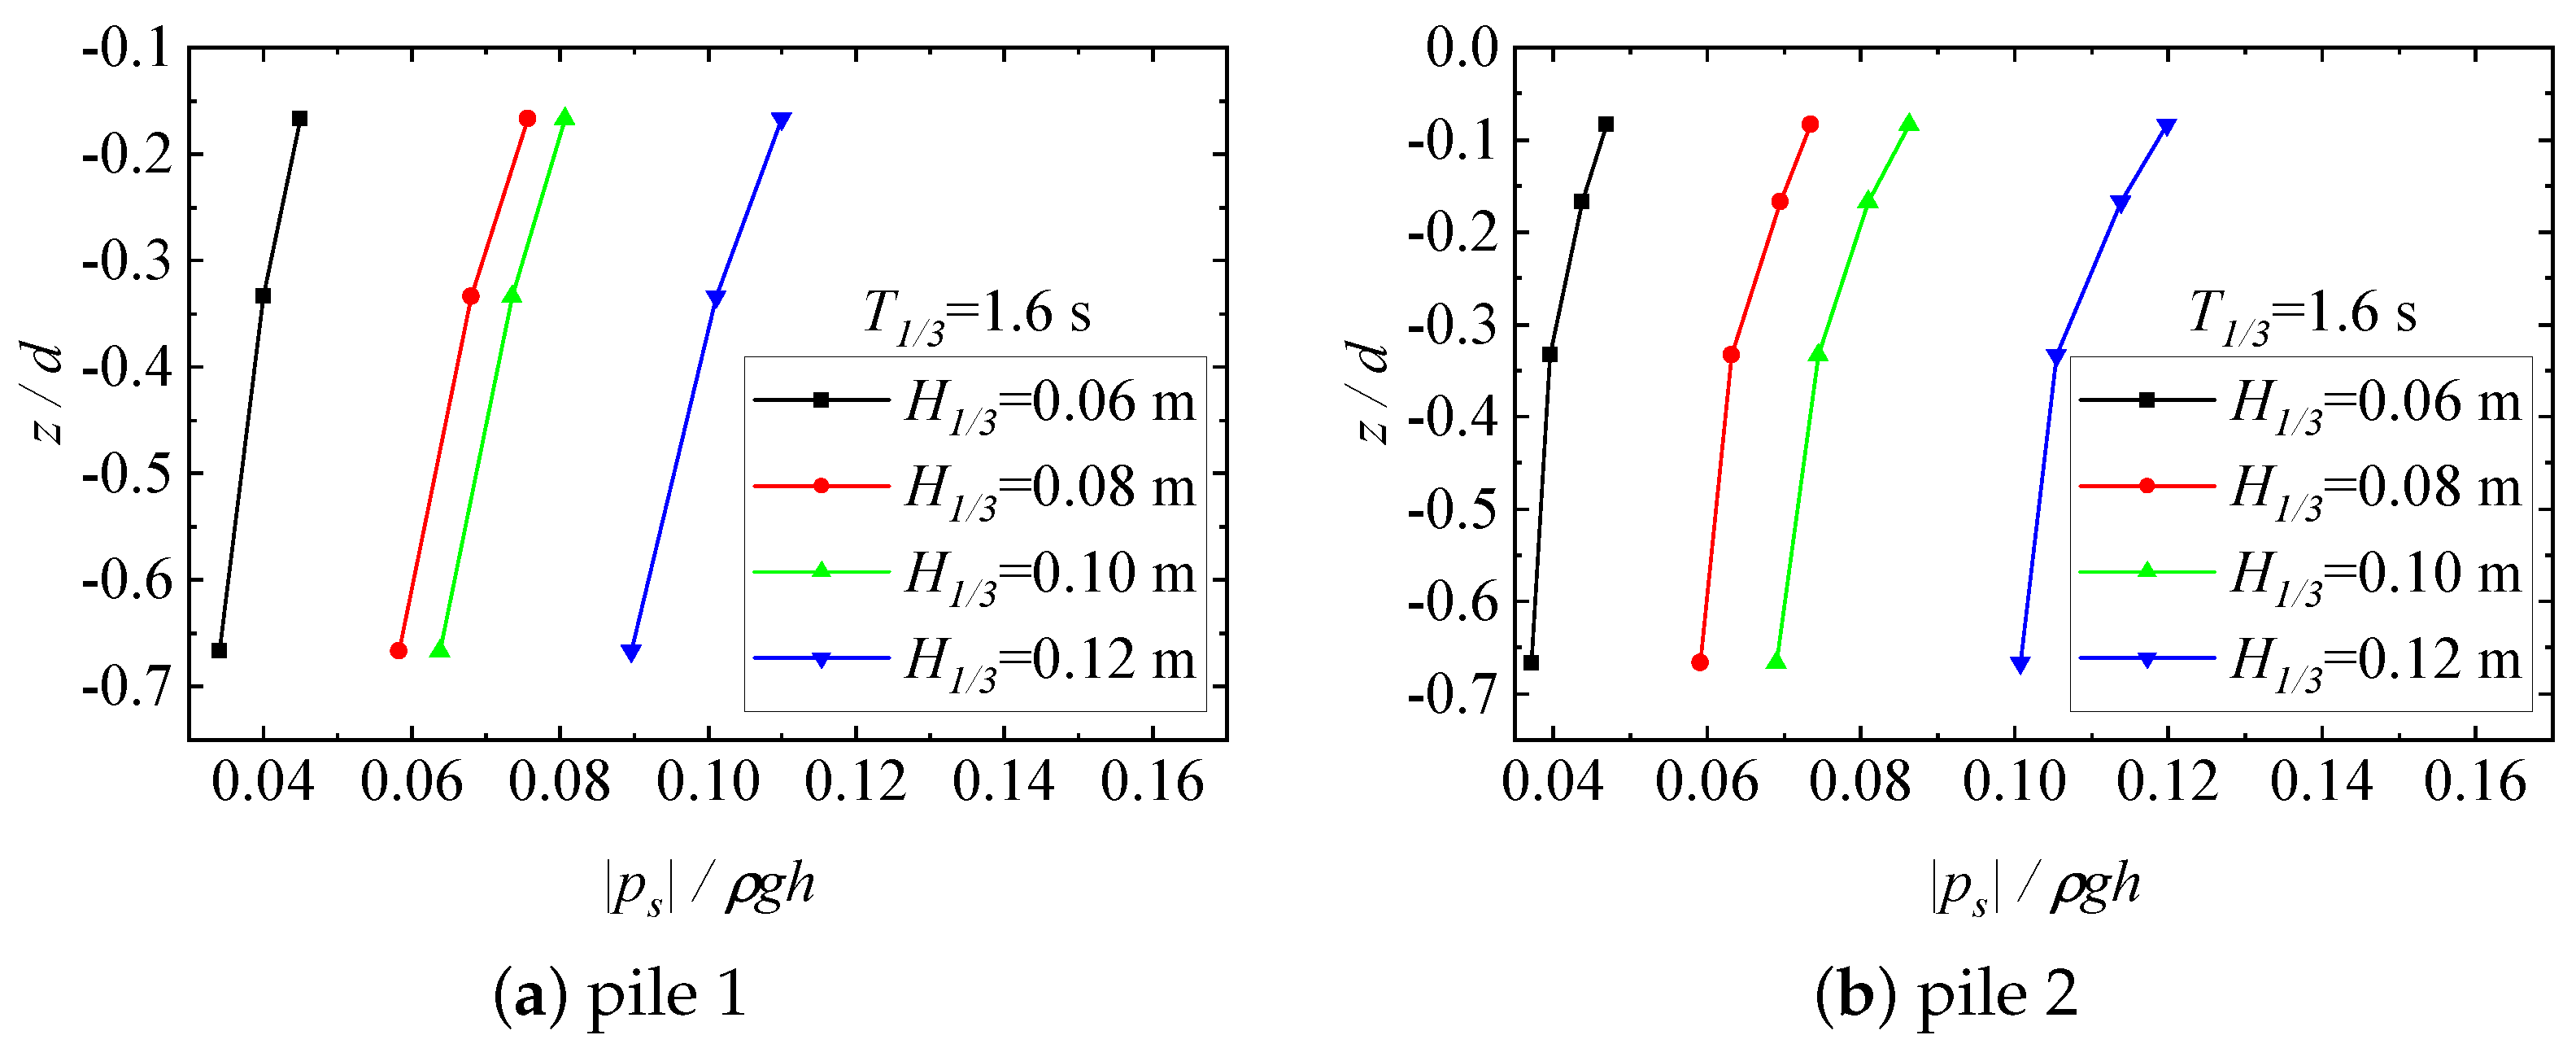
Vertical distributions of the maximum pore pressure caused by random waves on the front surface of the double piles with respect to the significant wave height when : (a) pile 1 in double piles (Case C); (b) pile 2 in double piles (Case C). ( s. Pile 1: m, points 23, 39, and 47. Pile 2: m, points 20, 29, 43, and 50.)
Figure 11.
Vertical distributions of the maximum pore pressure caused by random waves on the front surface of the double piles with respect to the significant wave height when : (a) pile 1 in double piles (Case C); (b) pile 2 in double piles (Case C). ( s. Pile 1: m, points 23, 39, and 47. Pile 2: m, points 20, 29, 43, and 50.)
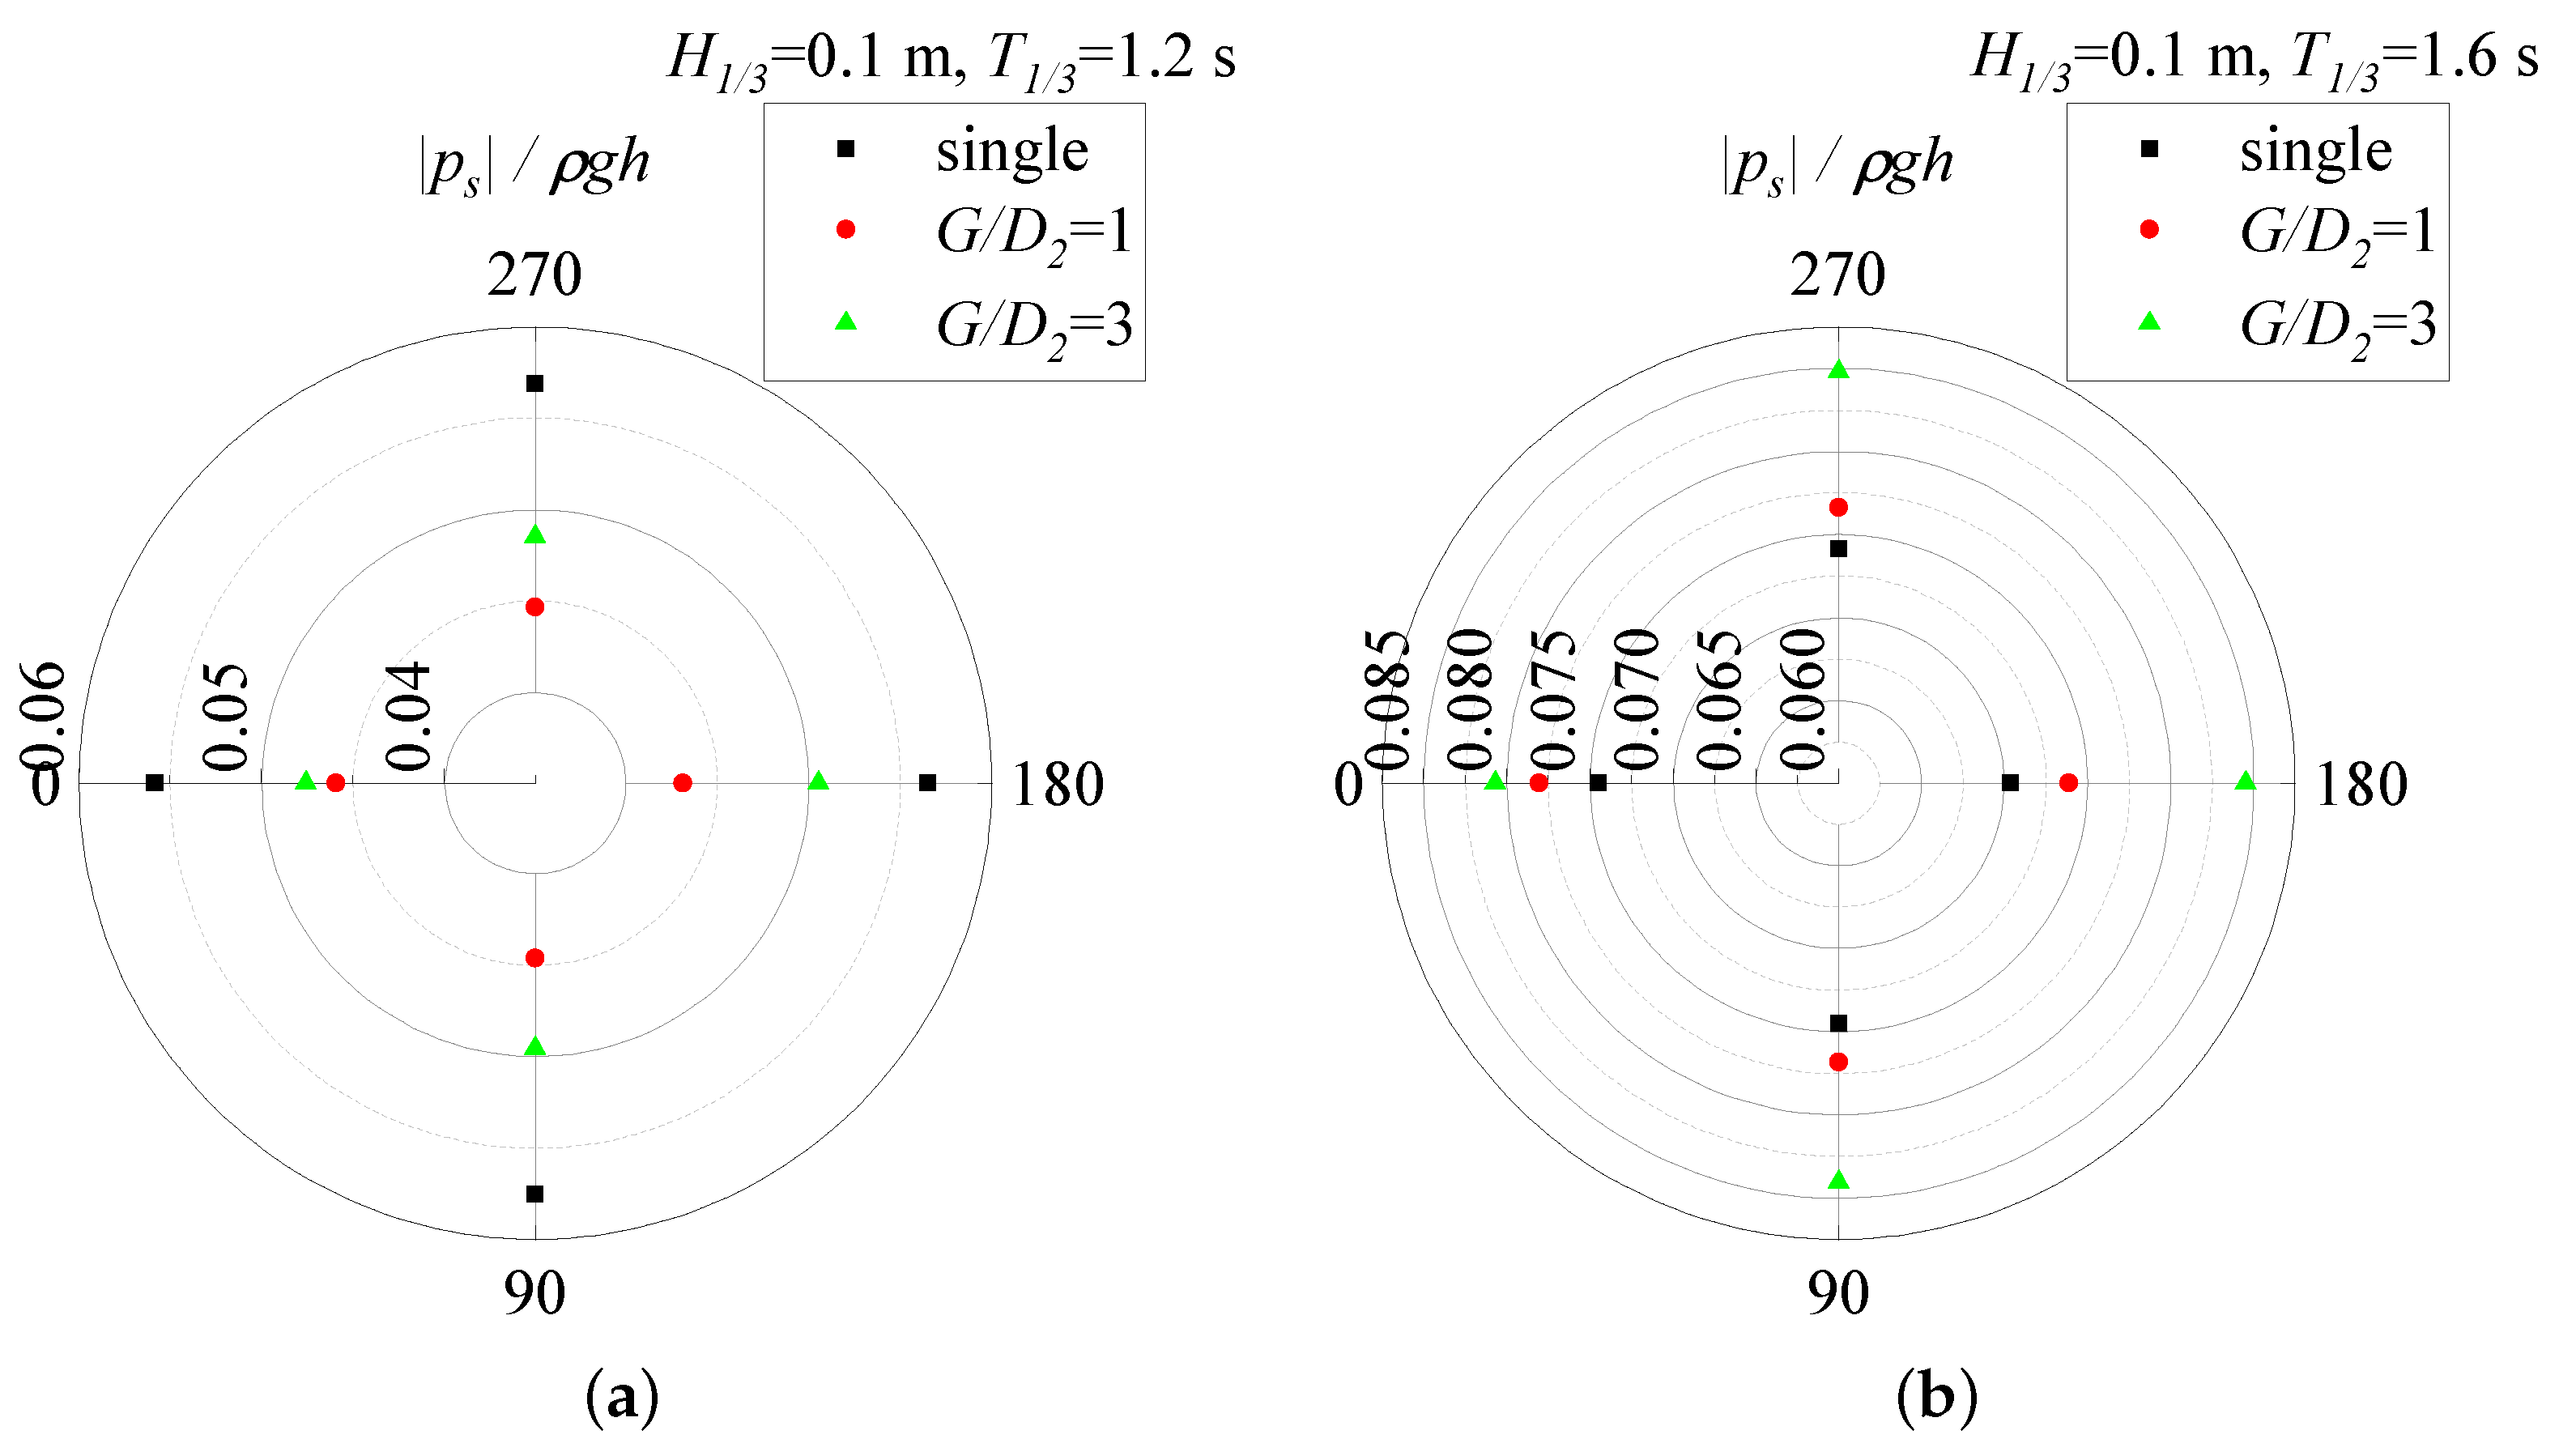
Spatial distributions of the maximum pore pressure around pile 1 at a distance of 0.05 m below the seabed surface under two significant wave periods of (Case B) and (Case C). These are compared with a single pile (Case A): (a) s; (b) s. ( m, . Pile 1: m, points 23, 25, 27, and 28. Single pile: m, points 29, 31, 33, and 34.
Figure 12.
Spatial distributions of the maximum pore pressure around pile 1 at a distance of 0.05 m below the seabed surface under two significant wave periods of (Case B) and (Case C). These are compared with a single pile (Case A): (a) s; (b) s. ( m, . Pile 1: m, points 23, 25, 27, and 28. Single pile: m, points 29, 31, 33, and 34.
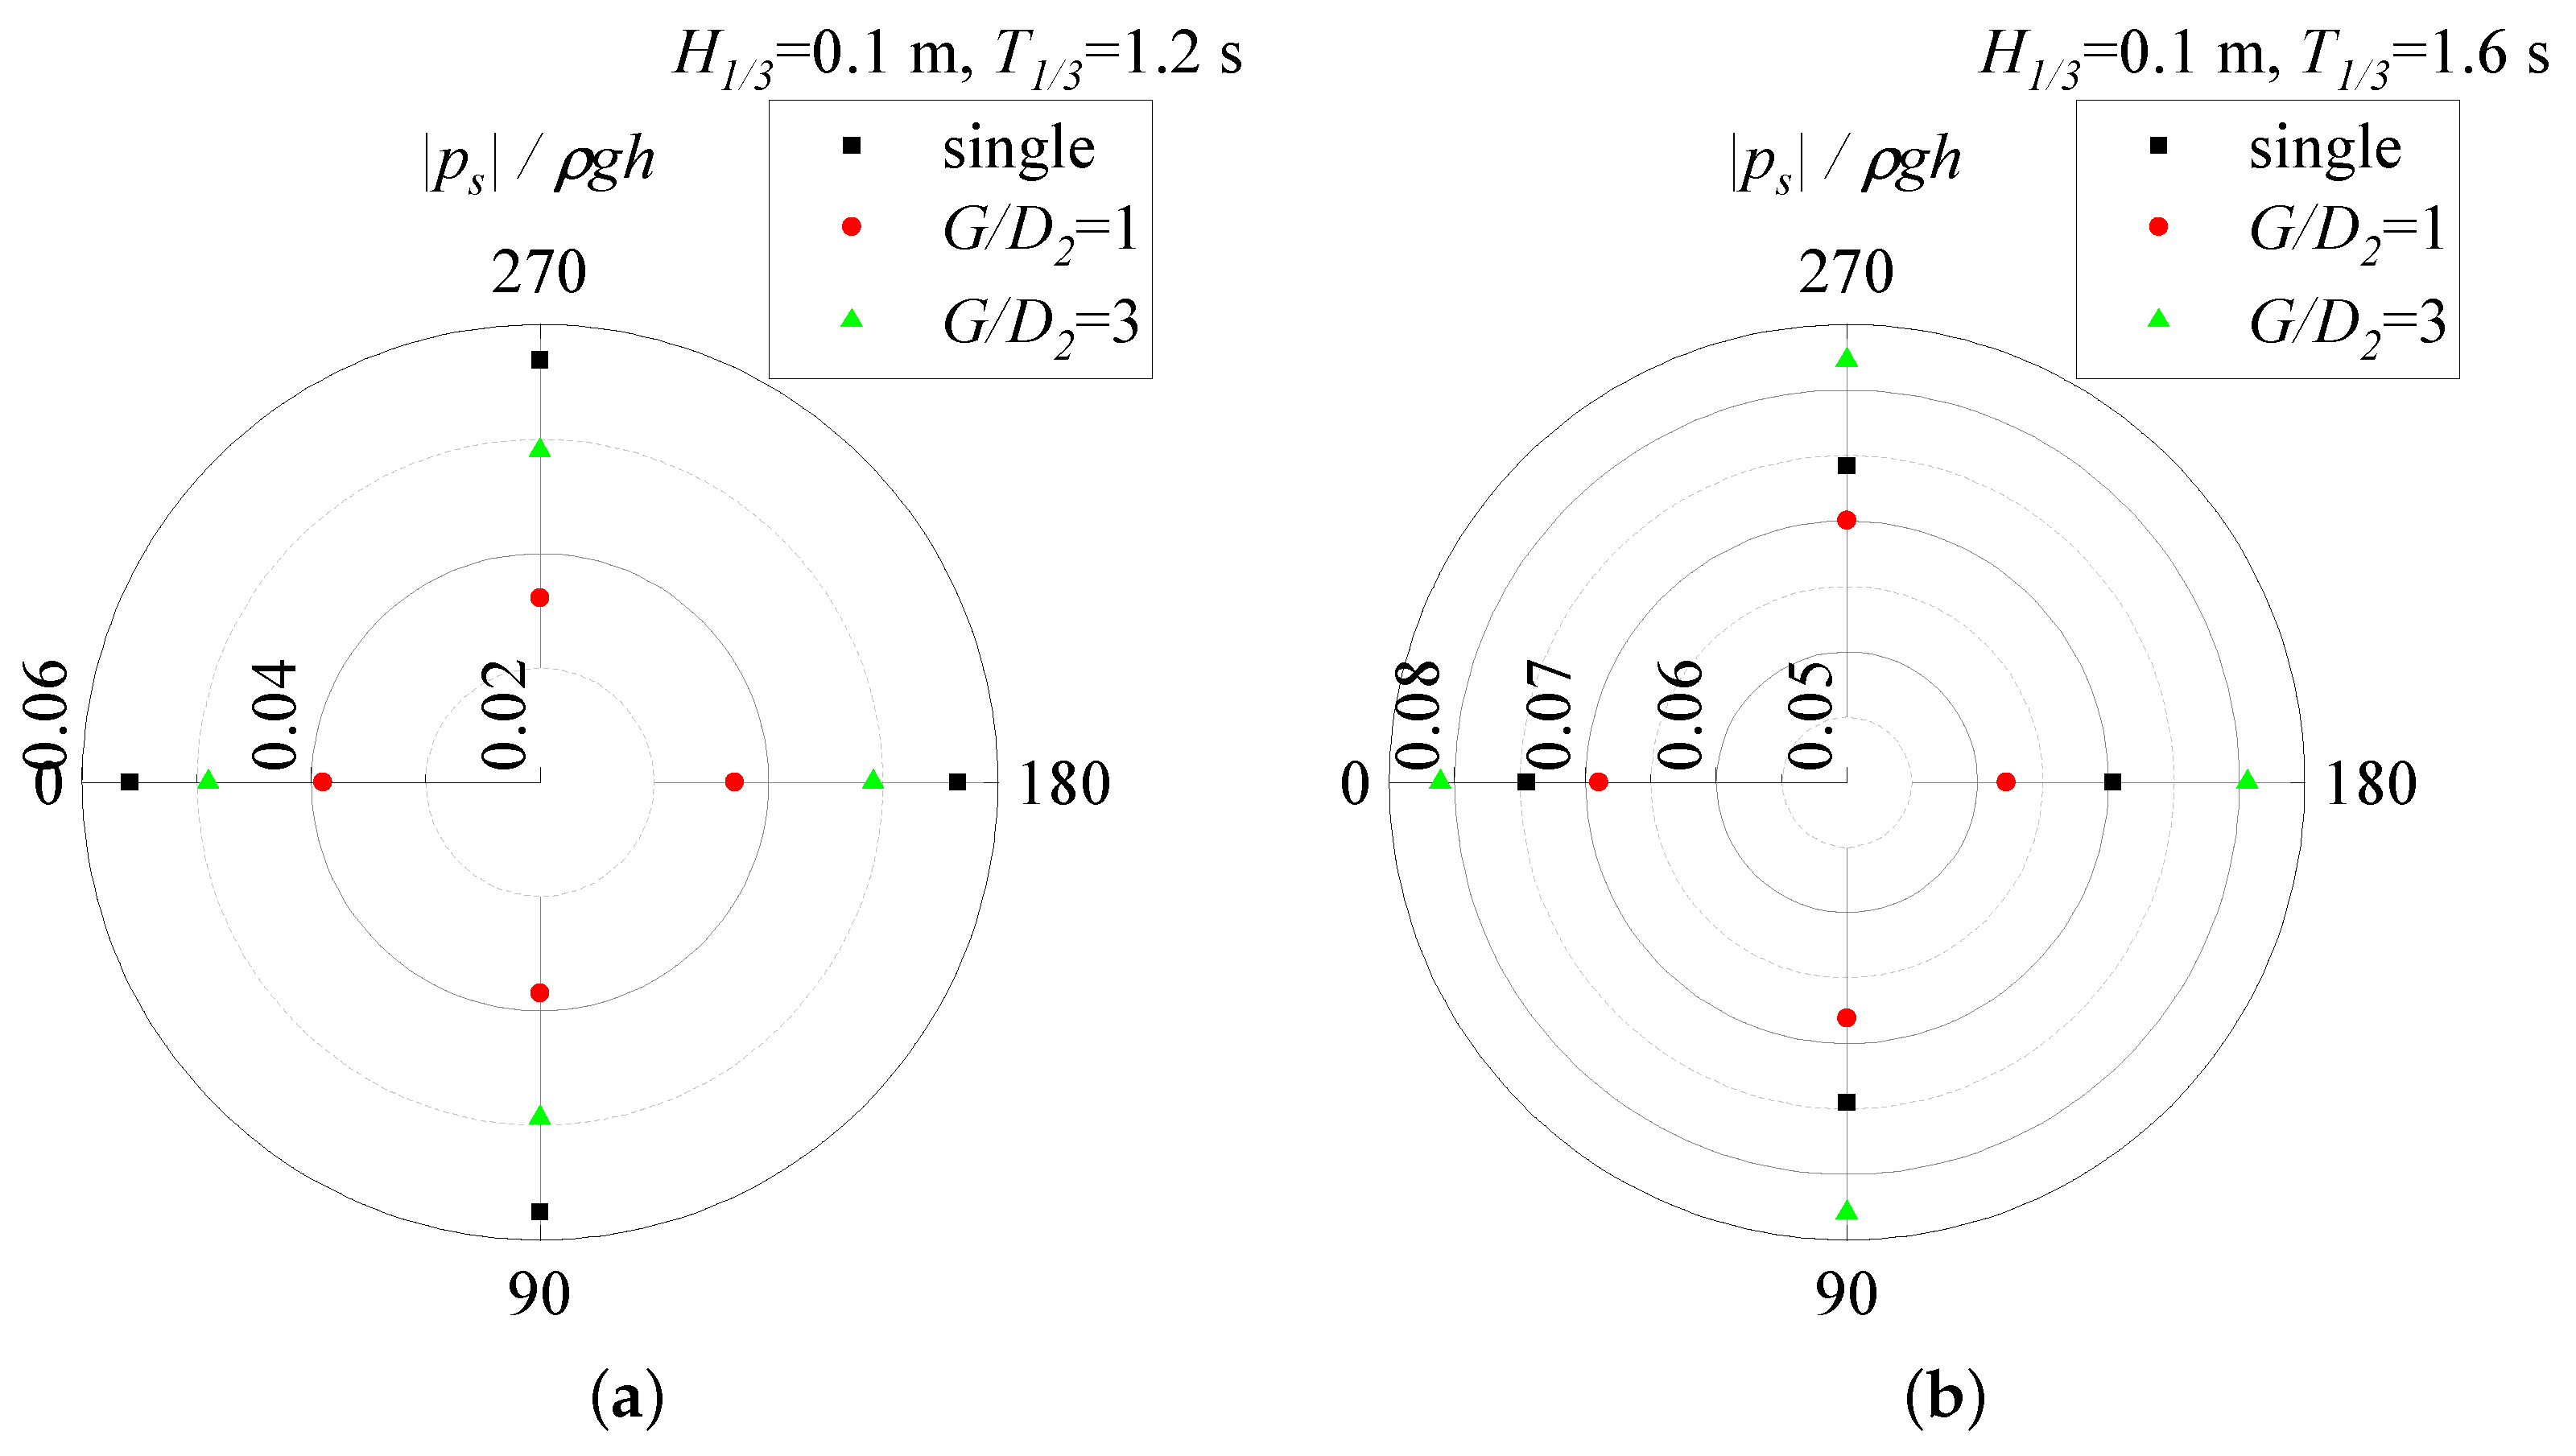
Spatial distributions of the maximum pore pressure around pile 2 at a distance of 0.05 m below the seabed surface under two significant wave periods of (Case B) and (Case C). These are compared with a single pile (Case A): (a) s; (b) s. ( m, . Pile 2 and single pile: m, points 29, 31, 33, and 34.
Figure 13.
Spatial distributions of the maximum pore pressure around pile 2 at a distance of 0.05 m below the seabed surface under two significant wave periods of (Case B) and (Case C). These are compared with a single pile (Case A): (a) s; (b) s. ( m, . Pile 2 and single pile: m, points 29, 31, 33, and 34.
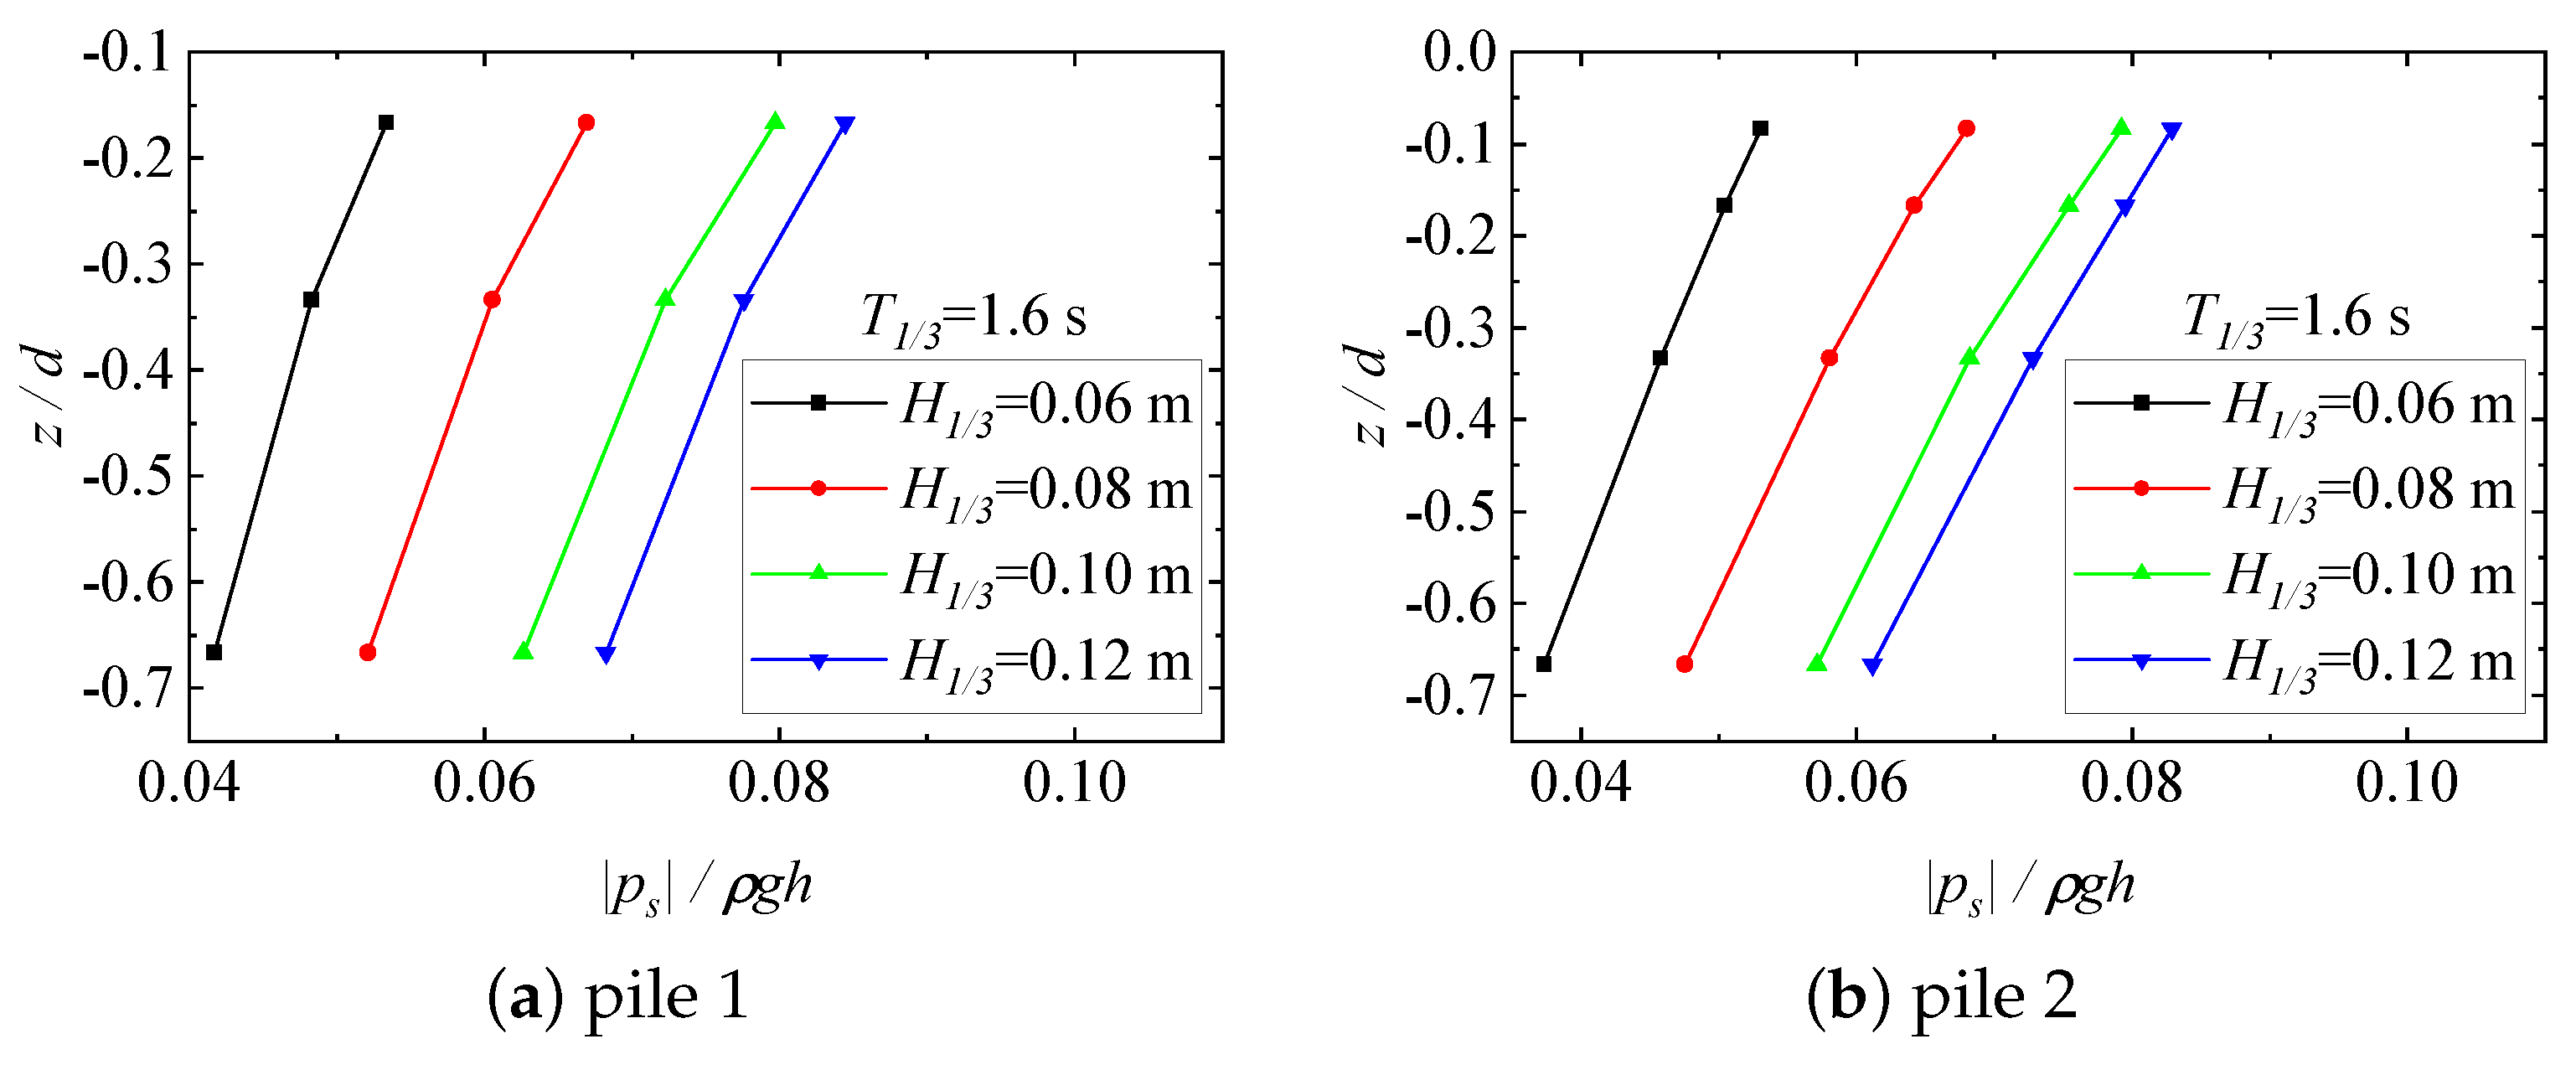
Vertical distributions of the maximum pore pressure caused by random waves on the front surface of the double piles at an incident angle of as a function of the significant wave height: (a) pile 1 in double piles (Case F); (b) pile 2 in double piles (Case F). ( s. Pile 1: m, points 23, 39, and 47. Pile 2: m, points 20, 29, 43, and 50.)
Figure 14.
Vertical distributions of the maximum pore pressure caused by random waves on the front surface of the double piles at an incident angle of as a function of the significant wave height: (a) pile 1 in double piles (Case F); (b) pile 2 in double piles (Case F). ( s. Pile 1: m, points 23, 39, and 47. Pile 2: m, points 20, 29, 43, and 50.)
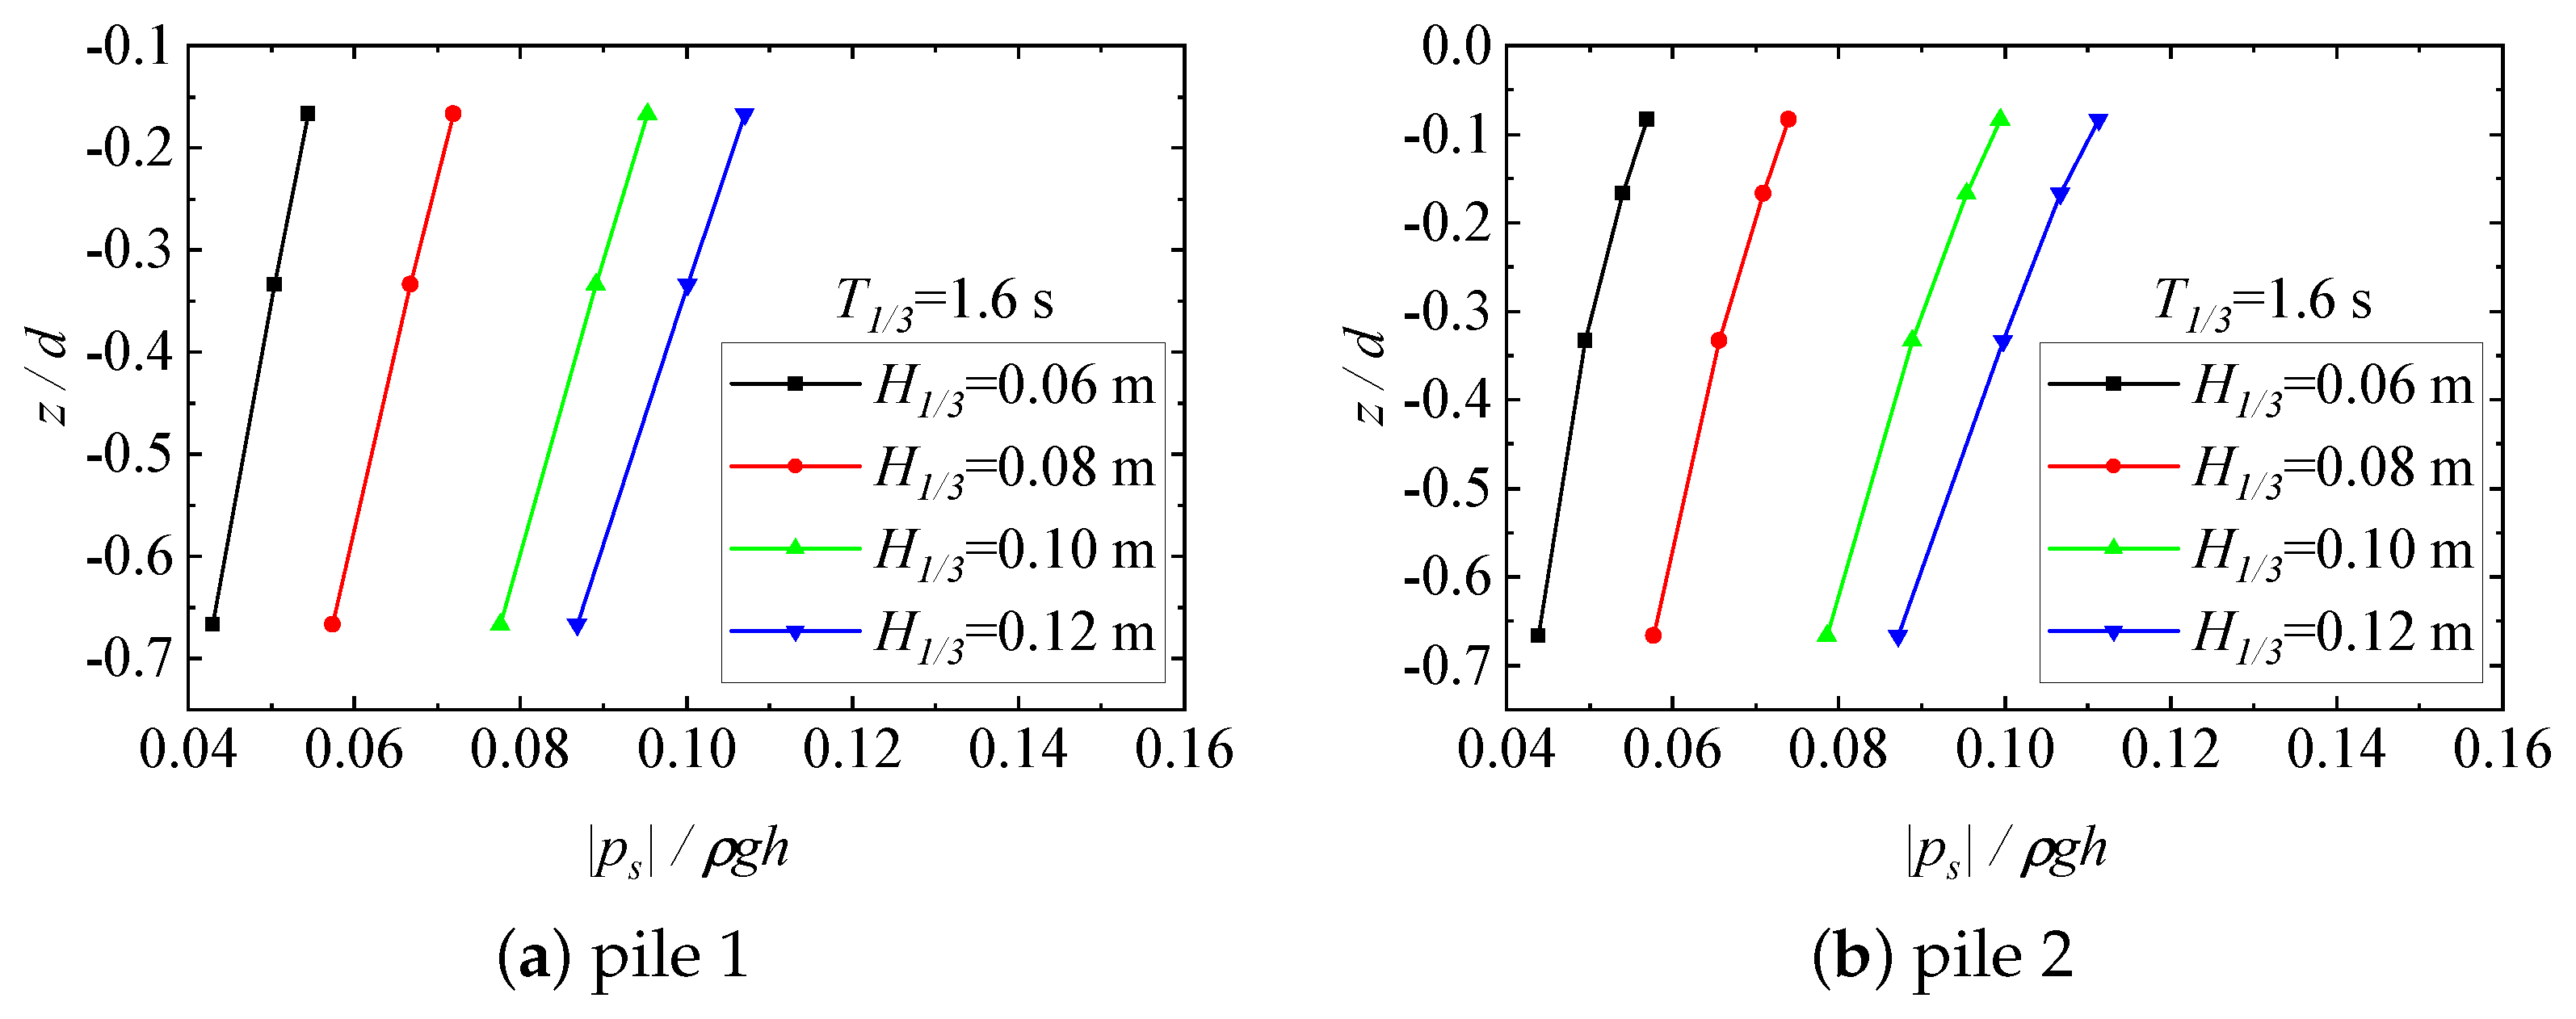
Vertical distributions of the maximum pore pressure caused by random waves on the front surface of the double piles at an incident angle of as a function of the significant wave height: (a) pile 1 in double piles (Case G); (b) pile 2 in double piles (Case G). ( s. Pile 1: m, points 23, 39, and 47. Pile 2: m, points 20, 29, 43, and 50.)
Figure 15.
Vertical distributions of the maximum pore pressure caused by random waves on the front surface of the double piles at an incident angle of as a function of the significant wave height: (a) pile 1 in double piles (Case G); (b) pile 2 in double piles (Case G). ( s. Pile 1: m, points 23, 39, and 47. Pile 2: m, points 20, 29, 43, and 50.)
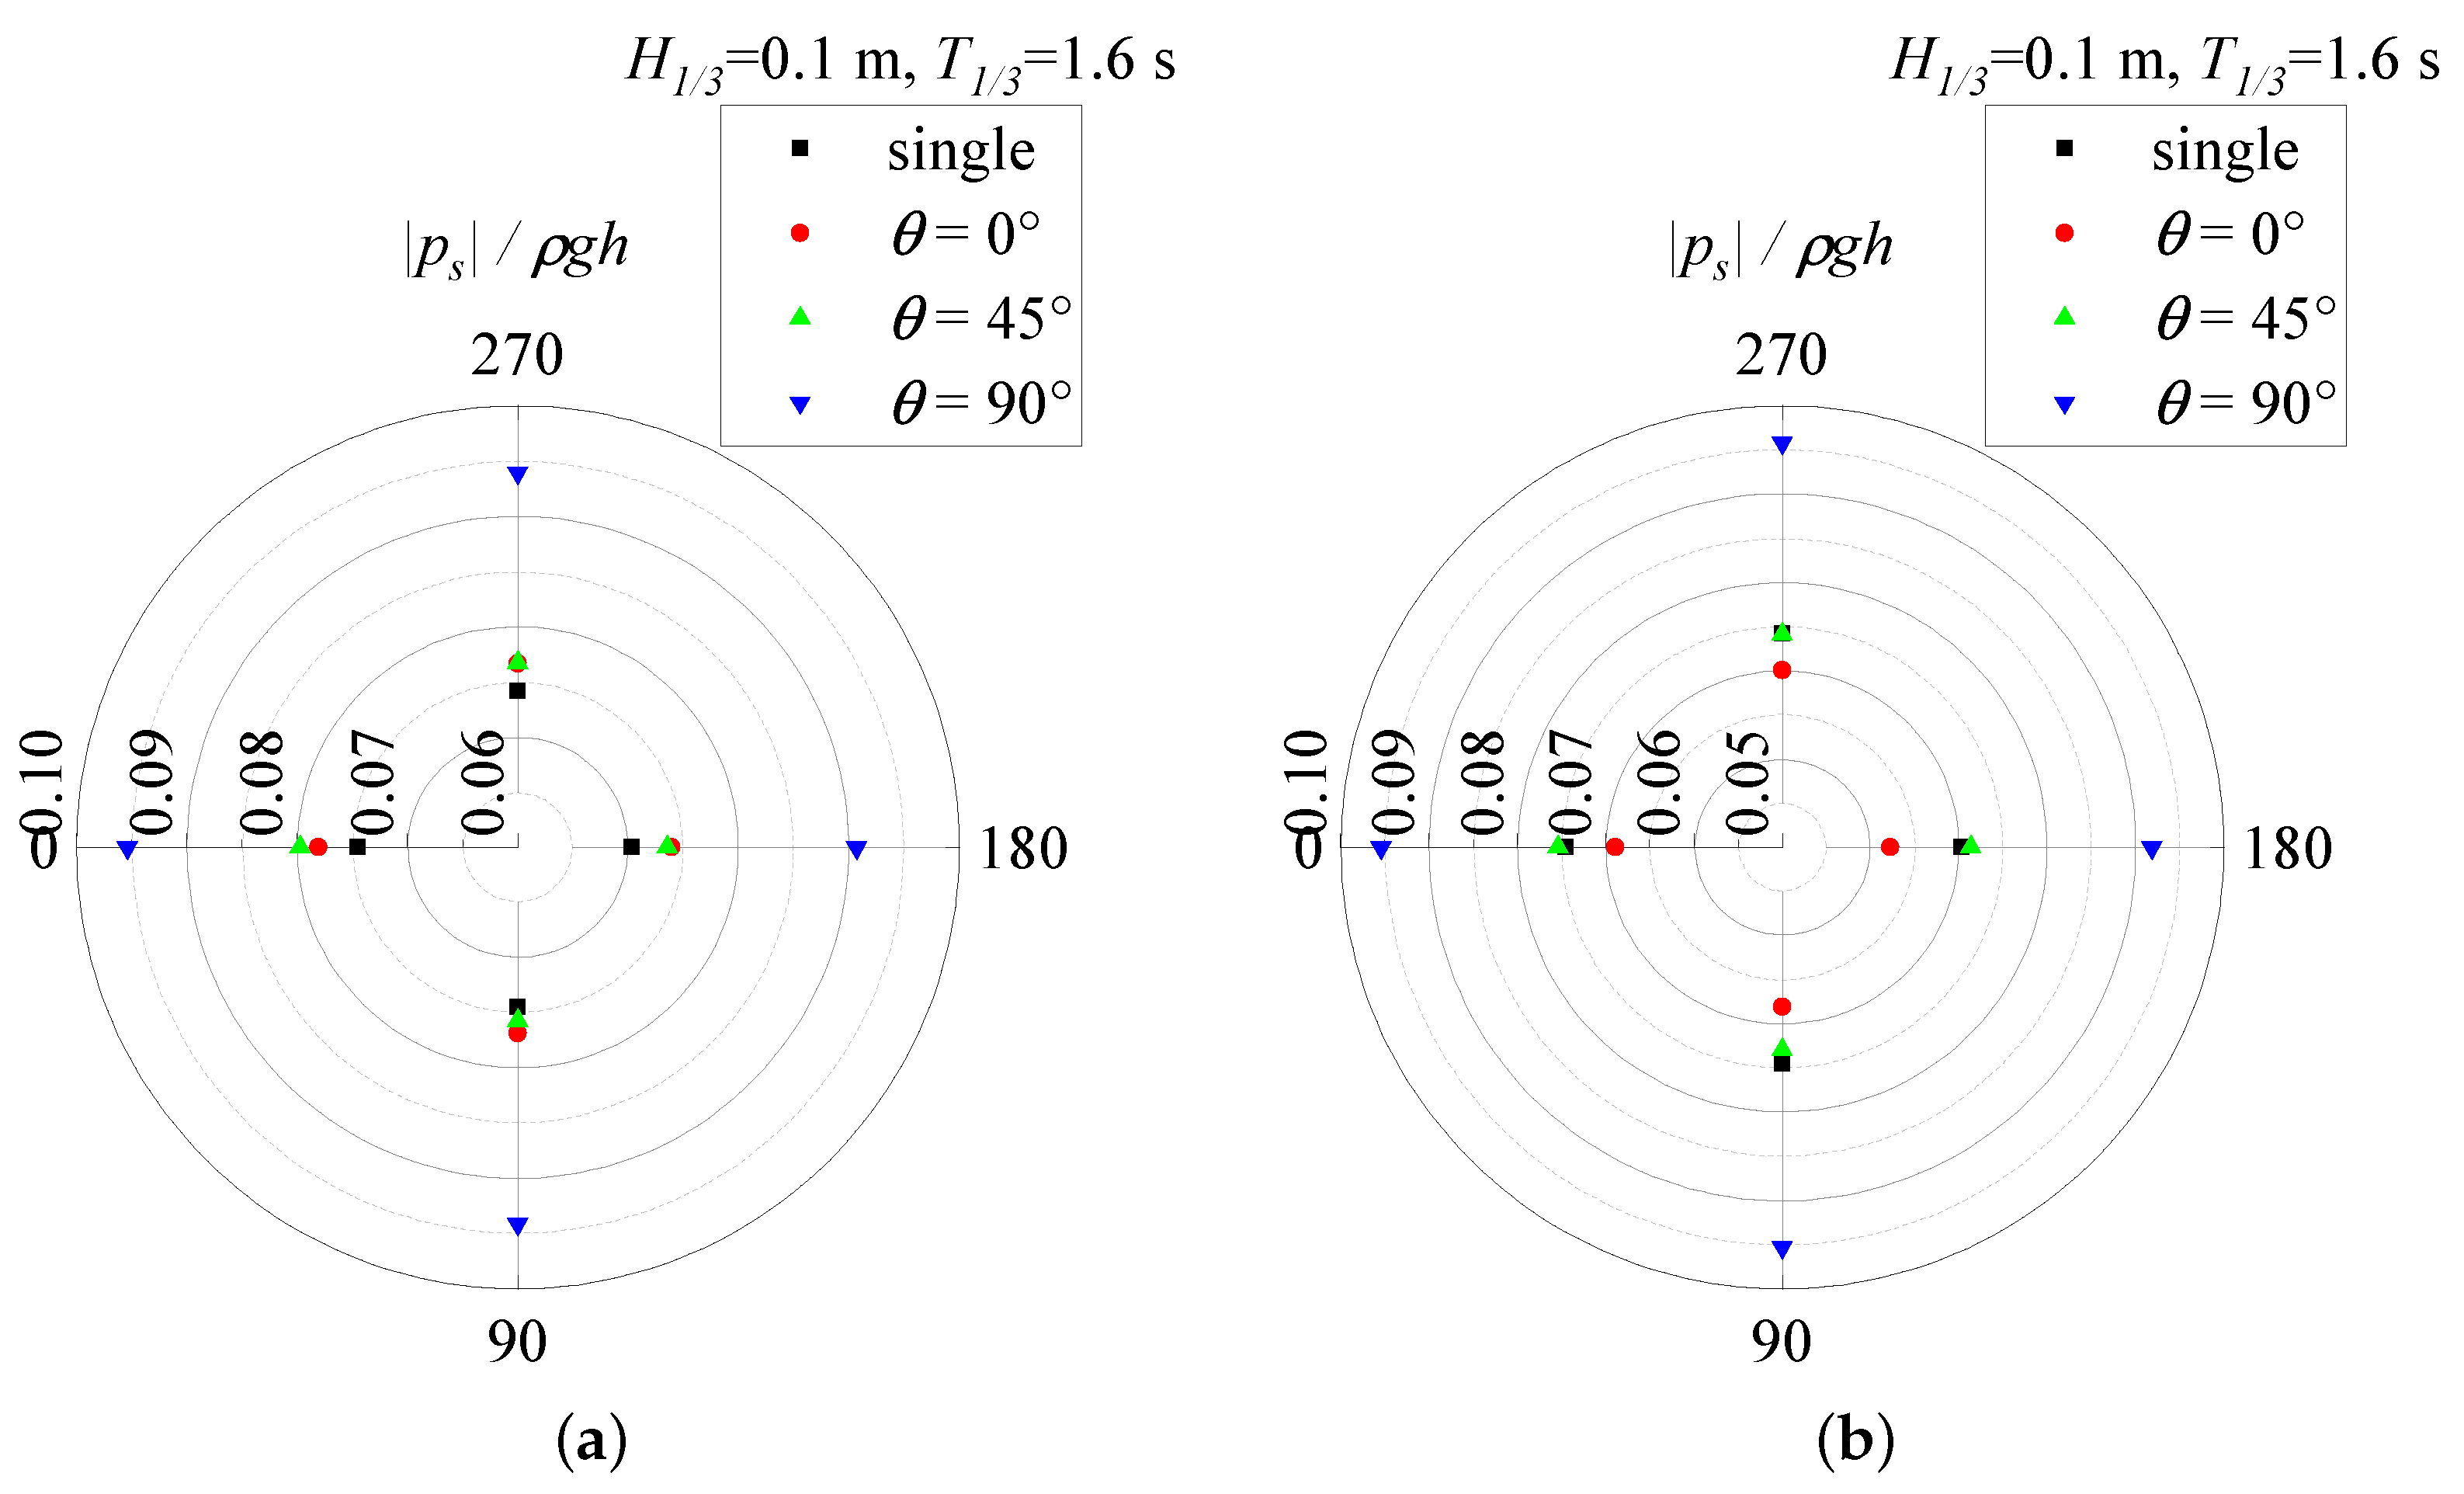
Spatial distributions of the maximum pore pressure around double piles at a distance of 0.05 m below the seabed surface under three wave incidence angles of (Case B), (Case F), and (Case G). These are compared with a single pile (Case A): (a) pile 1; (b) pile 2. ( m, s, . Pile 1: m, points 23, 25, 27, and 28. Pile 2 and single pile: m, points 29, 31, 33, and 34.)
Figure 16.
Spatial distributions of the maximum pore pressure around double piles at a distance of 0.05 m below the seabed surface under three wave incidence angles of (Case B), (Case F), and (Case G). These are compared with a single pile (Case A): (a) pile 1; (b) pile 2. ( m, s, . Pile 1: m, points 23, 25, 27, and 28. Pile 2 and single pile: m, points 29, 31, 33, and 34.)
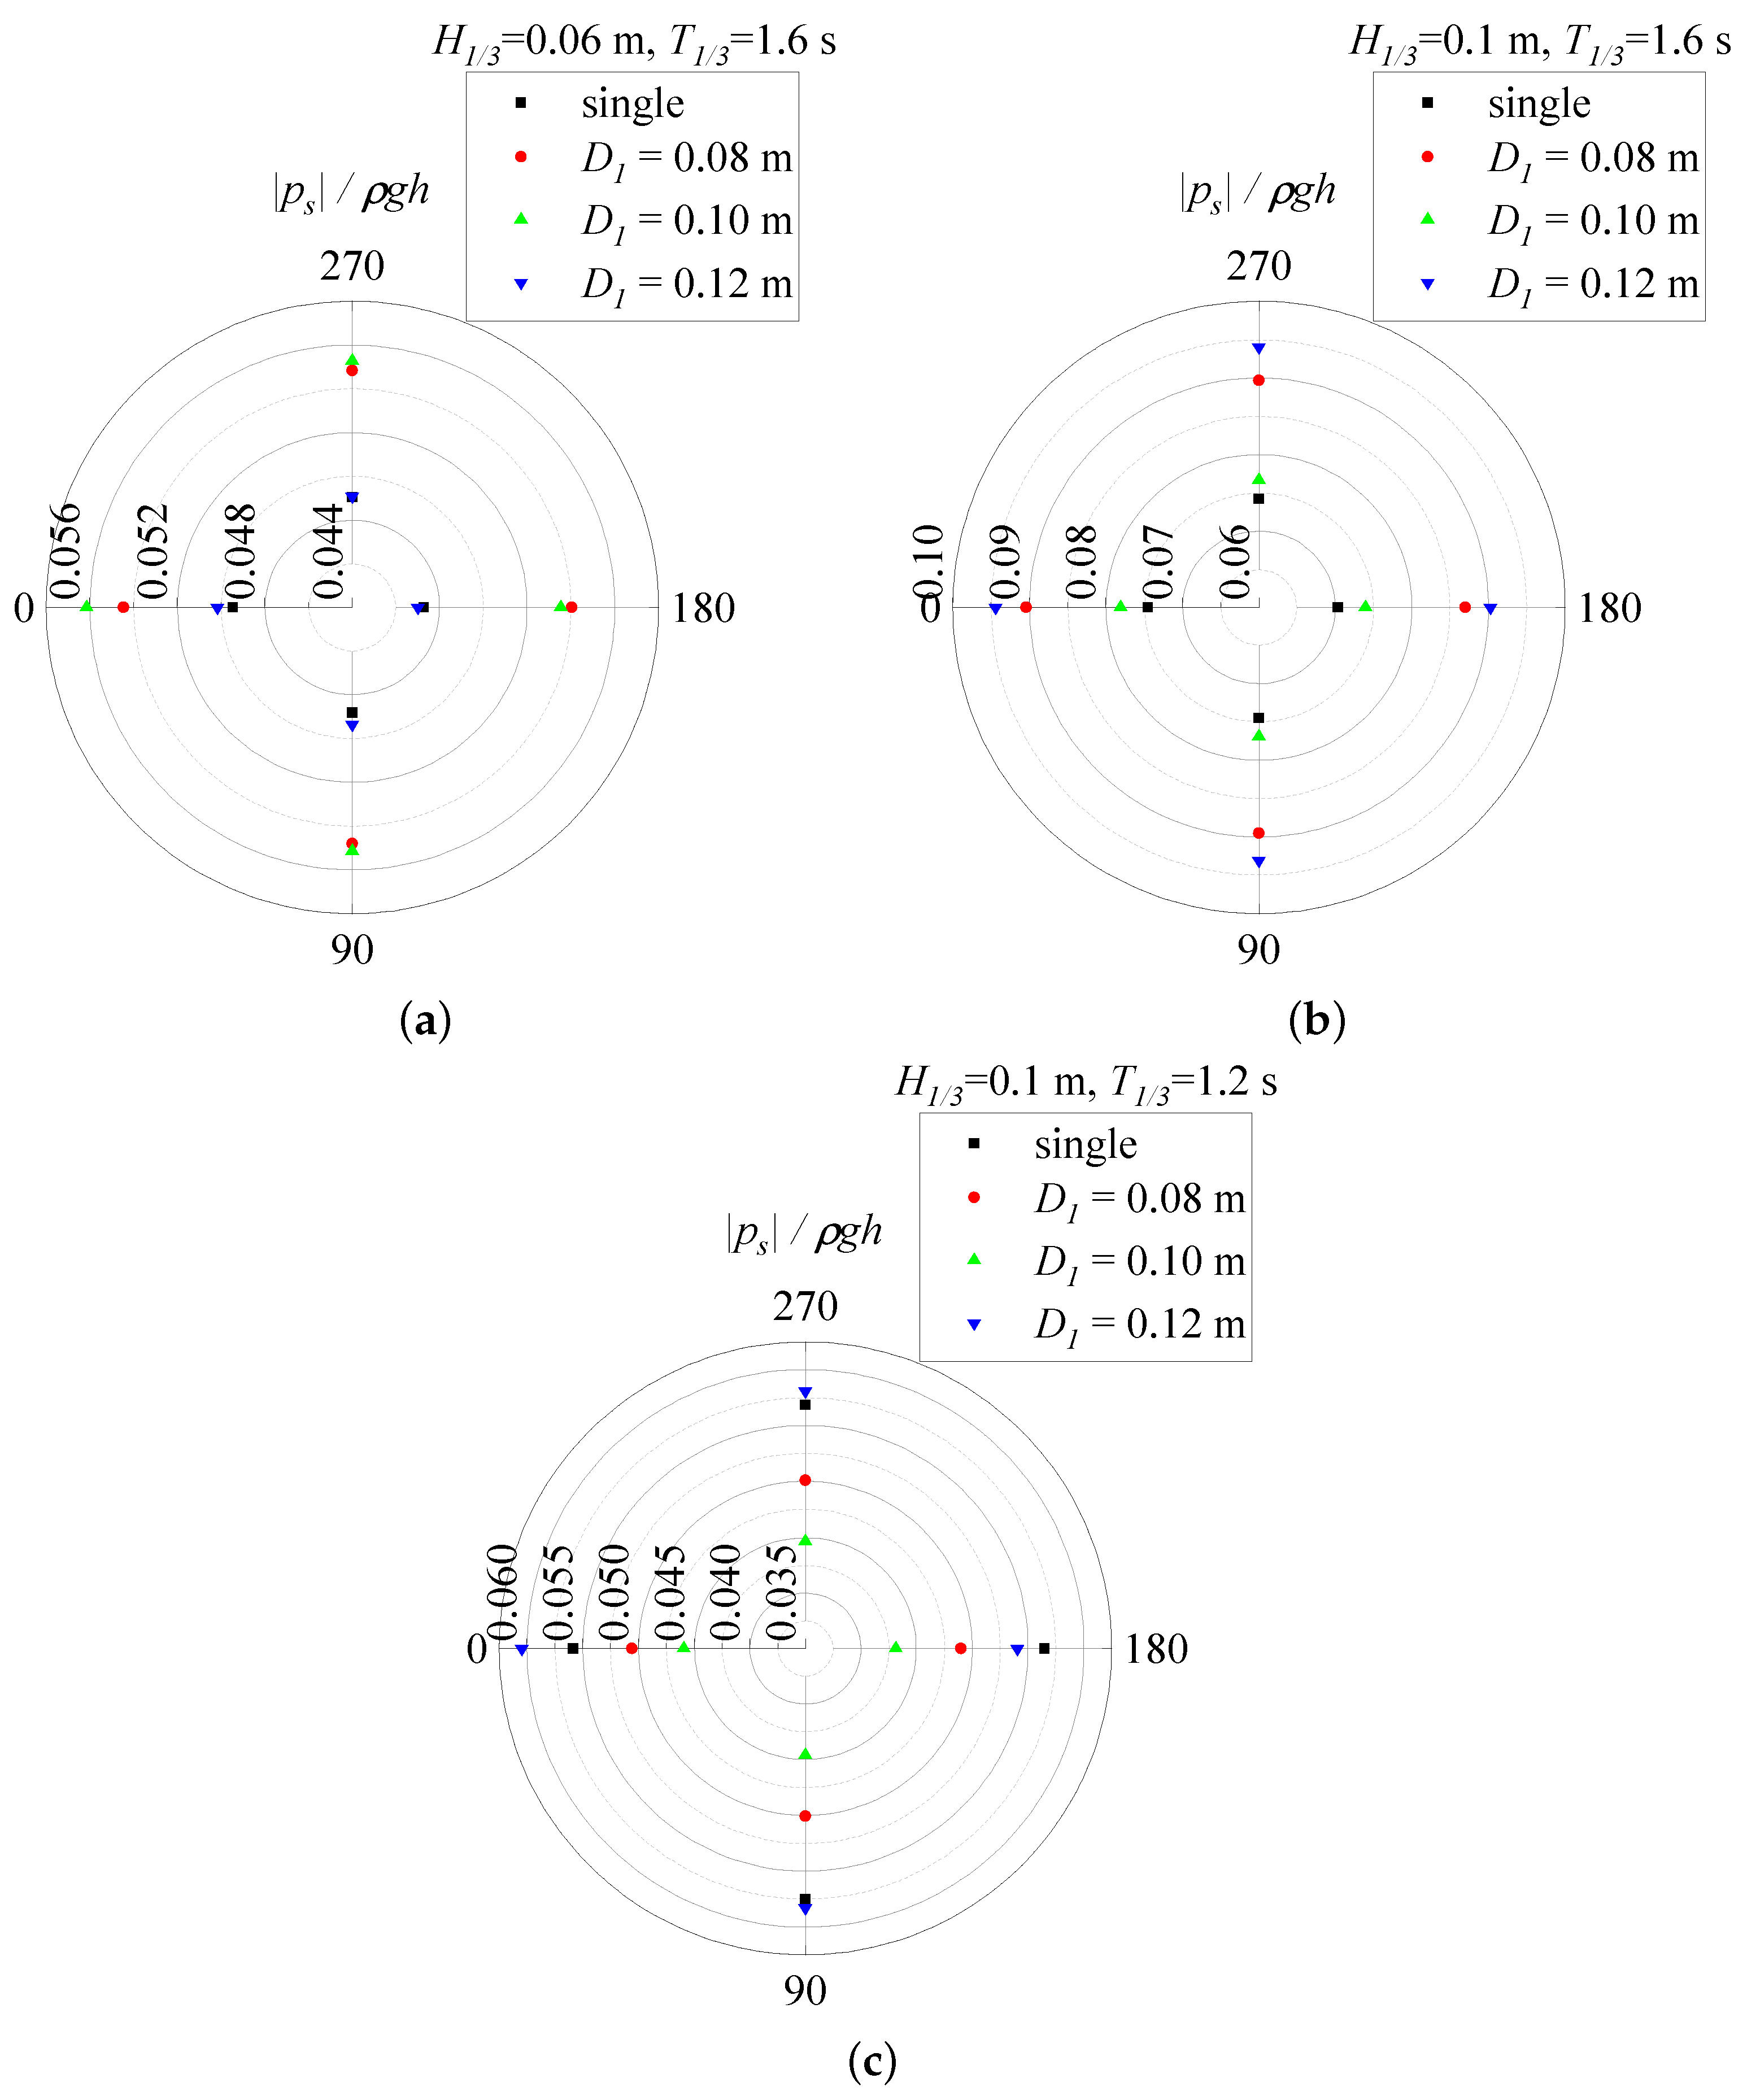
Spatial distributions of the maximum pore pressure around pile 1 at a distance of 0.05 m below the seabed surface under three front pile diameters of m (Case D), m (Case B), and m (Case E). These are compared with a single pile (Case A): (a) m, s; (b) m, s; (c) m, s. (. Pile 1: m, points 23, 25, 27, and 28. Single pile: m, points 29, 31, 33, and 34.)
Figure 17.
Spatial distributions of the maximum pore pressure around pile 1 at a distance of 0.05 m below the seabed surface under three front pile diameters of m (Case D), m (Case B), and m (Case E). These are compared with a single pile (Case A): (a) m, s; (b) m, s; (c) m, s. (. Pile 1: m, points 23, 25, 27, and 28. Single pile: m, points 29, 31, 33, and 34.)
Spatial distributions of the maximum pore pressure around pile 2 at a distance of 0.05 m below the seabed surface under three front pile diameters of m (Case D), m (Case B), and m (Case E). These are compared with a single pile (Case A): (a) m, s; (b) m, s; (c) m, s. (. Pile 2 and single pile: m, points 29, 31, 33, and 34.)
Figure 18.
Spatial distributions of the maximum pore pressure around pile 2 at a distance of 0.05 m below the seabed surface under three front pile diameters of m (Case D), m (Case B), and m (Case E). These are compared with a single pile (Case A): (a) m, s; (b) m, s; (c) m, s. (. Pile 2 and single pile: m, points 29, 31, 33, and 34.)
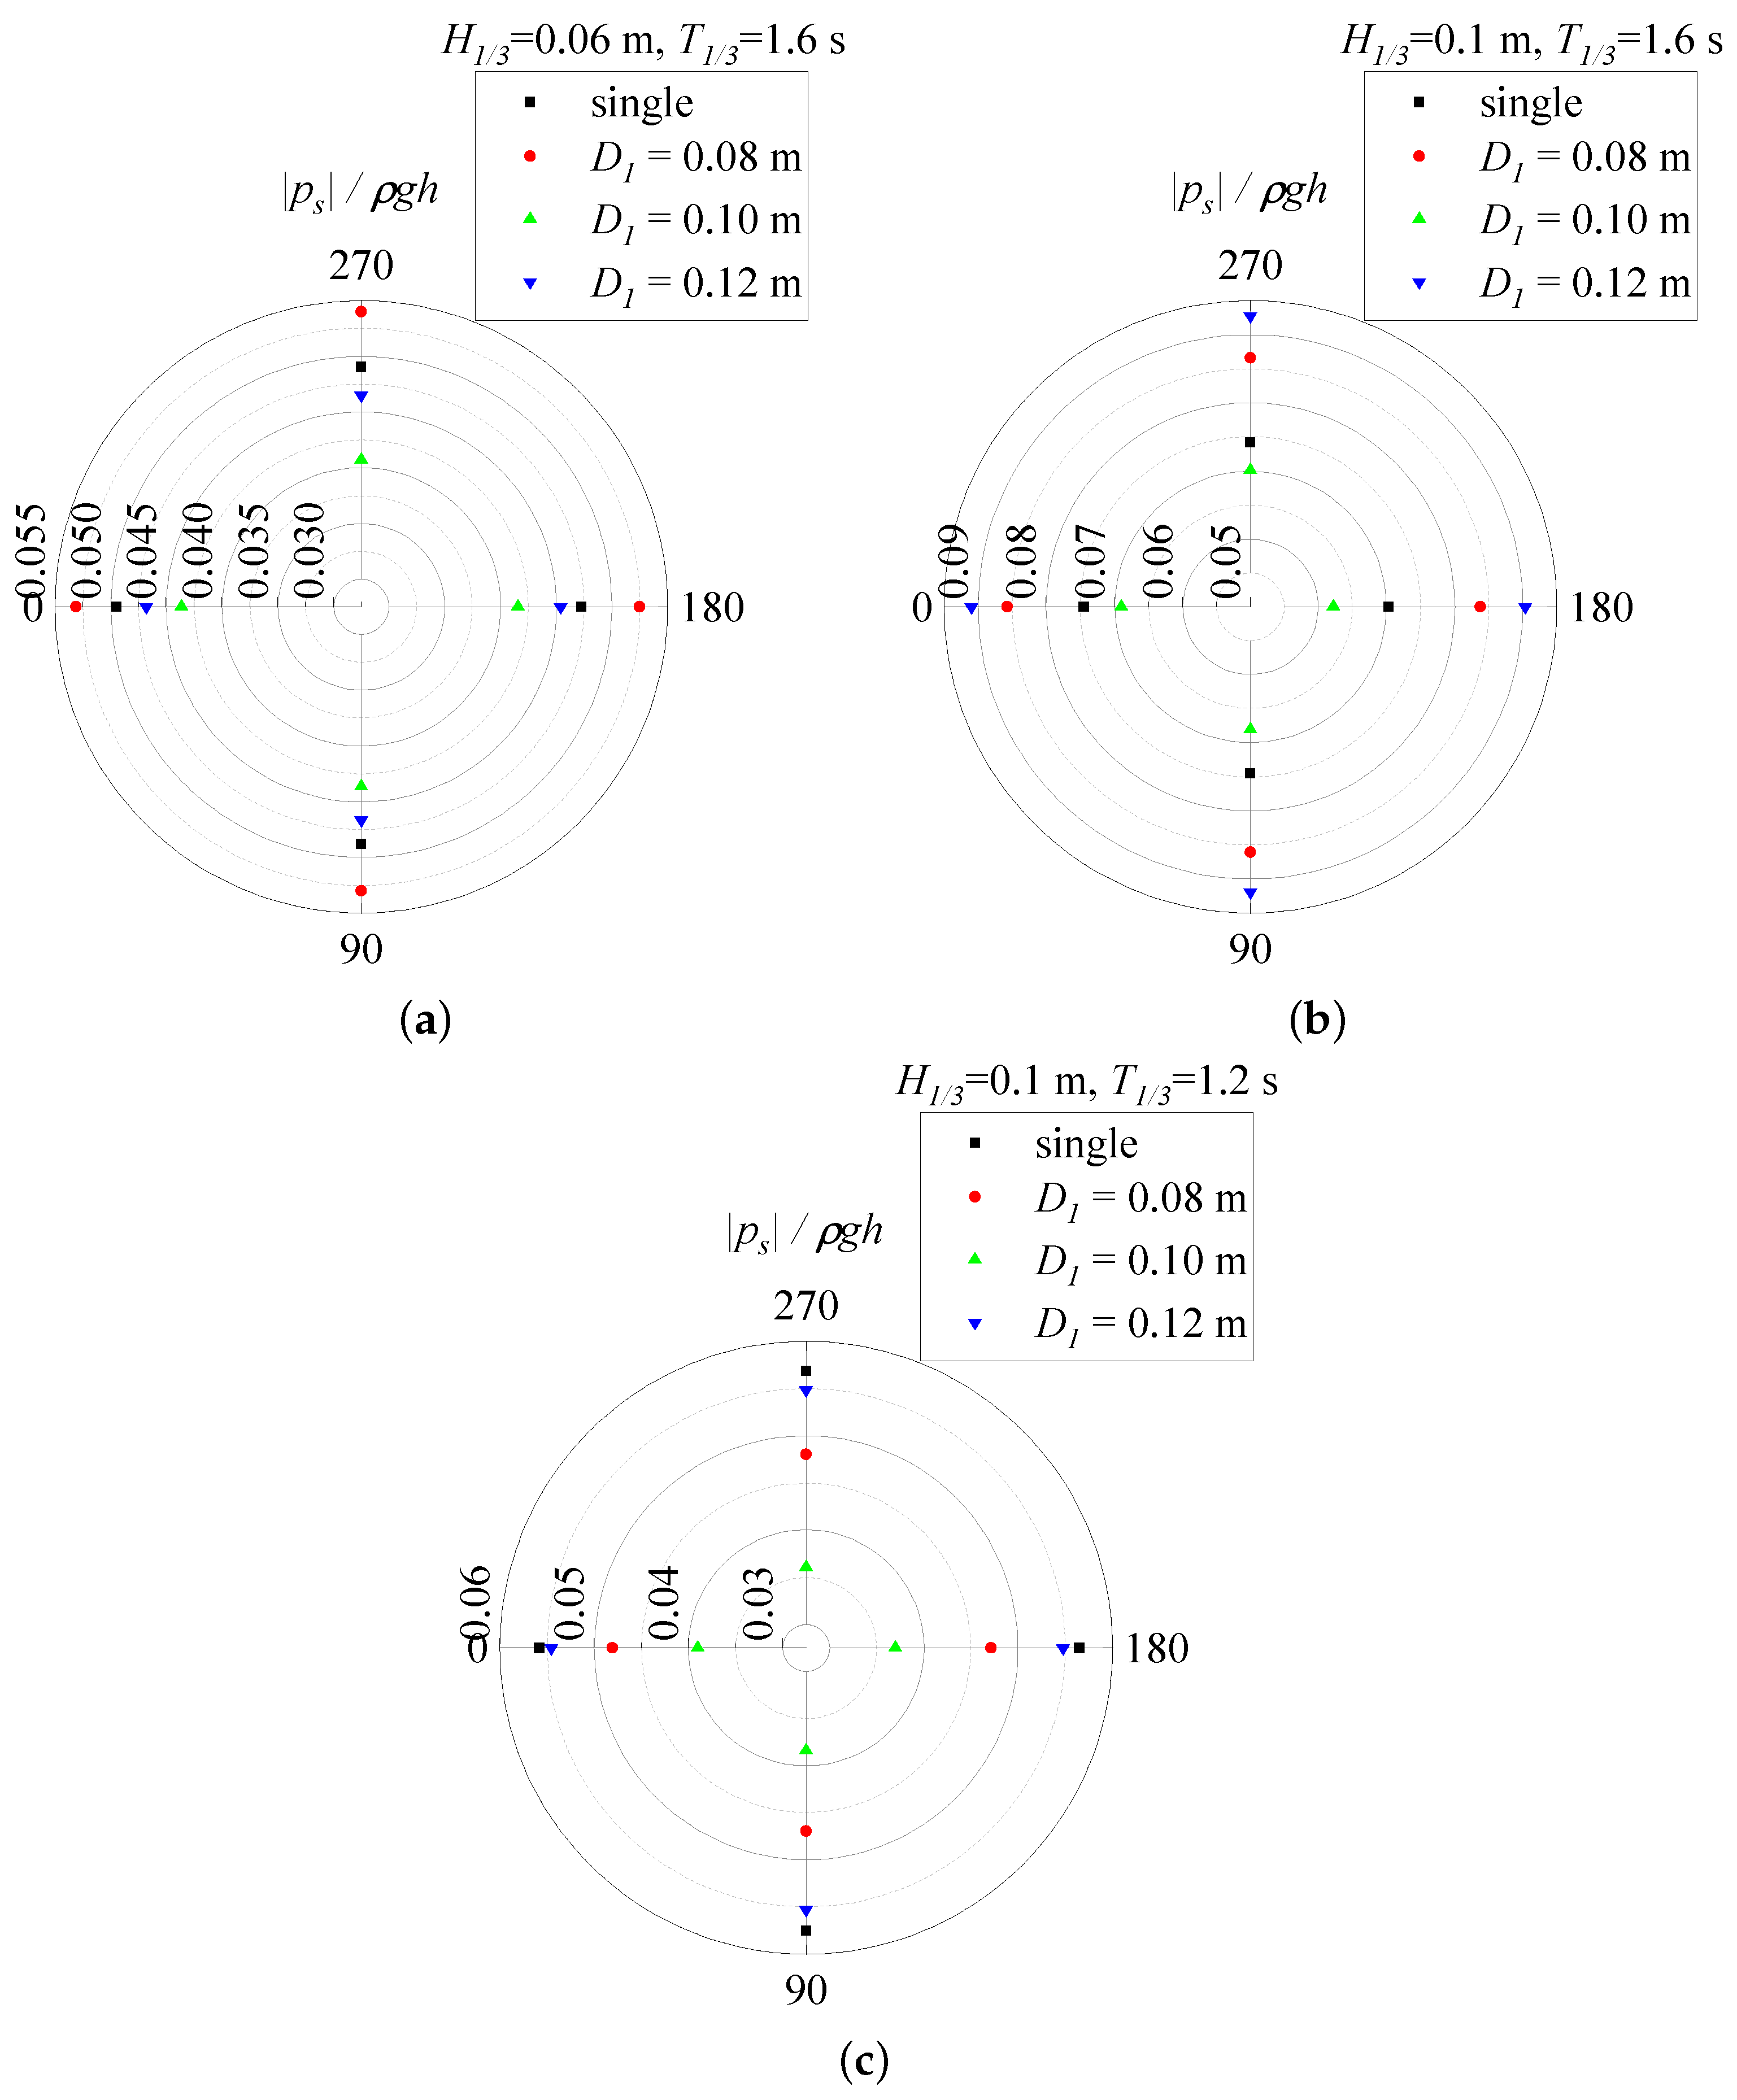
Table 1.
The wave parameters used in the present study.
Table 1.
The wave parameters used in the present study.
| Serial Number | (m) | (s) |
|---|---|---|
| 1 | 0.06 | 1.6 |
| 2 | 0.08 | 1.6 |
| 3 | 0.10 | 1.6 |
| 4 | 0.12 | 1.6 |
| 5 | 0.10 | 1.2 |
| 6 | 0.10 | 1.4 |
| 7 | 0.10 | 1.8 |
Table 2.
The pile model parameters used in the present study.
Table 2.
The pile model parameters used in the present study.
| Pile Diameter D (m) | Submerged Weight (N/m) |
|---|---|
| 0.08 | 2.3 |
| 0.10 | 2.9 |
| 0.12 | 3.5 |
Table 3.
The properties of the soil sample used in the present study.
Table 3.
The properties of the soil sample used in the present study.
| Soil Properties | Value | Unit |
|---|---|---|
| Dry density () | 1.5337 | g/cm2 |
| Specific gravity () | 2.6540 | – |
| Permeability coefficient () | 0.0767 | cm/s |
| Poisson’s ratio () | 0.3 | – |
| Shear modulus (G) | 9.23 | MN/m2 |
| Void ratio (e) | 0.7304 | – |
| Porosity (n) | 0.4221 | – |
| Maximum dry density () | 1.6076 | g/cm3 |
| Minimum dry density () | 1.2963 | g/cm3 |
| Relative density () | 0.7994 | – |
| Median particle size () | 0.2037 | mm |
Source link
Mingqing Wang www.mdpi.com

