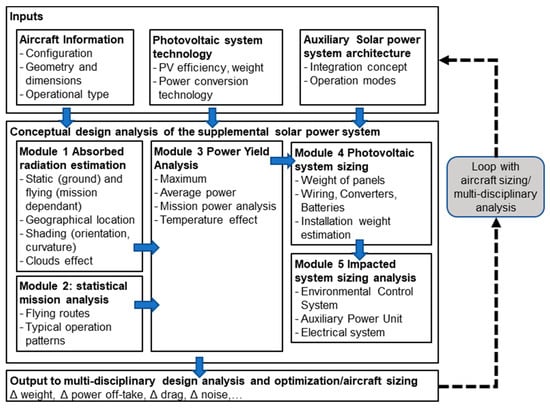
Module 1 contains the models and methods to calculate the absorbed radiation in various operation scenarios. Module 2 focuses on understanding how the flight mission pattern impacts the power yield of the SPS. Variations in routes, operation time, and schedule can significantly affect overall power yield, potentially rendering the solution non-viable. Module 3 combines inputs from Modules 1 and 2 for power yield analysis, including solar cell technology and additional SPS equipment. Module 4 examines the architecture of aircraft systems after adding solar power systems. Module 5 estimates SPS weight, considering aircraft geometry and wiring. Module 6 is reserved for analyzing impacts on other aircraft systems based on SPS implementation.
To perform the case study for the seaplane operation, the authors expanded Modules 1, 3, and 4 of the framework.
2.1.1. Module 1 Improvements: Solar Irradiance Model
One must consider four factors to calculate absorbed radiation by solar cells on an aircraft: geographical location, cell orientation to the sun, potential shading, and meteorological conditions. The mathematical model calculates the absorbed radiation during a flight mission between two locations for the aircraft’s tail, wing, and/or fuselage, as the continuation of previous work from our lab.
The solar declination angle
[
30,
31], which varies with the day of the year
, is given by Equation (1):
The absorbed radiation during a flight mission is calculated between two locations, and the changes in latitude
and longitude
between the departure and arrival points are given by Equations (2) and (3).
Moreover, the sun radiation power density [W/m
2] received by the aircraft depends on the angle between the vector pointing to the sun and its projection on a horizontal plane. This azimuth angle (
β) is given by Equation (4).
Since the irradiance changes with the location, the latitude and longitude are calculated at each time step
i during the flight using Equations (7)–(9).
The cosine of the solar zenith angle, the solar zenith angle, and the air mass [
32] are crucial for calculating the intensities of solar radiation at each time step. These parameters directly influence the beam, direct, diffuse, and incident intensity of solar radiation. These are given by Equations (10) and (11).
Finally, the beam intensity
[
33], direct intensity
, diffuse intensity
, and incident intensity
of solar radiation for each time step are computed using Equations (12)–(15).
The total absorbed intensity of solar radiation
is calculated at each time step, incorporating a surface absorption factor
, which represents the fraction of incident solar radiation absorbed by the surface. The absorption factor
, typically ranges from 0 to 1. Here,
is assumed [
22].
In addition, partial shading of the solar panels may significantly affect the absorbed radiation. Murugesan and Liscouët-Hanke [
15] quantified the potential amount of shading on wing, tail, and fuselage with a detailed orientation analysis. The aircraft configuration (i.e., wing and tail configuration) significantly affects shading, with factors reducing absorbed radiation by 12–40%: high-wing and T-tail aircraft will have minimal shading on those surfaces. The current SPS tool includes preset values for typical aircraft configurations. A detailed shading analysis is recommended for specific configurations. In general, installing solar cells in areas shaded for over 50% of flight time (i.e., vertical tail of side panels of the fuselage) is not recommended, as the added weight will in most cases outweigh the benefits of the solar power supply. More detailed shading pattern analysis can inform solar cell segmentation, connection to arrays, and installation of bypass diodes to minimize impact on overall array power output [
12,
15,
22].
Previous studies [
14,
15,
16] assumed that aircraft operate above cloud levels, but for smaller aircraft, especially those involved in air taxi operations, flying at lower altitudes requires accounting for cloud cover in radiation calculations, even if tourism-based flight operations (such as sightseeing) are often a “good weather” operation. There is no universal cloud effect modeling in the literature; however, several papers provide experimental data for specific geographic locations or conditions. Amusan et al. [
34] measured a reduction in solar cell power output of 24% for light clouds and 67% for heavy clouds for a particular day. Jiang et al. [
35] provided a detailed survey of the cloudiness effect on solar power output based on meteorological measurements in China in 2012. Their study found that ice clouds reduce plane-of-array irradiance (POAI) by 10–13% and liquid water clouds reduce it by 16–22%. Collectively, all cloud types decrease POAI by more than 27%, with the most significant reduction (34%) occurring in winter. Solar cell manufacturers also note that cloud conditions can reduce output power by 75–90% [
36]. Based on these findings, using a conservative approach, the conceptual design model assumes that solar panels would achieve around 25% of their normal output power under cloudy conditions. In addition, in the mission analysis, the number of sun and overcast hours in the geographical location can be defined.
2.1.2. Module 3: Improved Power Yield Analysis
Given that aircraft experience a wide range of temperatures—from as high as +55 °C on the ground to as low as −80 °C at high altitudes—the efficiency and power output model is updated to reflect these conditions.
The power generated by photovoltaic (PV) panels depends on their temperature and the solar irradiation. To determine the maximum electrical power output, we used the following calculation [
37]:
Under typical sunlight levels of 1000 W/m
2 and a PV module temperature of 25 °C, the value
Pm represents the maximum possible electrical output, while
Pm,stc is the maximum power output under standard test conditions. The term
refers to the temperature coefficient for maximum power, indicating how temperature changes impact power output. In this setup,
TPV stands for the PV module temperature, and
IT is the level of solar irradiation affecting the panel [
38].
In addition, the solar cell module is also subject to convective heat transfer, particularly during flight. The effect of the wind speed
is captured in the formula developed by Skoplaski and Palyvos [
39,
40] in Equation (18).
Equation (18) considers all relevant environmental factors, such as ambient temperature , wind speed , and solar irradiance . All these parameters affect the temperature of photovoltaic (PV) modules. The equation emphasizes the interplay between solar heating, which is influenced by solar irradiance, and the cooling effect provided by wind, where higher wind speeds enhance the transfer of heat away from the module into the surrounding environment, while the wind speed is equivalent to the aircraft speed in flight conditions. A minimum wind speed of 1 m/s must be assumed for the model to be valid, which is also a realistic scenario in ground conditions.
Heat conduction to aircraft with integral wing fuel tanks also plays a role. This aspect is not considered here. Overall, the presented model provides a more realistic insight into solar system performance during flight conditions.
2.1.3. Module 4: Solar Panel Thickness and System Weight Estimation
The SPS consists of several elements: the solar modules (cells combined together and encapsulated), the electrical components (converters and wiring), and potentially a battery. This subsection outlines the weight estimation methodology implemented in the modeling framework.
In principle, two methods exist for integrating solar cells into an aircraft surface: (1) structural integration, meaning the designing and manufacturing of aircraft surfaces with integrated solar panels; and (2) adding solar panels on top of existing aircraft surfaces. Method one, widely used for experimental aircraft, is undoubtedly more weight-efficient and minimizes the effect on aerodynamics, but it might be impractical for maintaining and replacing cells. For aircraft retrofits, i.e., for larger aircraft, method 2 has to be considered as well. Method 2 is considered a conservative approach in the presented conceptual design framework.
The weight of solar panels is estimated based on the solar panel thickness. The thickness of the solar panel depends on the materials selected. Solar cell manufacturer data sheets typically provide information on the solar cell thickness and weight. However, few details on solar cell encapsulation for aircraft applications are available in the literature.
Figure 2 presents a typical PV panel setup, consisting typically of four to five layers of different materials, according to a study from Pavlovic et al. [
41] regarding the best encapsulation materials for photovoltaic panels used in racing vehicles.
At the conceptual design level, we are interested in understanding the potential variations in thickness and weight for suitable materials.
Table 1 provides a compilation of the thicknesses of various components used in solar panels, focusing on each material’s minimum and maximum thicknesses. The materials analyzed, including the lamination-type layers shown in
Figure 2, reveal that ETFE and PVDF exhibit the most significant variation in thickness.
The configuration PVDF–thin film (a-Si)–EVA–PVDF–back sheet exhibits the highest thickness, approaching 1.6 mm. In contrast, the ETFE–GaAs–EVA–back-sheet configuration shows the lowest thickness of around 0.5 mm. The configuration PVDF–GaAs–EVA–ETFE–back sheet has a higher maximum weight, nearing 3.25 kg–m2. In contrast, the configuration ETFE–thin film–EVA–back sheet presents the lowest weight—about 0.581 kg/m2.
This analysis underscores the critical role of material selection in solar panel design: heavier configurations might offer enhanced durability as lighter configurations. Therefore, optimizing the material composition of solar panels is important for more detailed design phases. In this paper, focusing on understanding potential implications for early aircraft design, the data in
Table 1 are used in a design of experiment (DOE).
Lastly, the thickness of the solar panels also potentially affects the aircraft’s aerodynamic efficiency if mounted on top of the aircraft. A preliminary study for an NACA 64A416/4416 airfoil using computational fluid dynamics shows that with a smoothened transition between solar panel and wing, the effect on the drag and lift is very small (0–5%). Therefore, this drag penalty and change in lift-to-drag ratio will be considered in the DOE.
The methodology for determining the wiring weight of the solar power system (SPS) is based on segmenting the solar panels according to the number of surface segments used. The total power output (watts) of the system (
) is the sum of the power generated by the solar panels on the right wing
, left wing (
, fuselage (
), and horizontal tail (
, expressed as:
The estimated current for each segment is calculated separately based on the power output from the surface area of the solar panels located on the right wing, left wing, fuselage, and horizontal tail, since the voltage required by the aircraft is predetermined. The current for each segment is calculated using Equation (20):
where is the current for segment , is the power output for segment , and is the voltage requirement of the aircraft. Once the current is determined, the appropriate American Wire Gauge (AWG) cable is selected based on its current-carrying capacity.
The total length of wiring required between the solar panels, charge controllers, batteries, and other electrical components is measured considering the design of the aircraft, which may necessitate long wire runs. The total wiring weight
is then calculated using Equation (21), with
, and
as the wire length for the right wing, left wing, fuselage, and tail, respectively, and
as the unit weight of the wire per length:
Following determination of the total output power of the aircraft’s solar panel surfaces in watts (W), it is essential to select the appropriate converter: a DC–DC boost converter is typically required to bring the solar panel output voltage to the standard 24/28 V in the aircraft’s low-voltage DC network. Typically, the converter’s power rating
is slightly higher than the peak output of the solar panels to ensure operational reliability and to account for potential power surges. A safety factor (
) is recommended: it allows for operational reliability and accounts for potential power surges, which aligns with general engineering practices for safety and reliability in aircraft systems, depending on the specific operational conditions and design requirements [
46,
47].
The battery sizing is essential, with a focus on optimizing battery capacity and weight to improve overall aircraft efficiency. An important step in the battery design process involves calculating the required battery capacity, denoted Q, which represents the energy storage necessary to meet the power demands of the aircraft over a specified mission profile. For aircraft missions, Q is derived by considering the total energy demand (), depth of discharge (D), and battery efficiency (η).
The weight of the battery is a key parameter influencing aircraft performance and can be calculated using Equation (23):
where is the battery’s specific energy, typically ranging from 130–300 Wh/kg for aerospace lithium-ion batteries.
With all the abovementioned enhancements of the SPS sizing framework, conceptual designers can now perform aircraft-level trade studies for aircraft in the commuter category, considering a more realistic estimation of the SPS efficiency and weight. The framework for the aircraft-level analysis is covered in the following section.