La Niña conditions continue, but forecasters estimate a 66% chance of a switch to neutral in March–May. This is looking like a weak and short La Niña. Also, while La Niña’s ocean conditions are currently weak, the atmospheric component is fairly strong. Today, I’ll cover current conditions, the forecast, and that mismatch between the ocean and atmosphere across the tropical Pacific Ocean.
Live in the moment
La Niña and its counterpart El Niño make up the El Niño/Southern Oscillation, or ENSO. La Niña’s characteristic cooler-than-average tropical Pacific surface water changes global atmospheric circulation in known ways, providing an early picture into potential upcoming temperature, rain/snow, and other climate patterns. El Niño’s warmer-than-average tropical Pacific also has global impacts on climate patterns. In between the two phases, when the tropical Pacific is near average temperature, lies neutral conditions. ENSO is predictable months in advance, giving us a heads-up on hurricane and tornado seasons, coastal flooding, atmospheric rivers, drought, next summer’s temperature, global crop yields and disease outbreaks, and even financial markets.
Yesterday, today, tomorrow
Our primary index for La Niña and El Niño is the surface temperature of the east-central tropical Pacific Ocean in the Niño-3.4 region—specifically, how much that temperature differs from the long-term average, where long-term is currently 1991–2020. In January, the Niño-3.4 index was -0.8 °C, according to our most reliable dataset, the ERSSTv5. This is the second month in a row that the Niño-3.4 index has exceeded the La Niña threshold of -0.5 °C, and falls into our unofficial “weak” category: a Niño-3.4 index between -0.5 and -0.9 °C.
How sea surface temperatures in the Niño-3.4 region of the tropical Pacific changed over the course of all La Niña events since 1950 (gray lines) and 2024-25 (black line). This shows the traditional calculation for Niño-3.4, the monthly temperature compared to the most recent 30-year average (1991–2020 for the 2024 line). By this measure, the La Niña threshold was crossed in December 2024, but La Niña remains weak. Climate.gov graph, based on data from Michelle L’Heureux from CPC using ERSSTv5.
The atmospheric component of La Niña includes stronger near-surface trade winds, stronger upper-level winds, more rain than average over Indonesia, and less rain over the cooler waters of the central tropical Pacific. All these signs were observed during January, evidence of La Niña’s expected strengthening of the Walker circulation, and we can say with confidence that La Niña conditions are present. There’s more to this atmospheric story, but you’re going to have to wait a few paragraphs!
Most of our computer climate models predict that the sea surface temperature will stay in La Niña territory for just a few more months. These predictions are the primary factor behind the 66% chance that the March–May period will reflect ENSO-neutral. In fact, there’s a 41% chance La Niña conditions will end even earlier, in the February–April season, although the strongest odds are for continued weak La Niña during that period.
Out of the three climate possibilities—La Niña, El Niño, and neutral—forecasts say that ENSO-neutral conditions are most likely for the March–May period (gray bar). Looking out to the Northern Hemisphere fall, neutral is the most likely, but La Niña (blue bar) has nearly twice the odds of El Niño (red bar). NOAA Climate Prediction Center image.
Looking further ahead, there are no strong signals right now for next fall and ENSO-neutral is favored, but we do see a tilt in the odds toward La Niña over El Niño. There are some hints in the climate models in this direction, but it’s too early to make a confident prediction (plus we are going through the infamous spring barrier when ENSO predictions are particularly challenging). La Niña conditions two winters in a row are not uncommon, though—for example, we just emerged from three consecutive La Niña winters in 2023.
Of mild interest is the January subsurface temperature in the tropical Pacific Ocean, which was the third coolest January since 1979, when our records of subsurface temperatures begin. The other top 5 Januarys—1999, 2008, 2000, and 2011—were all followed by La Niña the next fall/winter. This isn’t a large enough sample to rely on, though, making this just a interesting factoid at the moment.
Living in the future
Over the past several months, we’ve noted that the global oceans have been much warmer than normal. We’ve also noted that while the ocean component of La Niña is weak, the atmospheric anomalies are currently quite robust, an unusual mismatch. Especially in far flung areas of the globe, the atmospheric anomalies are how ENSO affects climate patterns. To understand why this could be important for forecasting impacts, check out Nat’s early December post exploring the potential for a weak La Niña to have a stronger impact on rain/snow patterns.
It’s likely that the global ocean warmth is affecting La Niña, and one adaption we’re exploring is the “relative Niño-3.4 index.” Whereas our traditional Niño-3.4 index measures the departure from the long-term average (the anomaly) of the sea surface temperature in the Niño-3.4 region, the relative index also takes into account the temperature of the overall tropical oceans. With the relative index, the goal is to better isolate the coupled ENSO phenomenon itself and not the other factors like overall ocean warming. Recently, the relative Niño-3.4 index is quite a bit stronger than the one I showed above, meaning that the warming of the tropical oceans may be hindering our vision of La Niña if we stick to the traditional measures of ENSO strength. It’s like we are in the process of discovering that our prescription glasses may need to be updated in order for us to better track El Niño and La Niña.
How sea surface temperatures in the Niño-3.4 region of the tropical Pacific changed over the course of all La Niña events since 1950 (gray lines) and 2024 (black line), based on the relative Niño-3.4 calculation. Here, the monthly temperature is compared to the most recent 30-year average, but then the tropical average ocean surface temperature is subtracted, to account for global ocean warmth. By this measure, La Niña conditions are stronger than by the traditional measure. The relative Niño-3.4 index is not our official metric, though, and it needs more research. Climate.gov graph, based on data from Michelle L’Heureux.
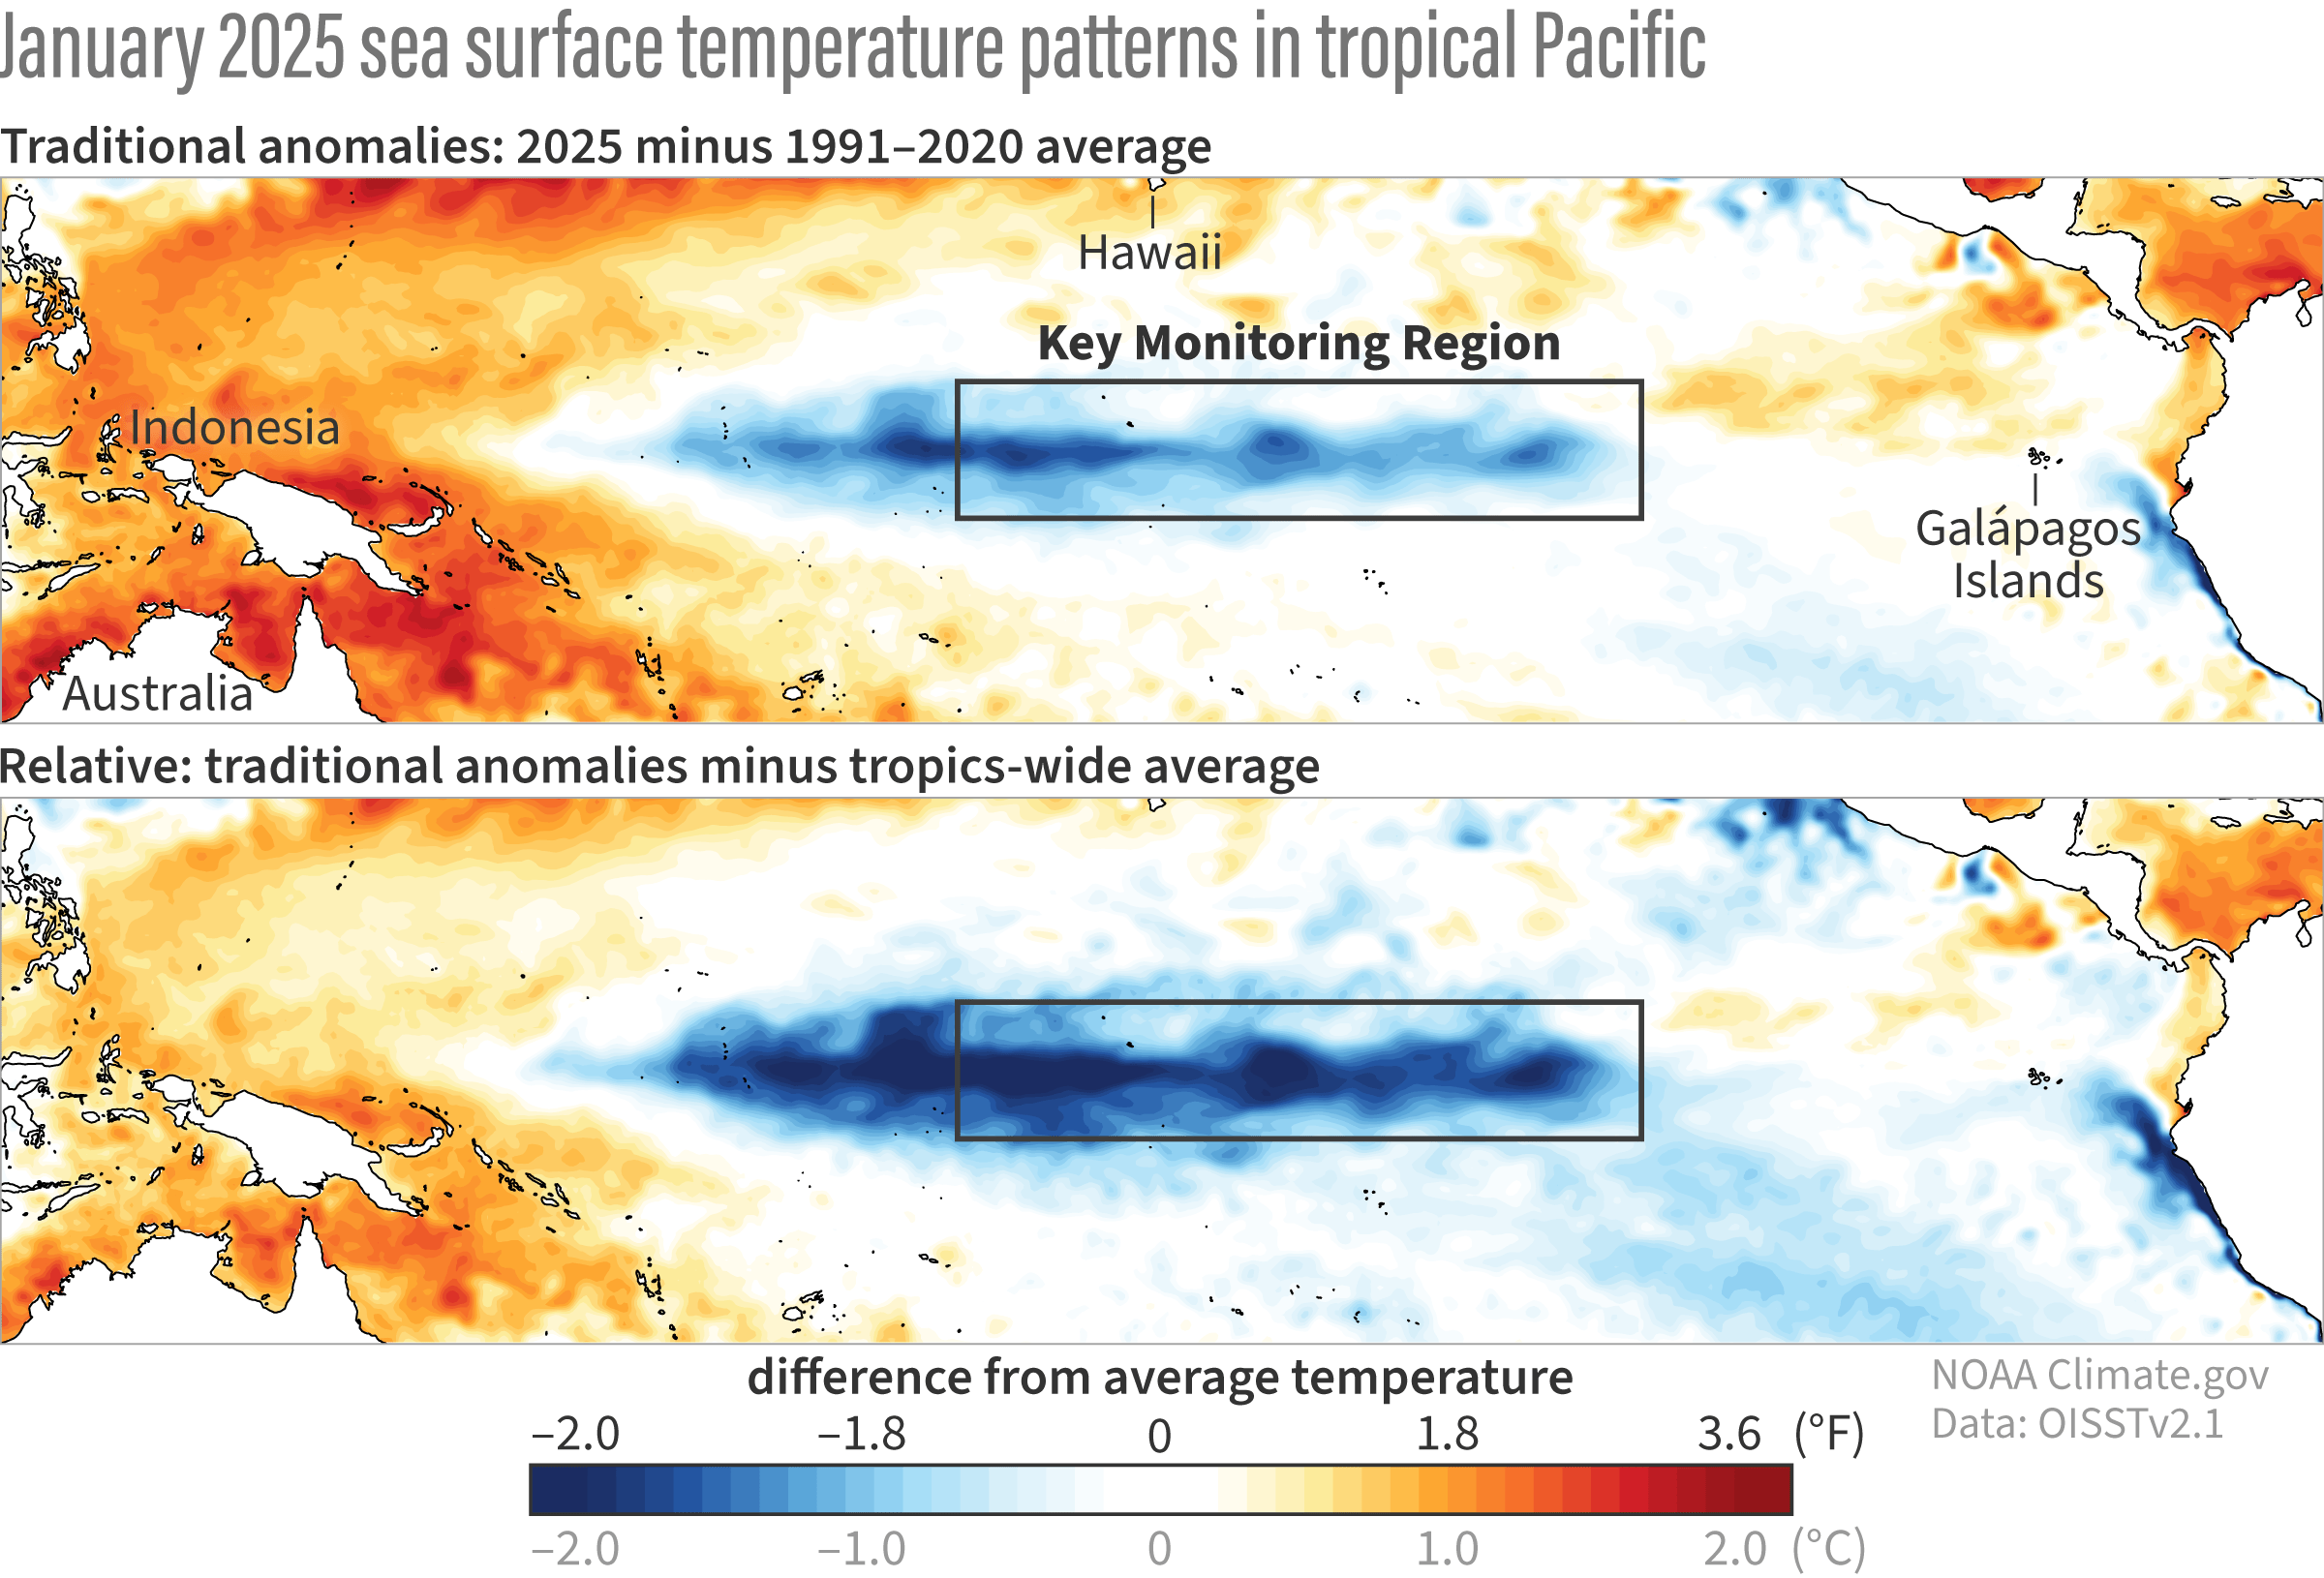
For another view, check out how the sea surface temperature anomaly in the Niño-3.4 region looks when we subtract out the entire tropical average anomaly.
These maps show two ways of looking at the sea surface temperature anomaly (difference from average), with the Niño-3.4 key monitoring region indicated by the boxes. The top maps shows the traditional sea surface temperature anomaly: the departure of January 2025 sea surface temperature from the 1991–2020 average. For the bottom map, the average anomaly across the entire tropical oceans is also subtracted, highlighting how cool the Niño-3.4 region is relative to the rest of the tropics. Figure by climate.gov based on Michelle L’Heureux’s calculations.
Turning to the atmospheric response, Michelle graphed the Equatorial Southern Oscillation (EQSOI), which measures the difference in surface pressure between the far western and eastern equatorial Pacific. When this index is positive (i.e., stronger than average), it indicates La Niña’s enhanced Walker circulation. Michelle also looked at cloudiness over the central tropical Pacific—less cloudiness and rain is the characteristic La Niña response.
Two ways of looking at the atmospheric conditions in the tropical Pacific: the Equatorial Southern Oscillation (left) and cloudiness in the central Pacific (right). The colored lines show 2024–25, while the gray lines are every La Niña on record since 1979. Both measurements provide evidence that the Walker circulation is stronger than average, a La Niña atmospheric signature, and among the strongest on the record. Climate.gov graph, based on data from Michelle L’Heureux.
As you can see, while our current La Niña conditions are quite weak when you look at our traditional sea surface temperature anomaly, they’re among the strongest by some of our atmospheric metrics. We don’t use atmospheric metrics for official ENSO designations because 1) they are more variable than the sea surface temperature, meaning they can be influenced by short-term weather and bounce around and 2) many atmospheric datasets are more reliable after satellites were widely adopted ~1980, which means we only have a shorter observational record to examine. However, we find the atmospheric metrics are telling us a coherent story—they are impressively La Niña-ish and stronger than what we are seeing in our traditional ocean measures.
See you soon
There’s a lot to look forward to here on the ENSO Blog, including Tom’s upcoming post on two decades of ENSO prediction. I’ll see you back here in March to find out how things go with our current La Niña situation.
Source link
abigail.reid www.noaa.gov