1. Introduction
This study aims to leverage SSM/I remote sensing data, Climate Hazards Center InfraRed Precipitation with Station data (CHIRPS), and land use data from 1991 to 2020 to conduct a thorough analysis of torrential rain and flood characteristics in the Yangtze River Basin’s three major urban agglomerations. By calculating the Normalized Difference Frequency Index (NDFI) and the Normalized Difference Polarization Index (NDPI), we assess land surface moisture and identify potential flood disaster risks. We further analyze the impact and risk distribution of various factors influencing flood disasters by combining precipitation and land use data. This study provides a scientific basis for disaster prevention and mitigation while promoting coordinated development in urban planning and water resource management, which are essential components for addressing the growing challenges posed by more frequent and severe flood disasters.
2. Study Area and Method
Using satellite observations, we evaluated precipitation and surface flooding during the summer months from 1 June to 31 August, encompassing the major flood period of 2020. This involved comparing precipitation, surface flooding, and land use against long-term averages from 1991 to 2020.
2.1. Precipitation Detection and Validation
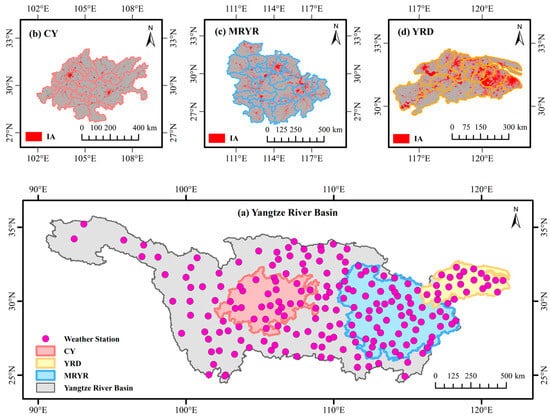
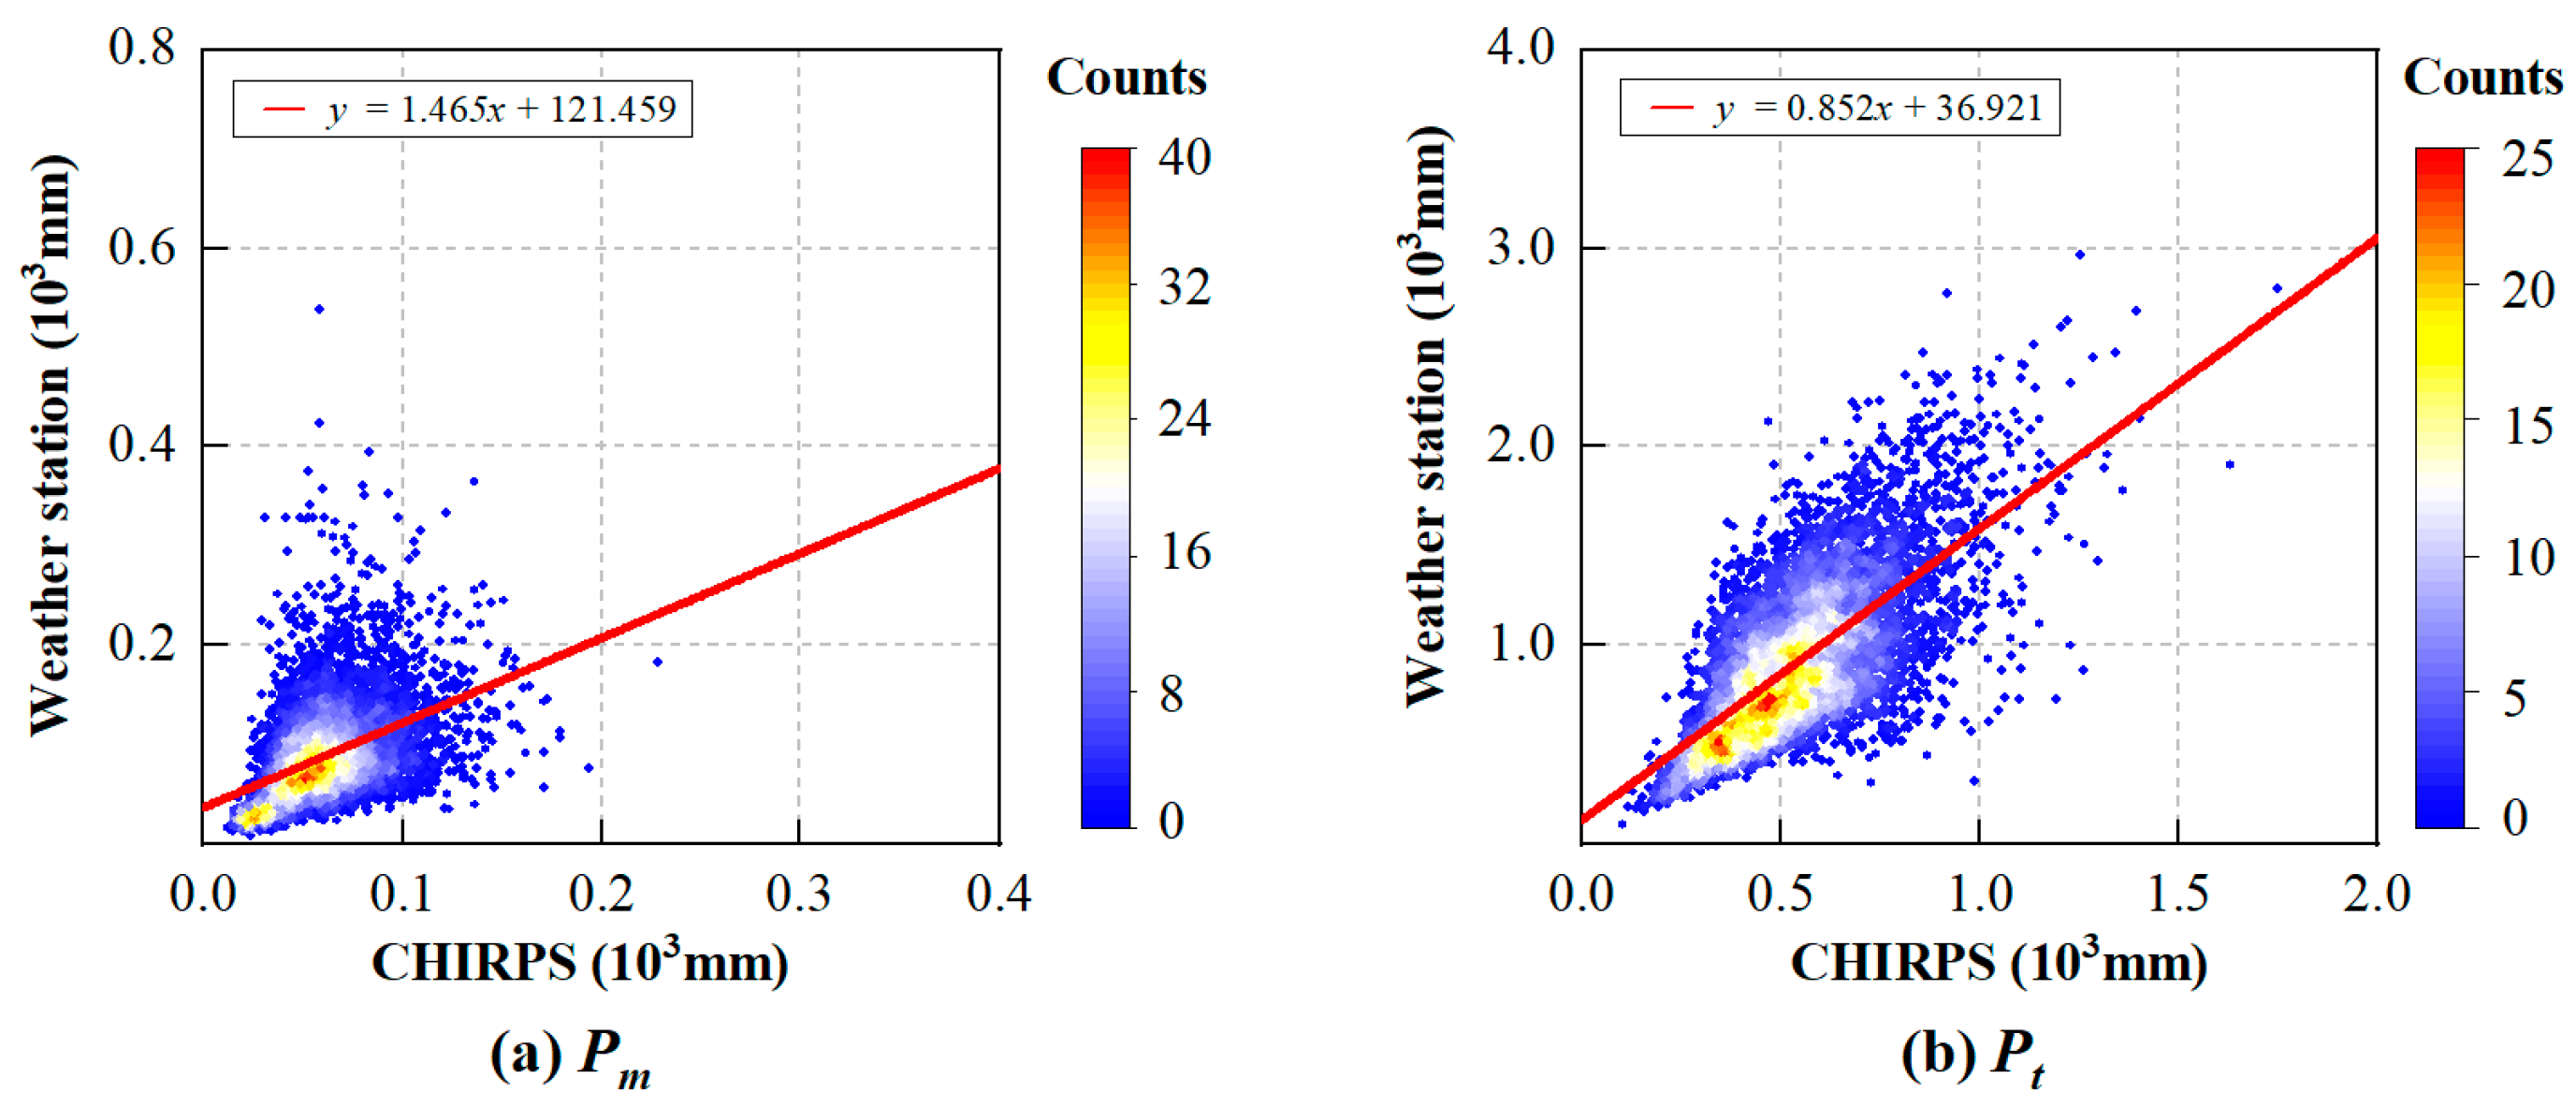
Daily local rain gauge data were sourced from the China Meteorological Administration (CMA), covering 220 rain gauge stations in the Yangtze River Basin from 1991 to 2020. However, due to missing data, only 201 stations matched the time coverage of the CHIRPS data.
where C and O represent the total or daily maximum precipitation amounts from CHIRPS and local rain gauges, respectively.
2.2. Flood-Affected Area Detection
where TB36.5V, TB22.2V, TB19.35V, and TB36.5H represent brightness temperatures at 36.5, 22.2, and 19.35 GHz vertical polarization, and 36.5 GHz horizontal polarization, respectively. These were used to calculate the maximum NDFI (NDPIm) and NDPI (NDPIm) for each pixel during the flood season annually.
2.3. Flood Intensity Assessment
where aPm, aPt, aNDFIm, and aNDPIm represent the anomalies for Pm, Pt, NDFIm, and NDPIm, respectively. The subscript indicates the year. The symbols μ and σ represent the multi-year (1991–2020) average and standard deviation, respectively. The symbols x (longitude) and y (latitude) represent the pixel location.
If the results from Equations (5)–(8) are greater than 0, then Pm, Pt, NDFIm, and NDPIm are above average for the year. If aPm, aPt, aNDFIm, and aNDPIm become more positive in a given year, it signifies a significant increase in Pm, Pt, NDFIm, and NDPIm compared to other years. Areas with higher anomalies experience unusually intense or voluminous precipitation and surface flooding.
2.4. Land Use and Imperviousness
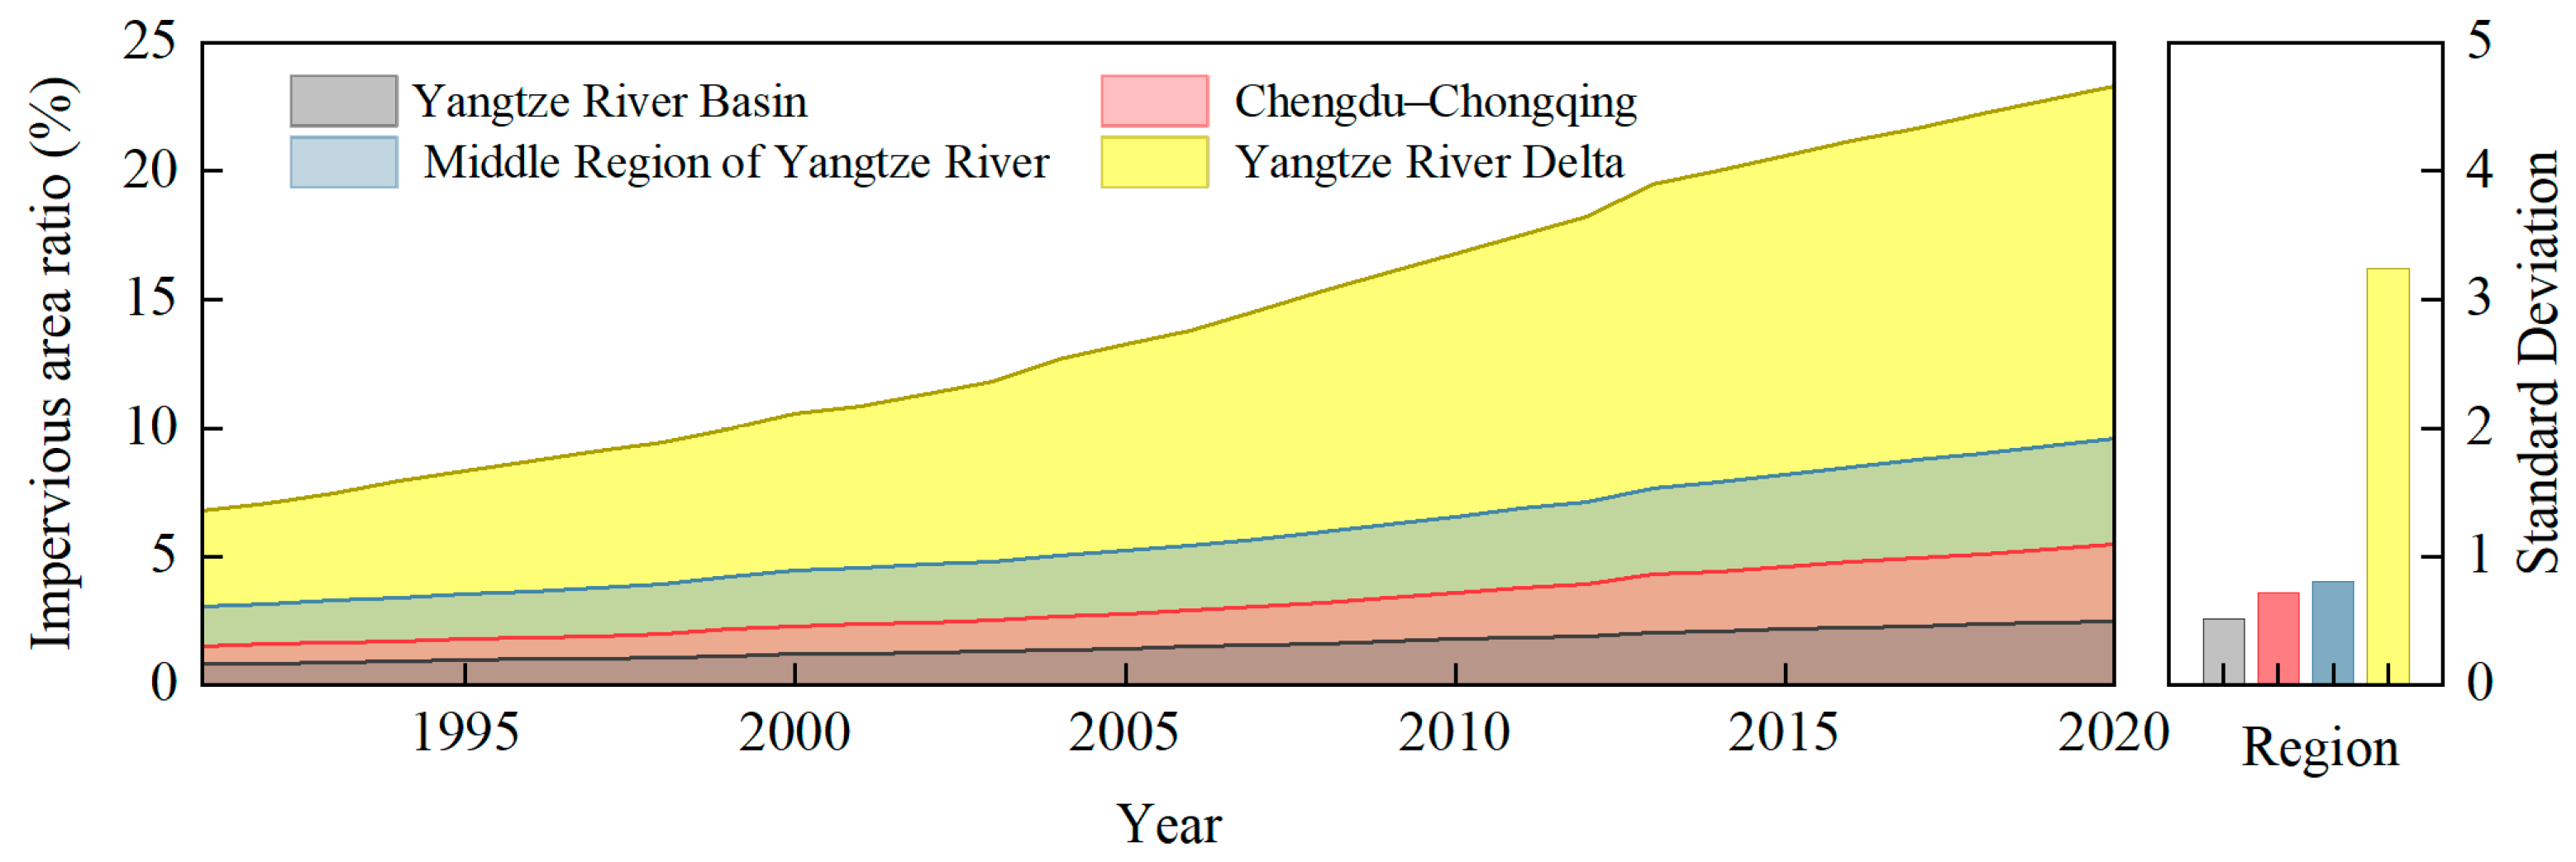
We examined changes in imperviousness throughout the urbanization process. Imperviousness is a critical indicator reflecting the extent of land covered by buildings, roads, and other infrastructure. Impervious surfaces typically prevent rainwater from infiltrating the soil, which increase surface runoff and, consequently, the risk of flooding.
3. Results
3.1. Validation Results and Urban Imperviousness Trends
3.2. Precipitation Detection Results
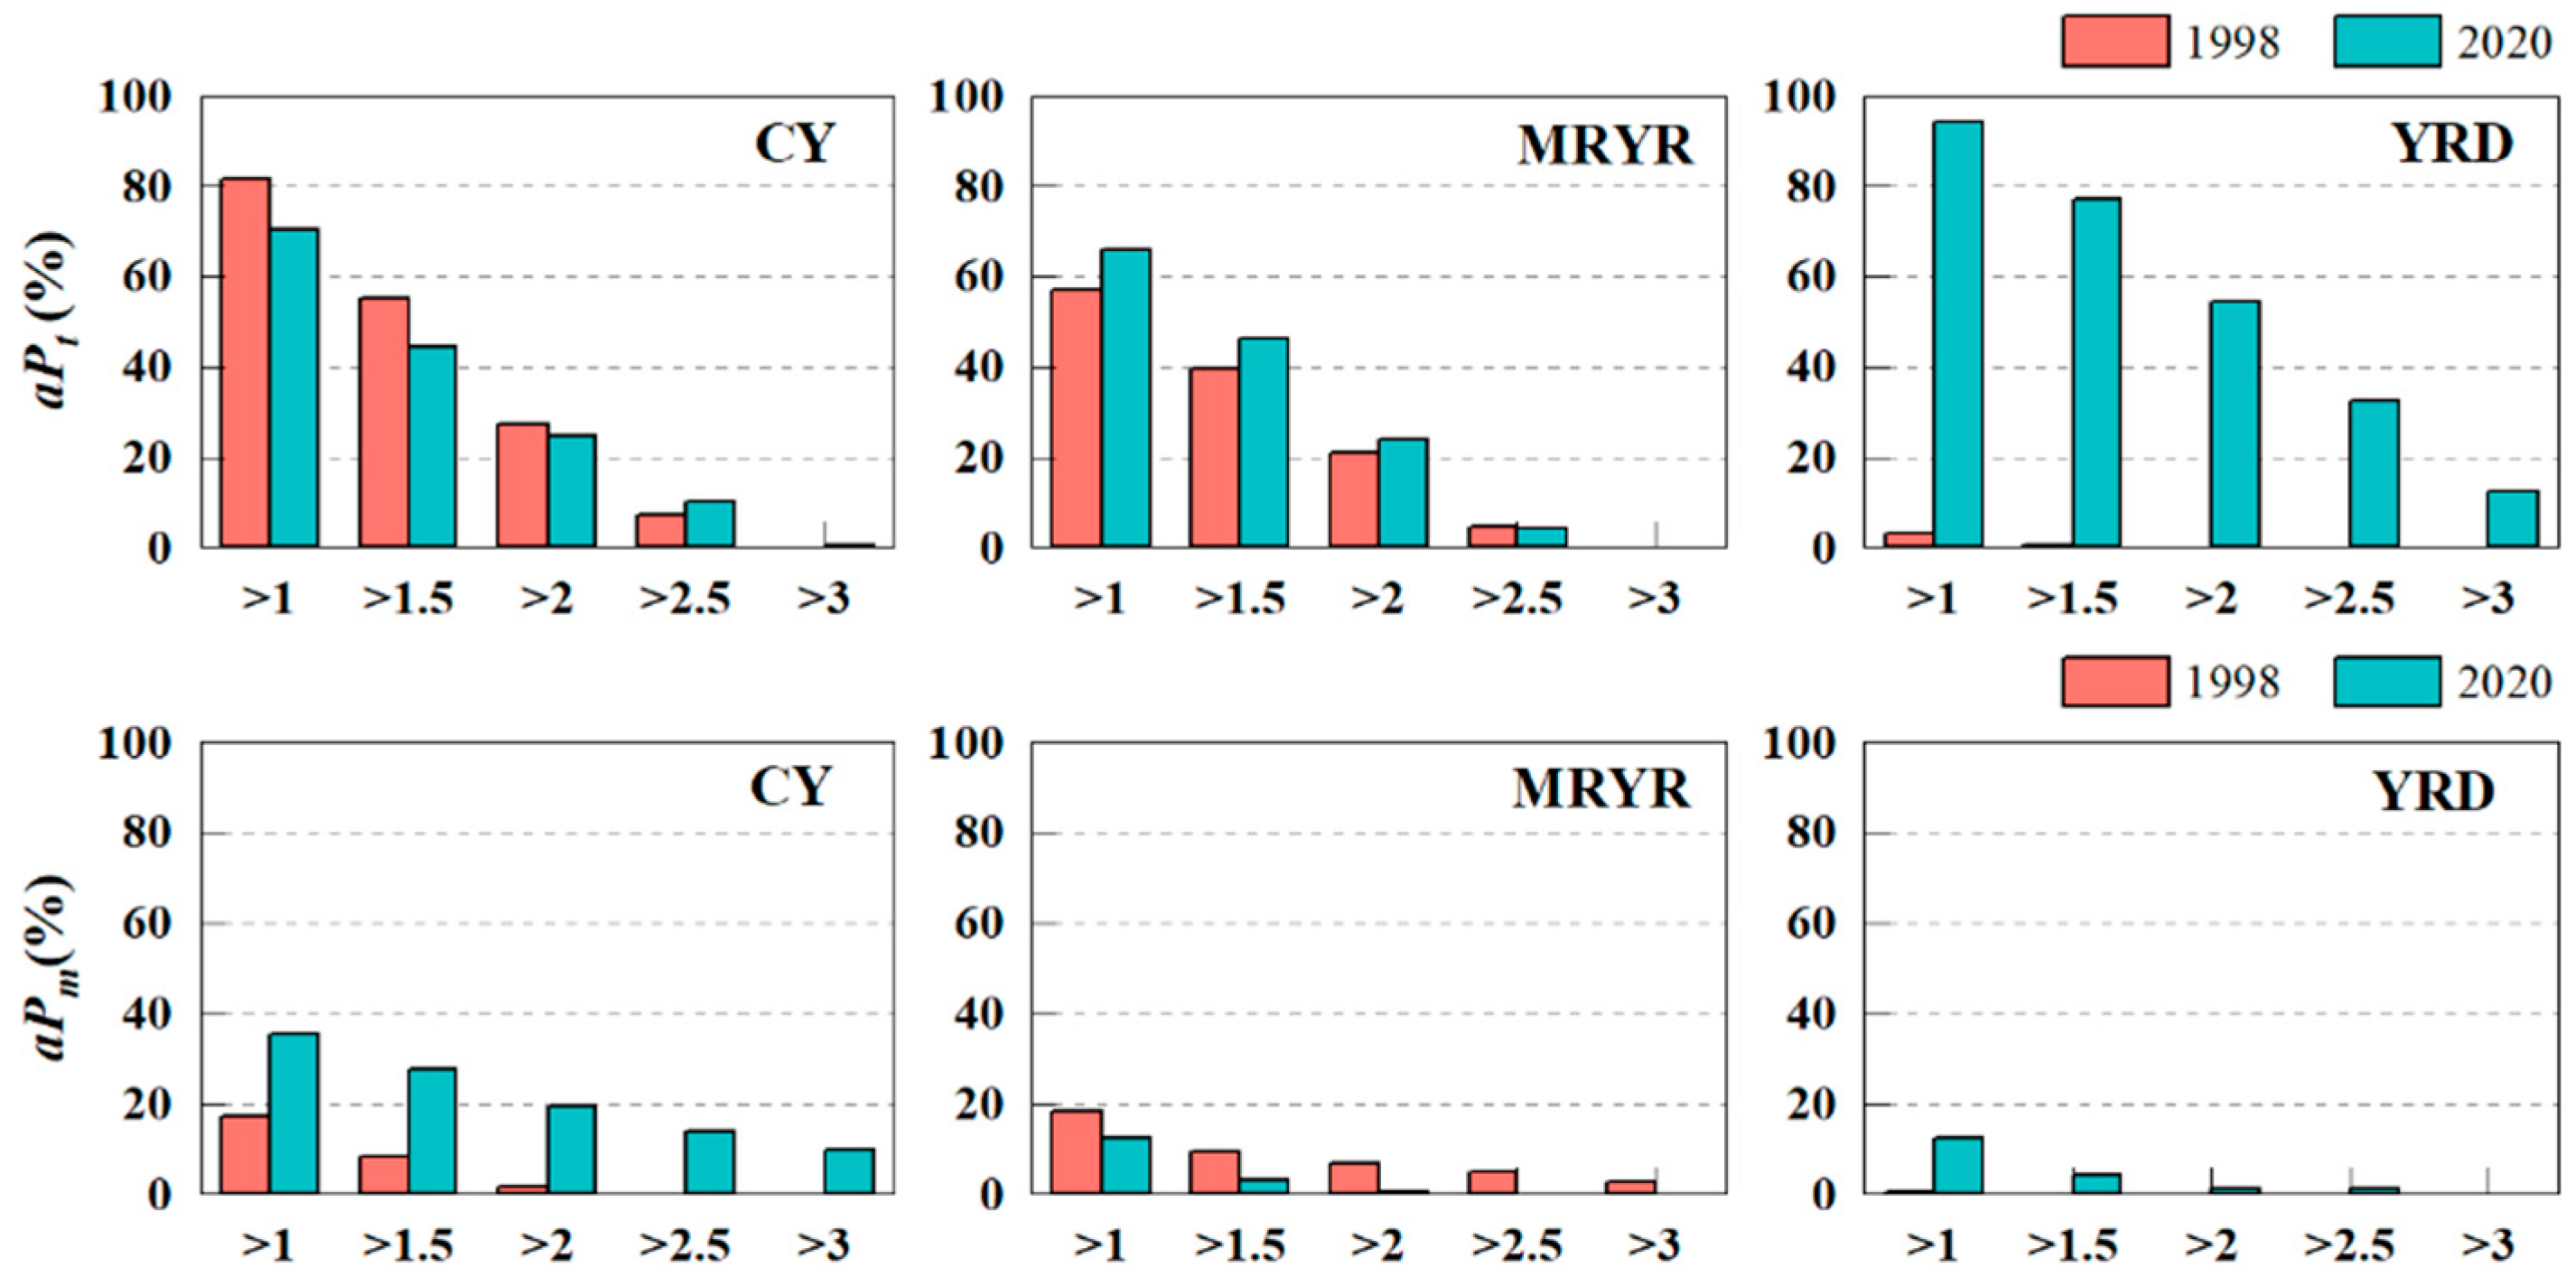
From the analysis of precipitation from 1991 to 2020, for the three major urban agglomerations in the Yangtze River Basin, significant differences were noted among the three major urban agglomerations during the major basin-wide floods of 1998 and 2020.
3.3. Flood Detection and Risk Level Assessment
From the analysis of precipitation from 1991 to 2020, for the three major urban agglomerations in the Yangtze River Basin, significant differences were noted among the three major urban agglomerations during the major basin-wide floods of 1998 and 2020.
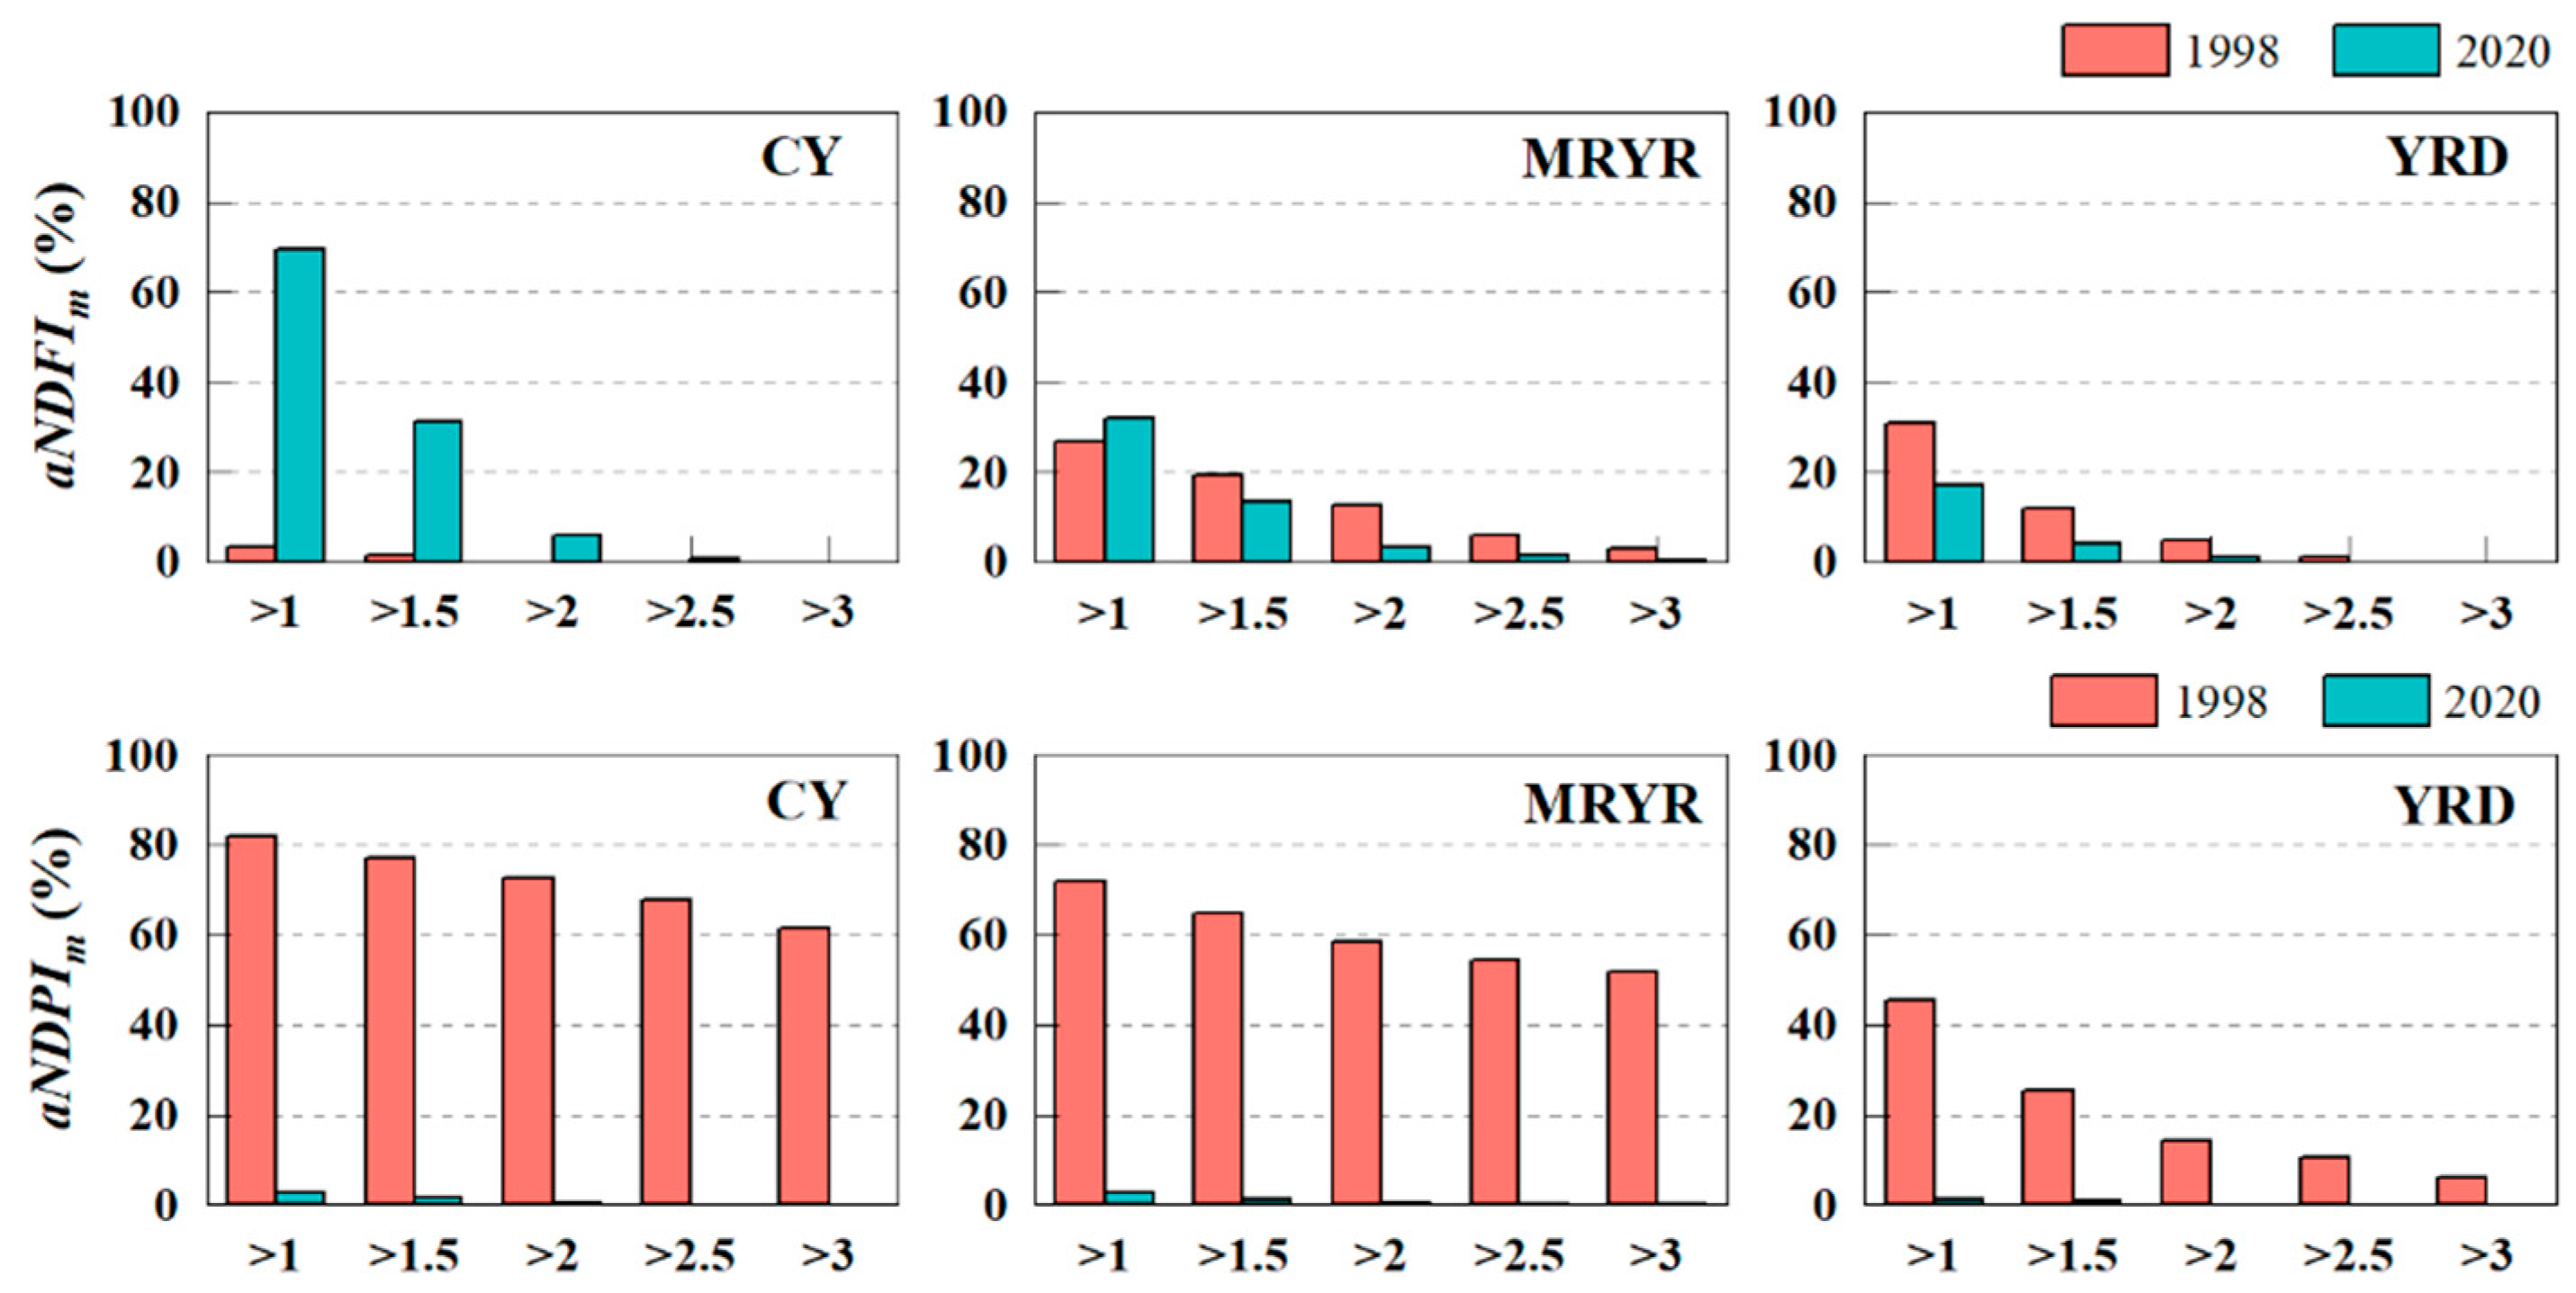
During the flood season of 2020, there was only one high-risk flood anomaly pixel with an aNDFIm greater than 3. It was located in the MRYR. The CY and MRYR mainly had medium-risk flood anomaly pixels with an aNDFIm greater than 2. They totaled 16 and 18, respectively. The YRD had only two such pixels. None of the three urban agglomerations had high-risk flood anomaly pixels with an aNDPIm greater than 5. There was a total of three medium-risk flood anomaly pixels greater than 2. One was in the CY and two were in the MRYR. Overall, the high-risk flood areas in 2020 were primarily in the CY and MRYR.
In contrast, the CY and YRD had fewer high-risk flood pixels in 1998. This was especially true under the NDFI indicator, where almost no high-risk areas were identified. However, the number of high-risk flood pixels under the NDPI indicator for the CY suggests that this area also faced a certain level of flood risk.
As of 2020, only one high-risk flood pixel was identified in the MRYR under the NDFI. This shows that the flood risk in this area had decreased compared to 1998. Neither the CY nor the YRD had high-risk flood pixels under either the NDFI or NDPI. This indicates lower flood risks in these areas in 2020.
3.4. Flood and Precipitation Analysis
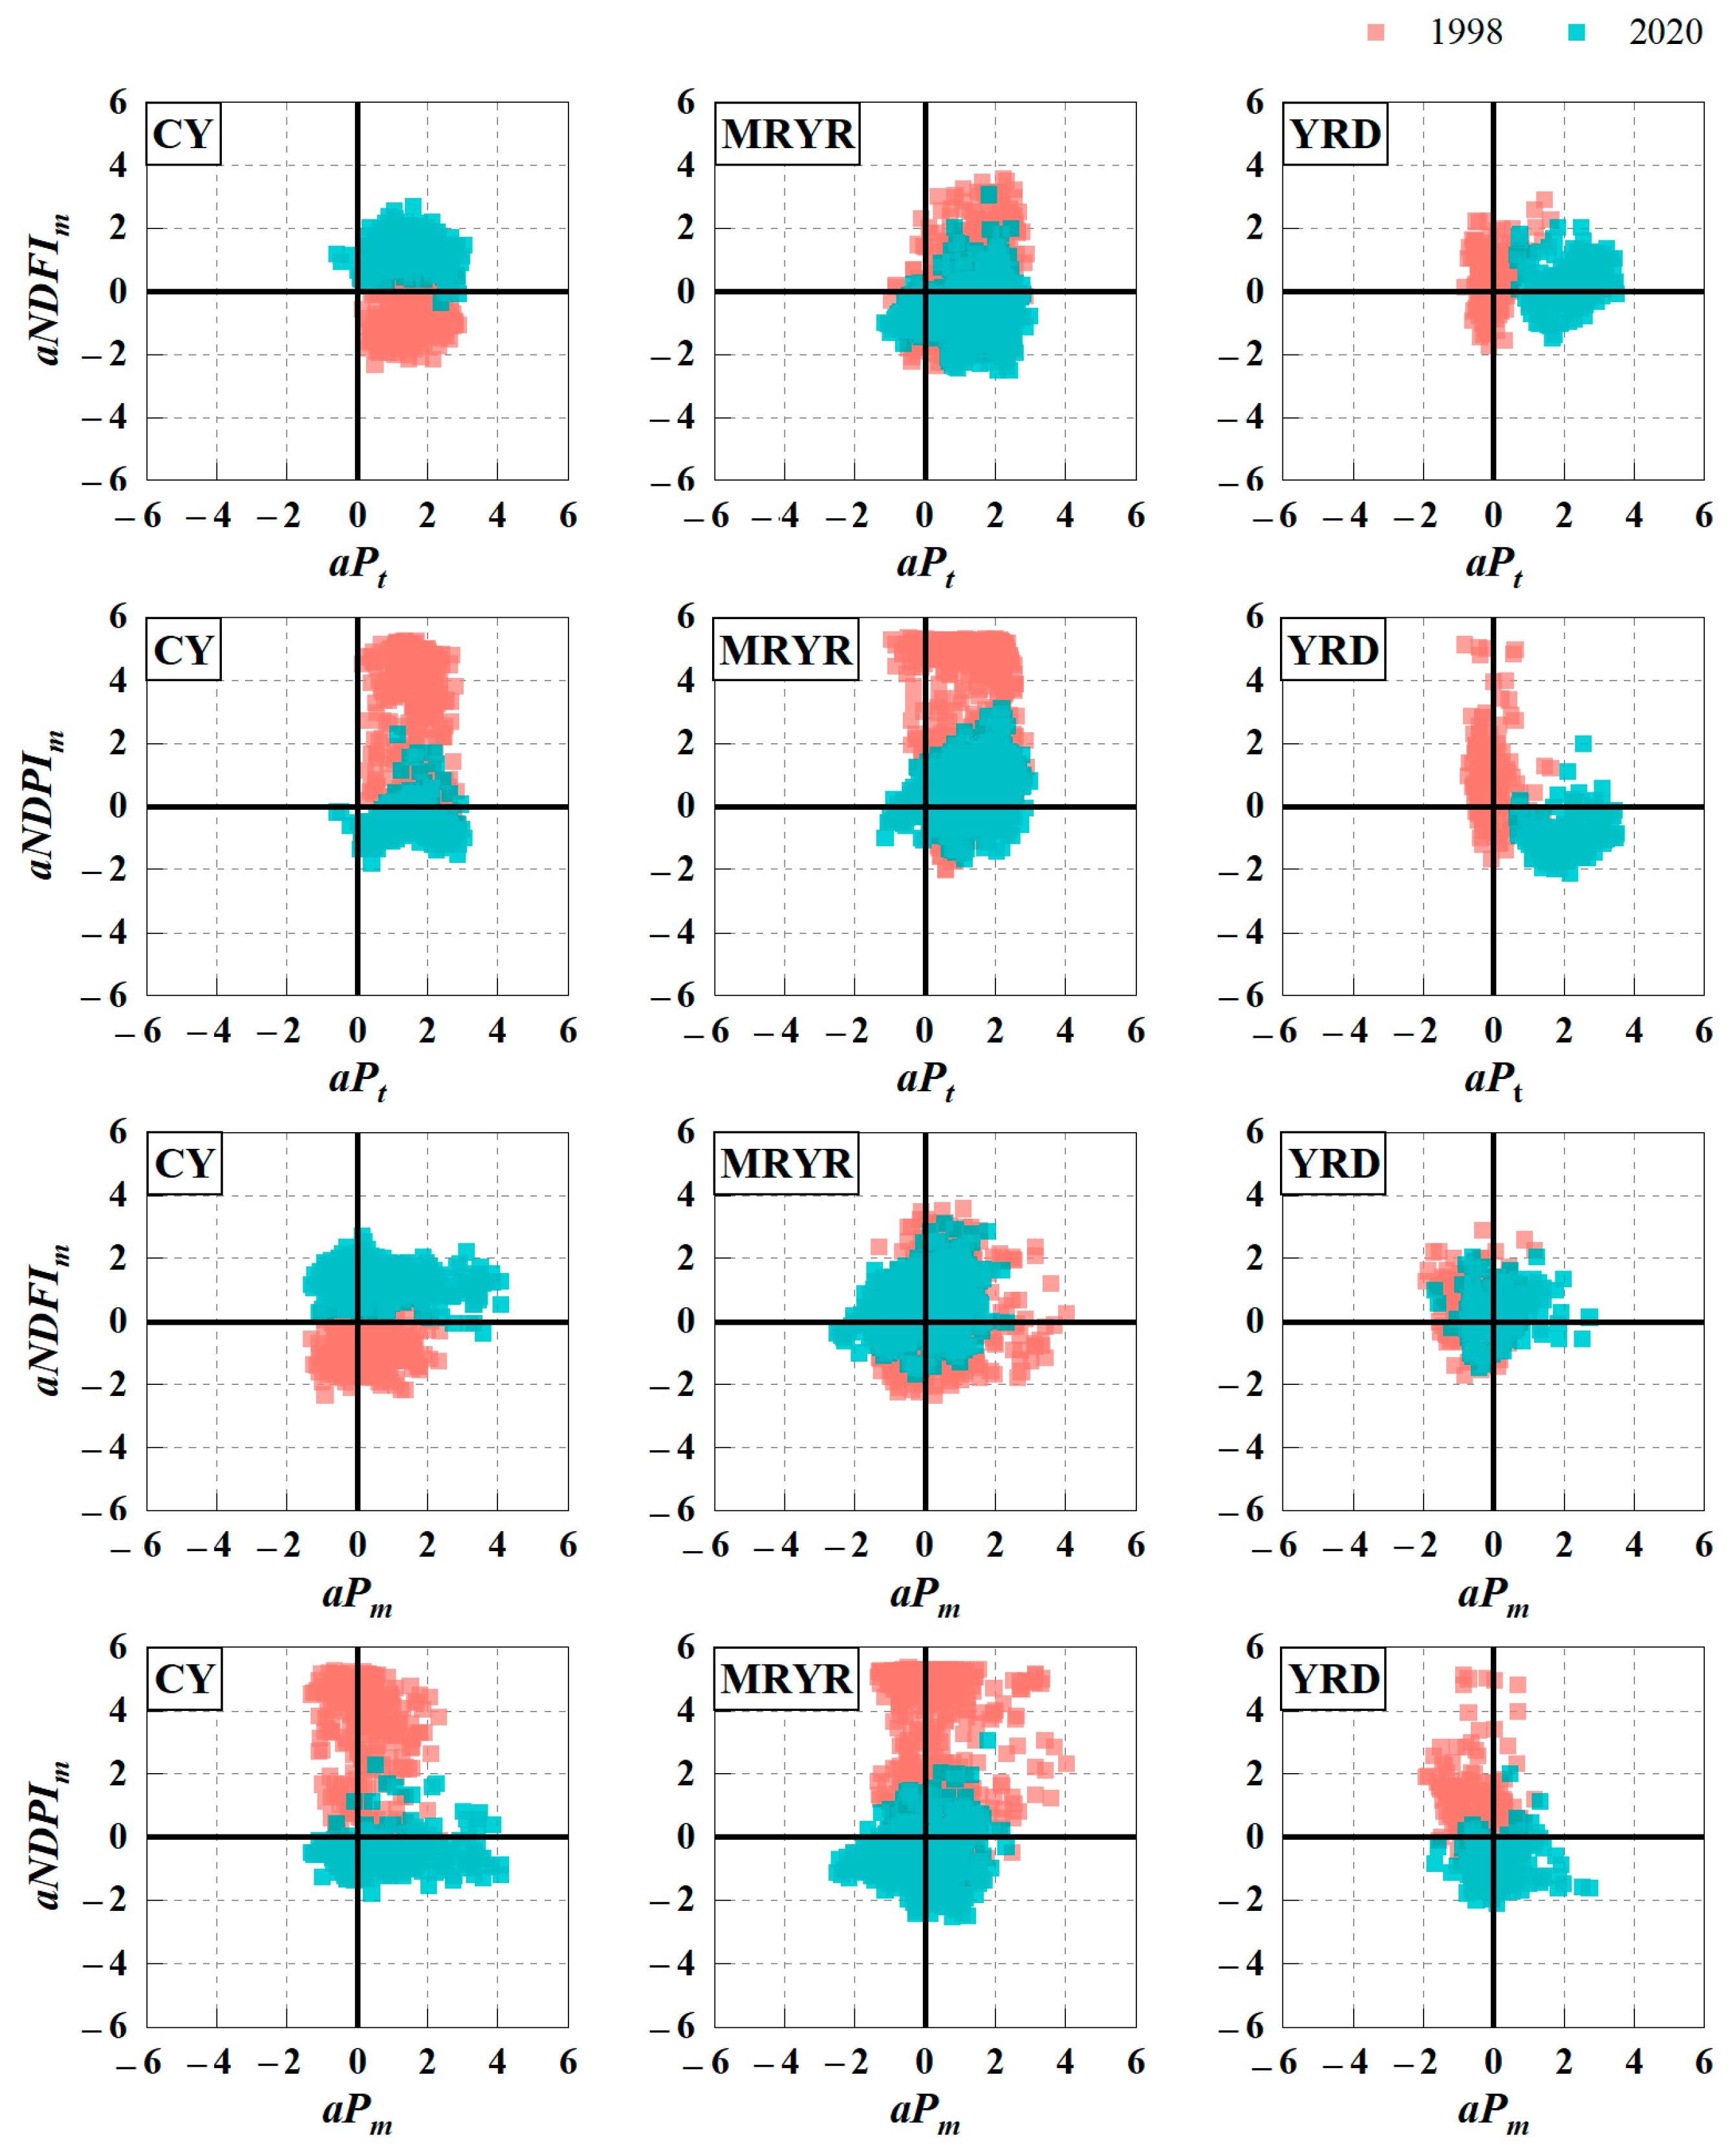
In the CY, aPt was similar between 1998 and 2020, but maximum precipitation (aPm) in 2020 was higher, indicating more extreme rainfall days. Flood indices (aNDFIm) were higher in 2020, aligning with the precipitation anomaly. However, aNDPIm was higher in 1998, possibly due to the influence of stepped reservoir groups built in the CY by 2020, which mitigated some flooding effects. The NDPI detected these impacts, demonstrating its sensitivity.
In the MRYR, aPt was nearly the same in both years, but aPm was higher in 1998. Both flood indices were higher in 1998 than in 2020, reflecting the severity of the 1998 flood. In the YRD, both aPt and aPm were significantly lower in 1998 compared to 2020. However, the flood indices were higher in 1998, suggesting that despite heavier rainfall in 2020, improved flood response capabilities reduced the impact.
3.5. Imperviousness and Flood Relationship
From 1998 to 2020, most cities experienced a significant increase in imperviousness, reflecting rapid urbanization in these areas. The main drivers of increased impervious surfaces include urban expansion, infrastructure development, and population growth. However, the growth rate of imperviousness was not uniform across regions. Economic hubs, such as those in the YRD, saw a more rapid increase of approximately 10% in imperviousness over the past 30 years. In contrast, urban agglomerations with lower industrialization levels, such as the CY and the MRYR, showed slower growth rates (around 2.25% and 2.63%, respectively).
4. Discussion
This study used SSM/I remote sensing data, CHIRPS precipitation data, and land use data from 1991 to 2020. It analyzed the flood characteristics of three major urban agglomerations in the Yangtze River Basin. This research revealed significant differences among the urban agglomerations. These differences were in terms of flood disaster characteristics, risk levels, and the impact of changes in imperviousness during the urbanization process on flood disasters.
4.1. Precipitation and Flood Characteristics in Typical Years
4.2. Spatio-Temporal Characteristics of Flood Risks
Spatial distribution analyses of flood events in 1998 and 2020 revealed clear shifts in flood risk hotspots within the Yangtze River Basin. In 1998, flood risks were more concentrated in the MRYR and YRD regions, with significant precipitation anomalies in the MRYR driving widespread flooding. These flood-prone areas were closely aligned with regions experiencing the highest precipitation anomalies. The relatively flat terrain and extensive river networks in the MRYR may have amplified flood risks during heavy rainfall events, as water had fewer natural outlets.
4.3. Potential Relationships Between Flood Risk and Urban Agglomeration Development
The correlation analysis between imperviousness rates and flood indices across the three urban agglomerations revealed varying relationships between urban development and flood risks. In the CY region, a negative correlation between imperviousness and flood indices (average correlation coefficient of −0.41) suggests that factors such as topography and flood control infrastructure have mitigated the risk of surface water accumulation, despite increased urbanization. This can also be attributed to recent flood management projects, such as stepped reservoir systems, which improve the region’s capacity to handle extreme rainfall.
For the CY, rapid urbanization and favorable topographical drainage call for enhancing green infrastructure like rain gardens and permeable pavements to increase infiltration and reduce flood risks. Improving existing reservoirs and river channels through intelligent management systems will also help mitigate extreme rainfall impacts. For the MRYR, due to its flat terrain and susceptibility to flooding, strengthening regional flood early warning and dispatch systems is essential. Upgrading aging drainage infrastructure and implementing comprehensive river network management will help reduce urban waterlogging risks. For the YRD, expanding green infrastructure and leveraging advanced digital flood management systems for real-time monitoring will enhance the region’s resilience to extreme rainfall and minimize potential economic losses.
5. Conclusions
This study applied remote sensing technology, combining precipitation, land use data, NDFI, and NDPI to assess the flood risk characteristics and spatial distribution across three major urban agglomerations in the Yangtze River Basin.
The analysis of flood events in 1998 and 2020 revealed significant differences in flood risks across the three regions. In 1998, the MRYR suffered the highest flood risk, primarily due to intense rainfall and insufficient flood control infrastructure. In contrast, the CY and YRD regions had relatively lower risks. However, by 2020, flood risk in the MRYR had significantly decreased, due to improvements in urban planning and flood management. Meanwhile, in the CY region, rapid urbanization coupled with increased precipitation led to a rise in flood risk.
The relationship between impervious surface area and flood risk proved to be complex across the regions. In the CY region, the negative correlation (−0.41) indicated that topography and flood control infrastructure played a dominant role in mitigating floods. In contrast, the MRYR showed a slight positive correlation (0.12), suggesting that urban expansion in this area increased surface runoff and exacerbated flood risks. In the YRD, advanced flood control systems effectively reduced flood risks, as seen in the weaker correlation (−0.18). These findings emphasize the need for region-specific flood risk management strategies in the Yangtze River Basin, such as enhancing urban permeability, improving drainage systems, and investing in green infrastructure.
In conclusion, this study demonstrated the utility of remote sensing technology in monitoring and analyzing flood risks, providing a multidimensional perspective for flood risk assessment in urban agglomerations of the Yangtze River Basin. It confirmed the importance of adopting an integrated approach to urban planning and water resource management. The results can offer technical support for decision-makers to formulate more precise and effective flood management strategies. However, this study only considered impervious surface area and meteorological factors when exploring urban flood risks within the basin and did not delve into other hydrological factors, such as soil permeability and groundwater, which may also have influenced flood dynamics. In future research, these factors will be considered to enhance the reliability of flood risk assessment methods.
Author Contributions
Conceptualization, H.L., D.Y. and H.I.; methodology, H.L. and D.Y.; software, H.L. and H.I.; validation, H.L., D.Y. and H.C.; formal analysis, H.L. and H.I.; resources, H.I.; data curation, H.C. and D.Y.; writing—original draft preparation, H.L., Y.W. and Z.Z.; writing—review and editing, D.Y., H.I. and N.A.C.; visualization, H.L., Y.W. and Y.Z.; supervision, D.Y. and H.I.; project administration, D.Y., H.I. and Y.Z.; funding acquisition, D.Y., Y.W. and Y.Z. All authors have read and agreed to the published version of the manuscript.
Funding
This research was funded by the National Key Research and Development Program of China (Grant Nos. 2023YFC3206604-02, 2023YFC3006605, 2023YFC3206303), National Natural Science Foundation of China (Grant No. U2340208), Major Science and Technology Projects of the Ministry of Water Resources (Grant No. SKS-2022014), Pioneering Research Initiated by the Next Generation—the Japan Science and Technology Agency (Grant No. JPMJSP2133), and the National Natural Science Foundation of China (Grant Nos. 52409017, 52379006). This paper was also supported by the Shuimu Tsinghua Scholar Program.
Data Availability Statement
The data presented in this study are available on request from the corresponding author.
Conflicts of Interest
The authors declare no conflicts of interest.
Appendix A
Table A1.
List of abbreviations for urban agglomeration names and city names in the Yangtze River Basin.
Table A1.
List of abbreviations for urban agglomeration names and city names in the Yangtze River Basin.
| CY | MRYR | YRD | |||
|---|---|---|---|---|---|
| A1 | Chongqing City | B1 | Ezhou City | C1 | Jiaxing City |
| A2 | Chengdu City | B2 | Huanggang City | C2 | Huzhou City |
| A3 | Zigong City | B3 | Huangshi City | C3 | Shanghai City |
| A4 | Luzhou City | B4 | Jingmen City | C4 | Wuxi City |
| A5 | Deyang City | B5 | Jingzhou City | C5 | Nanjing City |
| A6 | Mianyang City | B6 | Qianjiang City | C6 | Taizhou City |
| A7 | Suining City | B7 | Tianmen City | C7 | Suzhou City |
| A8 | Neijiang City | B8 | Wuhan City | C8 | Nantong City |
| A9 | Leshan City | B9 | Xiantao City | C9 | Changzhou City |
| A10 | Nanchong City | B10 | Xianning City | C10 | Zhenjiang City |
| A11 | Meishan City | B11 | Xiangyang City | C11 | Yangzhou City |
| A12 | Yibin City | B12 | Xiaogan City | C12 | Wuhu City |
| A13 | GuangAn City | B13 | Yichang City | C13 | Ma’anshan City |
| A14 | Dazhou City | B14 | Changde City | C14 | Xuancheng City |
| A15 | Ya’an City | B15 | Hengyang City | C15 | Chizhou City |
| A16 | Ziyang City | B16 | Loudi City | C16 | Anqin City |
| B17 | Xiangtan City | C17 | Tongling City | ||
| B18 | Yiyang City | C18 | Chuzhou City | ||
| B19 | Yueyang City | C19 | HeFei City | ||
| B20 | Changsha City | ||||
| B21 | Zhuzhou City | ||||
| B22 | Fuzhou City | ||||
| B23 | Ji’an City | ||||
| B24 | Jingdezhen City | ||||
| B25 | Jiujiang City | ||||
| B26 | Nanchang City | ||||
| B27 | Pingxiang City | ||||
| B28 | Shangrao City | ||||
| B29 | Xinyu City | ||||
| B30 | Yichun City | ||||
| B31 | Yingtan City | ||||
References
- Rentschler, J.; Avner, P.; Marconcini, M.; Su, R.; Strano, E.; Vousdoukas, M.; Hallegatte, S. Global evidence of rapid urban growth in flood zones since 1985. Nature 2023, 622, 87–92. [Google Scholar] [CrossRef] [PubMed]
- Jia, H.; Chen, F.; Pan, D.; Du, E.; Wang, L.; Wang, N.; Yang, A. Flood risk management in the Yangtze River basin —Comparison of 1998 and 2020 events. Int. J. Disaster Risk Reduct. 2022, 68, 102724. [Google Scholar] [CrossRef]
- Ward, P.J.; Jongman, B.; Aerts, J.C.J.H.; Bates, P.D.; Botzen, W.J.W.; Diaz Loaiza, A.; Hallegatte, S.; Kind, J.M.; Kwadijk, J.; Scussolini, P.; et al. A global framework for future costs and benefits of river-flood protection in urban areas. Nat. Clim. Chang. 2017, 7, 642–646. [Google Scholar] [CrossRef]
- Zhang, Y.; Chen, Z.; Zheng, X.; Chen, N.; Wang, Y. Extracting the location of flooding events in urban systems and analyzing the semantic risk using social sensing data. J. Hydrol. 2021, 603, 127053. [Google Scholar] [CrossRef]
- Li, Y.; Martinis, S.; Wieland, M. Urban flood mapping with an active self-learning convolutional neural network based on TerraSAR-X intensity and interferometric coherence. ISPRS J. Photogramm. Remote Sens. 2019, 152, 178–191. [Google Scholar] [CrossRef]
- Lin, L.; Di, L.; Yu, E.G.; Kang, L.; Shrestha, R.; Rahman, M.S.; Tang, J.; Deng, M.; Sun, Z.; Zhang, C.; et al. A review of remote sensing in flood assessment. In Proceedings of the 2016 Fifth International Conference on Agro-Geoinformatics (Agro-Geoinformatics), Tianjin, China, 18–20 July 2016; pp. 1–4. [Google Scholar] [CrossRef]
- Jiang, R.; Lu, H.; Yang, K.; Chen, D.; Zhou, J.; Yamazaki, D.; Pan, M.; Li, W.; Xu, N.; Yang, Y.; et al. Substantial increase in future fluvial flood risk projected in China’s major urban agglomerations. Commun. Earth Environ. 2023, 4, 389. [Google Scholar] [CrossRef]
- Liu, H.; Zou, L.; Xia, J.; Chen, T.; Wang, F. Impact assessment of climate change and urbanization on the nonstationarity of extreme precipitation: A case study in an urban agglomeration in the middle reaches of the Yangtze river. Sustain. Cities Soc. 2022, 85, 104038. [Google Scholar] [CrossRef]
- Gu, C.; Hu, L.; Zhang, X.; Wang, X.; Guo, J. Climate change and urbanization in the Yangtze River Delta. Habitat Int. 2011, 35, 544–552. [Google Scholar] [CrossRef]
- Huang, S.; Gan, Y.; Zhang, X.; Chen, N.; Wang, C.; Gu, X.; Ma, J.; Niyogi, D. Urbanization Amplified Asymmetrical Changes of Rainfall and Exacerbated Drought: Analysis Over Five Urban Agglomerations in the Yangtze River Basin, China. Earth’s Future 2023, 11, e2022EF003117. [Google Scholar] [CrossRef]
- Qi, W.; Feng, L.; Yang, H.; Liu, J.; Zheng, Y.; Shi, H.; Wang, L.; Chen, D. Economic growth dominates rising potential flood risk in the Yangtze River and benefits of raising dikes from 1991 to 2015. Environ. Res. Lett. 2022, 17, 034046. [Google Scholar] [CrossRef]
- Liu, W.; Fujii, K.; Maruyama, Y.; Yamazaki, F. Inundation Assessment of the 2019 Typhoon Hagibis in Japan Using Multi-Temporal Sentinel-1 Intensity Images. Remote Sens. 2021, 13, 639. [Google Scholar] [CrossRef]
- Tian, P.; Wu, H.; Yang, T.; Jiang, F.; Zhang, W.; Zhu, Z.; Yue, Q.; Liu, M.; Xu, X. Evaluation of urban water ecological civilization: A case study of three urban agglomerations in the Yangtze River Economic Belt, China. Ecol. Indic. 2021, 123, 107351. [Google Scholar] [CrossRef]
- Zuo, J.; Jiang, W.; Li, Q.; Du, Y. Remote sensing dynamic monitoring of the flood season area of Poyang Lake over the past two decades. Nat. Hazards Res. 2024, 4, 8–19. [Google Scholar] [CrossRef]
- Sajjad, A.; Lu, J.; Chen, X.; Chisenga, C.; Mazhar, N. Rapid assessment of riverine flood inundation in Chenab floodplain using remote sensing techniques. Geoenvironmental Disasters 2023, 10, 9. [Google Scholar] [CrossRef]
- Temimi, M.; Leconte, R.; Brissette, F.; Chaouch, N. Flood and soil wetness monitoring over the Mackenzie River Basin using AMSR-E 37GHz brightness temperature. J. Hydrol. 2007, 333, 317–328. [Google Scholar] [CrossRef]
- Lammers, R.; Li, A.; Nag, S.; Ravindra, V. Prediction models for urban flood evolution for satellite remote sensing. J. Hydrol. 2021, 603, 127175. [Google Scholar] [CrossRef]
- Wei, Z.; Zhe, C.; Pingping, L.; Zeming, T.; Yuzhu, Z.; Maochuan, H.; Bin, H. Urban Flood-Related Remote Sensing: Research Trends, Gaps and Opportunities. Remote Sens. 2022, 14, 5505. [Google Scholar] [CrossRef]
- Pellizzeri, T.M.; Gamba, P.; Lombardo, P.; Acqua, F.D.; Tortora, A. Flood monitoring in urban areas: Statistical vs. neurofuzzy approach. In Proceedings of the 2003 2nd GRSS/ISPRS Joint Workshop on Remote Sensing and Data Fusion over Urban Areas, Berlin, Germany, 22–23 May 2003; pp. 211–215. [Google Scholar] [CrossRef]
- Shastry, A.; Carter, E.; Coltin, B.; Sleeter, R.; McMichael, S.; Eggleston, J. Mapping floods from remote sensing data and quantifying the effects of surface obstruction by clouds and vegetation. Remote Sens. Environ. 2023, 291, 113556. [Google Scholar] [CrossRef]
- Lu, D.; Li, L.; Li, G.; Fan, P.; Ouyang, Z.; Moran, E. Examining Spatial Patterns of Urban Distribution and Impacts of Physical Conditions on Urbanization in Coastal and Inland Metropoles. Remote Sens. 2018, 10, 1101. [Google Scholar] [CrossRef]
- Wang, Y.; Li, C.; Liu, M.; Cui, Q.; Wang, H.; Lv, J.; Li, B.; Xiong, Z.; Hu, Y. Spatial characteristics and driving factors of urban flooding in Chinese megacities. J. Hydrol. 2022, 613, 128464. [Google Scholar] [CrossRef]
- Lu, H.; Zhang, C.; Jiao, L.; Wei, Y.; Zhang, Y. Analysis on the spatial-temporal evolution of urban agglomeration resilience: A case study in Chengdu-Chongqing Urban Agglomeration, China. Int. J. Disaster Risk Reduct. 2022, 79, 103167. [Google Scholar] [CrossRef]
- Lee, C.-C.; Yan, J.; Li, T. Ecological resilience of city clusters in the middle reaches of Yangtze river. J. Clean. Prod. 2024, 443, 141082. [Google Scholar] [CrossRef]
- Dong, L.; Longwu, L.; Zhenbo, W.; Liangkan, C.; Faming, Z. Exploration of coupling effects in the Economy–Society–Environment system in urban areas: Case study of the Yangtze River Delta Urban Agglomeration. Ecol. Indic. 2021, 128, 107858. [Google Scholar] [CrossRef]
- Yu, J.; Zou, L.; Xia, J.; Zhang, Y.; Zuo, L.; Li, X. Investigating the spatial–temporal changes of flood events across the Yangtze River Basin, China: Identification, spatial heterogeneity, and dominant impact factors. J. Hydrol. 2023, 621, 129503. [Google Scholar] [CrossRef]
- Funk, C.C.; Peterson, P.J.; Landsfeld, M.F.; Pedreros, D.H.; Verdin, J.P.; Rowland, J.D.; Romero, B.E.; Husak, G.J.; Michaelsen, J.C.; Verdin, A.P. A Quasi-Global Precipitation Time Series for Drought Monitoring; No. 832; US Geological Survey: Reston, VA, USA, 2014; p. 12. [Google Scholar]
- Kubota, T.; Shige, S.; Hashizume, H.; Aonashi, K.; Takahashi, N.; Seto, S.; Hirose, M.; Takayabu, Y.N.; Ushio, T.; Nakagawa, K.; et al. Global Precipitation Map Using Satellite-Borne Microwave Radiometers by the GSMaP Project: Production and Validation. IEEE Trans. Geosci. Remote Sens. 2007, 45, 2259–2275. [Google Scholar] [CrossRef]
- Yang, J.; Huang, X. The 30 m annual land cover dataset and its dynamics in China from 1990 to 2019. Earth Syst. Sci. Data 2021, 13, 3907–3925. [Google Scholar] [CrossRef]
- Wang, W.; Lin, H.; Chen, N.; Chen, Z. Evaluation of multi-source precipitation products over the Yangtze River Basin. Atmos. Res. 2021, 249, 105287. [Google Scholar] [CrossRef]
- Pan, C.; Zhao, J.; Chen, H.; Kang, Z.; Chen, S.; Jin, X. The Characteristics of the Yangtze Flooding During 1998 and 2020 Based on Atmospheric Water Tracing. Geophys. Res. Lett. 2023, 50, e2023GL104195. [Google Scholar] [CrossRef]
- Zhang, H.; Dou, Y.; Ye, L.; Zhang, C.; Yao, H.; Bao, Z.; Tang, Z.; Wang, Y.; Huang, Y.; Zhu, S.; et al. Realizing the full reservoir operation potential during the 2020 Yangtze river floods. Sci. Rep. 2022, 12, 2822. [Google Scholar] [CrossRef]
Location map of the three major urban agglomerations in the Yangtze River Basin (IA indicates impermeable area; Abbreviations for urban agglomerations names and city names can be found in Appendix A).
Location map of the three major urban agglomerations in the Yangtze River Basin (IA indicates impermeable area; Abbreviations for urban agglomerations names and city names can be found in Appendix A).
Validation of CHIRPS precipitation data in the Yangtze River Basin.
Figure 2.
Validation of CHIRPS precipitation data in the Yangtze River Basin.
Imperviousness of the three major urban agglomerations in the Yangtze River Basin.
Figure 3.
Imperviousness of the three major urban agglomerations in the Yangtze River Basin.
Precipitation detection in the three major urban agglomerations of the Yangtze River Basin.
Figure 4.
Precipitation detection in the three major urban agglomerations of the Yangtze River Basin.
Flood detection in the three major urban agglomerations of the Yangtze River Basin.
Figure 5.
Flood detection in the three major urban agglomerations of the Yangtze River Basin.
Flood and precipitation analysis of the three major urban agglomerations in the Yangtze River Basin.
Figure 6.
Flood and precipitation analysis of the three major urban agglomerations in the Yangtze River Basin.
Imperviousness and flood relationship in 1998 and 2020 for the three major urban agglomerations in the Yangtze River Basin.
Figure 7.
Imperviousness and flood relationship in 1998 and 2020 for the three major urban agglomerations in the Yangtze River Basin.
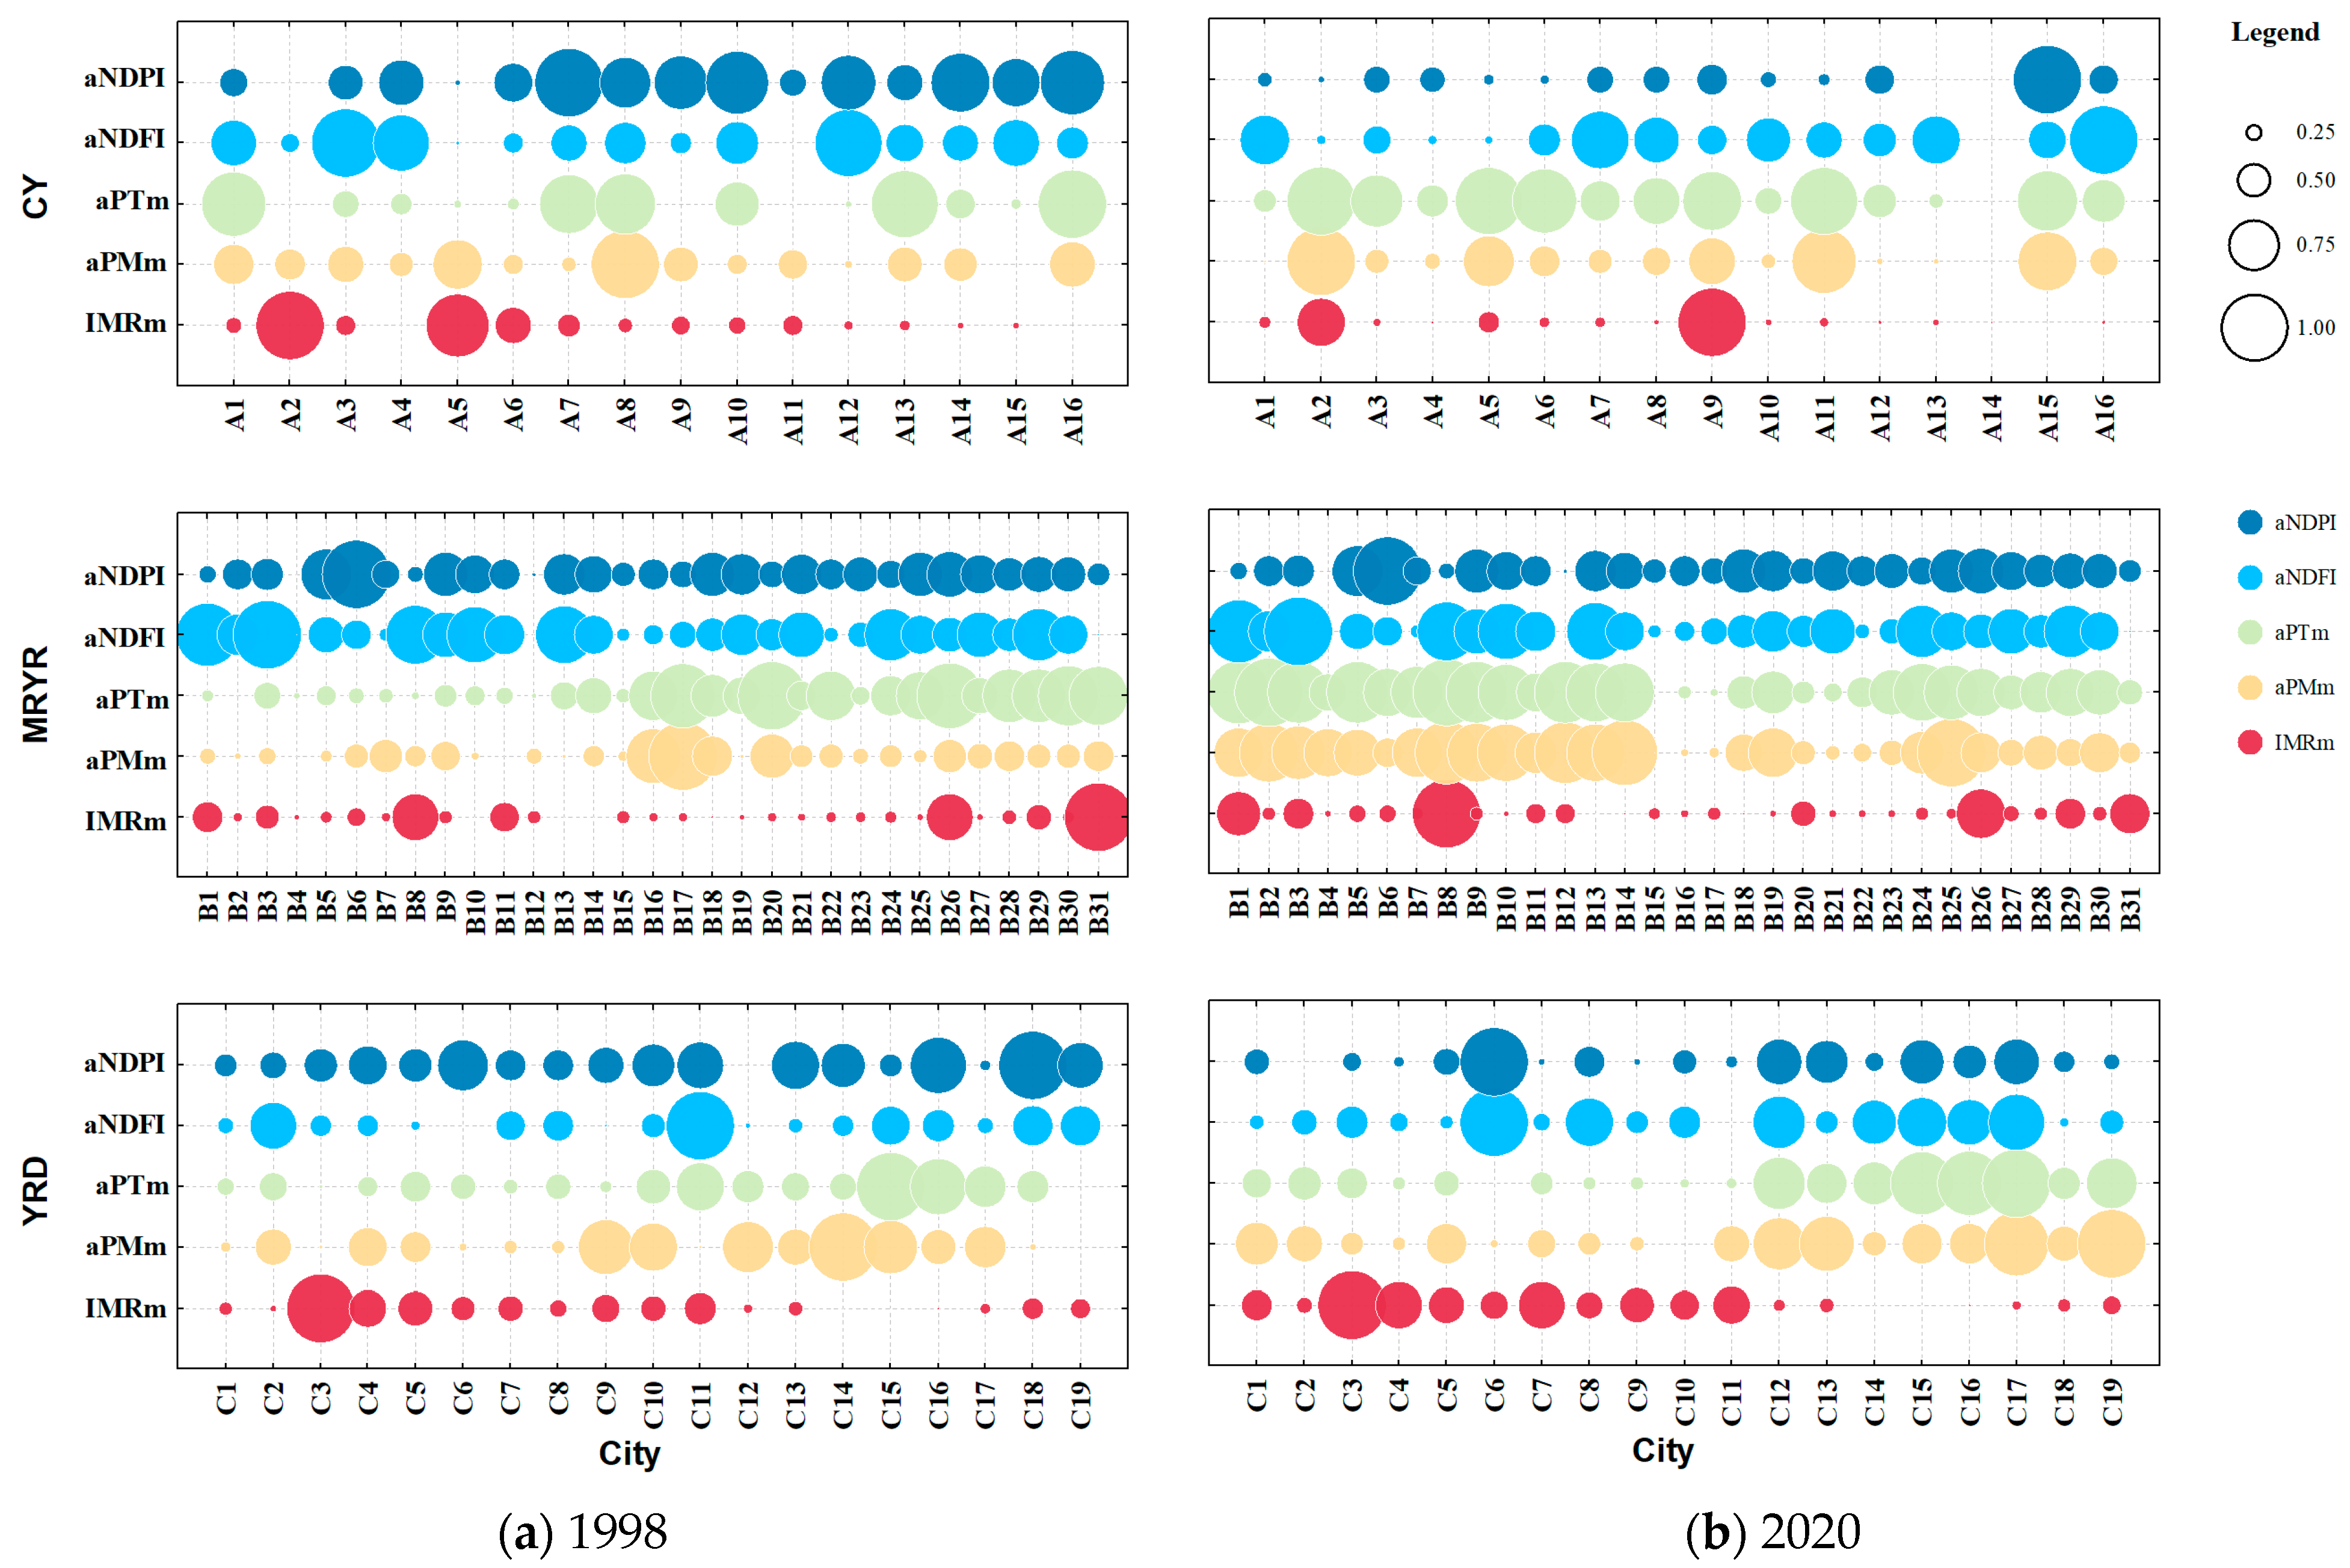
Table 1.
Flood risk classification based on aNDFIm and aNDPIm (measured in pixel count).
Table 1.
Flood risk classification based on aNDFIm and aNDPIm (measured in pixel count).
| Risk Level | aNDFIm (Pixel Count) | aNDPIm (Pixel Count) |
|---|---|---|
| High | [3, +) | [5, +) |
| Medium | [2, 3) | [2, 5) |
| Low | [0, 2) | [0, 2) |
Table 2.
Statistics of high-risk flood areas in the three major urban agglomerations of the Yangtze River Basin (measured in pixel count).
Table 2.
Statistics of high-risk flood areas in the three major urban agglomerations of the Yangtze River Basin (measured in pixel count).
| CY | MRYR | YRD | |
|---|---|---|---|
| aNDFI-1998 | 0 | 15 | 0 |
| aNDFI-2020 | 0 | 0 | 0 |
| aNDPI-1998 | 24 | 116 | 3 |
| aNDPI-2020 | 0 | 0 | 0 |
Table 3.
Correlation coefficients between imperviousness rates and flood indices for the three major urban agglomerations in the Yangtze River Basin.
Table 3.
Correlation coefficients between imperviousness rates and flood indices for the three major urban agglomerations in the Yangtze River Basin.
| Title 1 | CY | MRYR | YRD |
|---|---|---|---|
| The average correlation coefficient between impermeability and aNDFIm/aNDPIm | −0.41 | 0.12 | −0.18 |
| The average correlation coefficient between aPm, aPt and NDFIm/aNDPIm | 0.01 | 0.14 | 0.13 |
Disclaimer/Publisher’s Note: The statements, opinions and data contained in all publications are solely those of the individual author(s) and contributor(s) and not of MDPI and/or the editor(s). MDPI and/or the editor(s) disclaim responsibility for any injury to people or property resulting from any ideas, methods, instructions or products referred to in the content. |
Source link
Haichao Li www.mdpi.com

