1. Introduction
Many designs of industrial plants that are currently in use stem from designs from the 1960s–1970s, when large-scale reactors were the only way to realize large-scale production. For a wide range of reactions, large-scale reactors lead to suboptimal reaction configurations due to limitations in heat- or mass-transfer, causing significant energy usage during the production of the required product. An example is highly exothermic reactions, in which the reaction speed is kept low by diluting the reactants to prevent run-away reactions from occurring, causing significant energy consumption for separating the required product from the dilutant. Another example is the occurrence of unwanted side reactions due to inefficiencies in mixing. Such mixing inefficiencies are practically impossible to avoid in large-scale reactors. These side products also need to be separated from the product stream. Since separation processes account for 40–80% of all energy costs in the process industry, it is relevant to prevent or reduce these separation processes if possible.
Since the 1990s, a different approach to realizing large-scale production has emerged—process intensification. Instead of focusing on increasing the scale of the production, the focus is on increasing the speed and control over the reactions occurring. This can be explained in terms of improved mixing on a micro-scale. If mixing occurs at high shear, reactants (either liquid/liquid or liquid/gas) show on a micro-scale, good or at least improved mixing. This means that the actual concentration of molecules close enough to each other to react will be equal or close to the concentration expected based on the concentration in the bulk, which increases the overall reaction rate.
Currently, there is no list of which processes could benefit from which process-intensive reactor types and what the impact of this benefit would be on the total performance of a factory. A major barrier to creating this insight is that for many industrial processes, the conversion rate is determined in situations where the speed of reaction is severely limited by mass- and/or heat-transfer and, therefore, gives the false impression that a reaction is too slow to realize full-scale industrial production in the small size process intensification reactors. A specific HiGee reactor that is suited to overcome most mass- and heat-transfer limitations is a spinning-disc reactor.
There are models available to determine the reaction rates based on experiments using a spinning-disc reactor. However, these models either require specific knowledge and equipment or need to be tailor-fitted to the specific reactor they apply to. Therefore, the use of these models requires serious resources. While in the (pre-)feasibility phase of a reactor replacement, such resources are generally not available yet. Resources are only freed after a brief list of potential solutions is made. This means that, in general, process intensification options do not make it to the shortlist.
To tackle this problem at the source, we decided to develop a test to determine reaction rates in a rotor–stator spinning disc reactor using a generalized model that can be applied to all rotor–stator spinning disc reactors without additional fitting. This test allows for the determination of kinetic data for an industrial chemical reaction at a minimum limitation in mass- and heat-transfer, under conditions that can be reproduced at an industrial scale. The rotor–stator spinning disc reaction is a HiGee reactor that has excellent mass- and heat-transfer and is accessible to both educational institutions and industrial parties. In this way, we want to make it more feasible to show the potential of micro and mini reactors in full-scale industrial production processes in a low-budget way in order to raise the interest required to realize full-scale investigations for the optimum reactor settings.
2. Current Understanding of Rotor–Stator Spinning Disc Reactors
In this chapter, the literature on heat- and mass-transfer in closed rotor–stator spinning disc reactors is discussed, including the phenomena causing these characteristics, the influences on reaction speed and selectivity, and the way to model these phenomena.
2.1. Mechanical Description of Rotor–Stator Spinning Disc Reactors
2.2. Hydrodynamics of Single-Phase Reactions in a Spinning Disc Reactor
As mentioned in the Introduction, mass and heat-transfer need to be very good when determining the reaction rate. Normally, this requires a certain degree of turbulence. Turbulence is defined as a function of the rotor–stator configuration.
where ω = angular momentum (rad/s], R is the rotor radius (m), and ν is the kinematic viscosity (m2/s).
where R is the rotor radius (m), and h is the distance between the rotor blade and the stator above or below the rotor blade (m).
where ΦV is the flow (m3/s) that is pumped through the spinning disc reactor, R is the rotor radius (m), and υ is the kinematic viscosity (m2/s).
Based on the above, it is clear that CFD provides a deep understanding of the hydrodynamics of the spinning disc reactor. It is even possible to obtain the residence time distribution from such a generally applicable model. However, such models require very specialized equipment and knowledge to operate them and are therefore not suitable for our low-budget application.
Furthermore, they do not provide insight into whether sufficient micro-mixing occurs, is that directly upon entering the turbulent flow regime or do the Batchelor and Stewartson flow with their respective effects on Von Kármán and Bödewadt boundary layers also have a considerable influence? Therefore, in the following paragraphs, we will investigate, respectively, micro-mixing and a macro-scale approach to the determination of the residence time distribution.
2.3. Degree of Micro-Mixing in a Spinning Disc Reactor
As mentioned in the Introduction, the spinning disc has proven to be very efficient in terms of allowing reactants from so-called “immiscible” fluids. This is explained in terms of increased mixing on the microscale of the mixture, decreasing the distance molecules must diffuse to the interface between the two fluids, also referred to as increased micro-mixing.
where tmix is the micro-mixing time (s), εloc is the local energy dissipation rate (m2/s) and υ the kinematic viscosity (m2/s). The advantage is that the relation is the same, independent of Cw, G, and Re.
2.4. Residence Time Distribution Modeling in a Spinning Disc Reactor
To summarize, the general “engineering approach” to determining the residence time distribution of a spinning disc reactor is to do residence time experiments and fit the data to a combination of a certain percentage of PFR and a number of CSTRs in series. The presented models are not generally applicable.
2.5. Modeling of Gas–Liquid Reactions in a Spinning Disc Reactor
In the previous paragraphs, the literature results presented all applied to single-phase reactions. Some of them described liquid reactions between liquids that are not likely to mix on a micro scale but no gas–liquid reactions. In this paragraph, we discuss experimental results presented in the literature on gas–liquid flow and reactions in a spinning disc reactor.
The maximum rotor speed of the equipment used was 179 rad/s. It seems that at even higher rotor speeds, the volumetric gas transfer would have increased even further. However, the experiments described in this paper were conducted at two gas flows, a “low” gas flow of 1.8 × 10⁻⁶ m3/s and one high gas flow of 7.3 × 10⁻⁶ m3/s. The volumetric mass transfer corrected for gas hold-up (cubic meter liquid per cubic meter gas per second) for the “low” gas flow seems to become independent of rotor speed at approximately 80 rad/s, while the mass transfer at the high flow seems to increase until 150 rad/s (2009). This is attributed to the equilibrium between gas and liquid.
Furthermore, the decrease in bubble diameter is shown to be linearly proportional to the local energy dissipation rate February εloc and a power function of the Reynolds number. The authors suggest this direct relation with the local energy dissipation rate suggests that the local energy dissipation closed to the rim of the reactor, i.e., where the film flow regime transits to the dispersion regime by shearing of gas bubbles, determines the maximum bubble diameter in the dispersion phase. Therefore, the local energy dissipation rate is expected to allow for scaling the current findings to scaled-up reactors and different reaction fluids.
2.6. Conclusions of the Literature Studies on Spinning Disc Reactors
To have optimal micro-mixing single-phase reactions in a spinning-disc reactor should be carried in the turbulent regime (εloc/υ > 1 × 10⁸ or Re > 1 × 10⁵).
Multiphase reaction in a spinning disc reactor should be operated in the homogenous regime, i.e., the shear should be so high that all gas bubble diameters are smaller than the height below the rotor. This can be determined experimentally since bubbles with a larger diameter cause pressure waves in the reactor.
3. Development of a General Model to Estimate Residence Time Distribution
The next step is to study the options at hand to simplify this approach and determine whether the inaccuracies that are inevitably caused by such simplifications are acceptable compared to the level of accuracy that normally is realized during feasibility studies.
Therefore, the question is how large is the effect of the inaccuracies that are induced when you do extrapolate these results to other spinning disc reactors, and how does that compare to the inaccuracies of other commonly used methods to determine the kinetic data for the use in feasibility studies?
3.1. Generalization of the Tanks-in-Series Model for a Spinning Disc Reactor
We explored which variables prevent the current model from being applicable for the determination of kinetic parameters. We found two variables:
The exact percentages of CSTRs and PFR
The sequence of CSTRs and PFR in the model
To determine the error induced by generalizing these variables, we adopted the following four-step approach:
- 3.
- For several common reaction types, we calculated conversion in a PFR system and in three CSTRs in series, as is used in the model of De Beer et al. (2014) [4]. We then compare the conversion of both systems and draw conclusions on the differences.
- 4.
We calculated conversion for different sequences of the PFR and the CSTRs in the modeling of the conversion and the differences that are found in this way.
- 5.
- We calculated conversion based on the percentage of the volume of the spinning disc reactor modeled as a PFR and the percentage of three CSTRs as reported by De Beer et al. (2014) [4], and conversion based on the combination of a PFR and 2–2.5× CSTRs as reported by Visscher et al. (2013) [19] to see how large differences in conversion are for the different variable values in these data sets.
- 6.
To determine whether the variations found in the three steps above are relevant compared to the variations that are normally caused by the experimental determination of kinetic values, we experimentally determined the conversion rate of acetic anhydride after hydrolysis at different temperatures in a spinning disc reactor and validated the model by comparison of our own dataset to conversion rates in literature data on this reaction. In addition, we compared the accuracy of our model to the accuracy of our own experimental data and the kinetic data from the literature.
3.2. Step 1: Modeling Reactions in a PFR and Three CSTRs in Series
- 7.
A first-order reaction where the concentration of only one reactant is important (in a first-order manner).
- 8.
A second-order reaction occurs when one reactant reacts in a second-order manner, or two reactants with the same initial concentration react with each other.
- 9.
A general second-order reaction is where two reactants react with each other, and both concentrations are important.
- 10.
A second-order equilibrium reaction that reacts both ways until an equilibrium is reached (if the residence time is long enough).
- 11.
A second-order reaction, followed by a second-order reaction in which the desired product is involved as a reactant and therefore reacts away: a reaction in series.
- 12.
A second-order reaction where the limiting reactant also reacts to an unwanted side product: reactions in parallel.
3.3. Step 2: Effect of the Sequence of CSTRs and a PFR on the Conversion Rate
As described in the Introduction, a spinning disc reactor can be calculated as a combination of different percentages of a PFR and three CSTRs in series. Since the effect of different sequences and percentages of a PFR and three CSTRs were not clear, we assessed several percentages and sequences.
The sequences used were:
- 13.
First three CSTRs, then a PFR;
- 14.
First a PFR, then three CSTRs;
- 15.
One-disc model: a PFR, three CSTRs, a PFR;
- 16.
Three-disc model: a PFR, one CSTR, a PFR, one CSTR, a PFR, and one CSTR, a PFR.
3.4. Step 3: Calculation of the Conversion from the Residence Time Distribution Data
3.5. Step 4: Experimental Validation of the Model
To validate the model, a well-studied reaction was chosen to see if the conversions found in a spinning disc reactor were indeed between a PFR and three CSTRs in series. The reaction chosen is the hydrolysis of acetic anhydride. This reaction is chosen since this reaction is well documented, and the degree of conversion can be determined using aniline titration. Furthermore, no large deviations in reported kinetic data are expected between previously established reaction rates and the reaction rate determined in the spinning disc reactor, since no limitations in mass and heat transfer are expected when using low concentrations of acetic anhydride.
3.6. Literature Data on the Hydrolysis of Acetic Anhydride
We validated the accuracy of our generalized model by plotting the measured relation between the reaction rate and temperature and comparing the reported values for activation energy Ea and ln(A) to the 95% confidence interval.
3.7. Experimental Validation of Acetic Anhydride Hydrolysis
A rotor–stator spinning disc reactor “Spinpro R10” supplied by Flowid, with a volume of 19 mL was used. This reactor has three rotors with a diameter of 70 mm in the stators with a diameter of 72 mm. The thickness of the two top rotors was 5 mm in a stator cavity of 6 mm; the third rotor had a thickness of 20.5 mm in a stator cavity of 21.5 mm because this rotor contained a magnet for propulsion. This means that the gap between the rotor and stator was 0.5 mm (G = 0.5/35 = 0.014), and the space at the rim of the rotor was 1 mm.
Experiments were conducted between 40 and 80 °C at 2000 rpm, resulting in a Reynolds and Cw number varying between respectively 3.5 × 10⁵ < Re < 7.5 × 10⁵ and 8 < Cw < 16. Above 80 °C, conversion after total residence time was so high (>90%) that a reliable determination of the reaction rate constant was not possible because minor differences in conversion have a large effect on the outcome. Below 40 °C, the measured conversion was significantly higher than the literature values, possibly because of the bad solubility of acetic anhydride at low temperatures. In that case, our assumption that the reaction is not mass-transfer limited is not valid anymore and, therefore, not suitable for comparison to literature values.
Samples were titrated with 1.0 M NaOH to determine the concentration of the product acetic acid. For every temperature, a sample without aniline was taken and titrated to calculate the initial acetic anhydride concentration. With the known initial concentration of acetic anhydride, the conversion of the hydrolysis reaction can be calculated from the final concentration of acetic acid.
4. Results
4.1. Modeling Reactions in PFR and 3 CSTRs in Series
The calculated conversion rates for reaction 3 (general second-order reaction) lay in between the calculated conversion rates for reactions 1 and 2. This is to be expected because it is a second-order reaction that can act as a pseudo-first-order reaction when one of the concentrations of the reactants is much higher than the concentration of the other reactant. For the equilibrium reaction (no. 4), differences are equal to reaction 3 or lower because close to equilibrium, there is no difference between CSTRs and PFR. For reactions 1–4, PFR always gives the highest conversion.
For the reaction in series (no. 5), three CSTRs shows higher conversions when conversion is low. This is because the unwanted side reaction that leads to low conversion is promoted in a PFR. For the parallel reaction (no. 6), PFR has higher conversions, but in some cases, the side reaction is promoted in PFR, leading to lower conversion.
Since all variables were chosen randomly not all shown data points are in line with realistic production circumstances. For commercial production only the conversion of over 80% is relevant.
4.2. Effect of Sequence of CSTR and PFR on Conversion Rate
4.3. Literature Data on Residence Time Distribution Versus Expected Conversion
4.4. Validation of the Model by Acetic Anhydride Hydrolysis
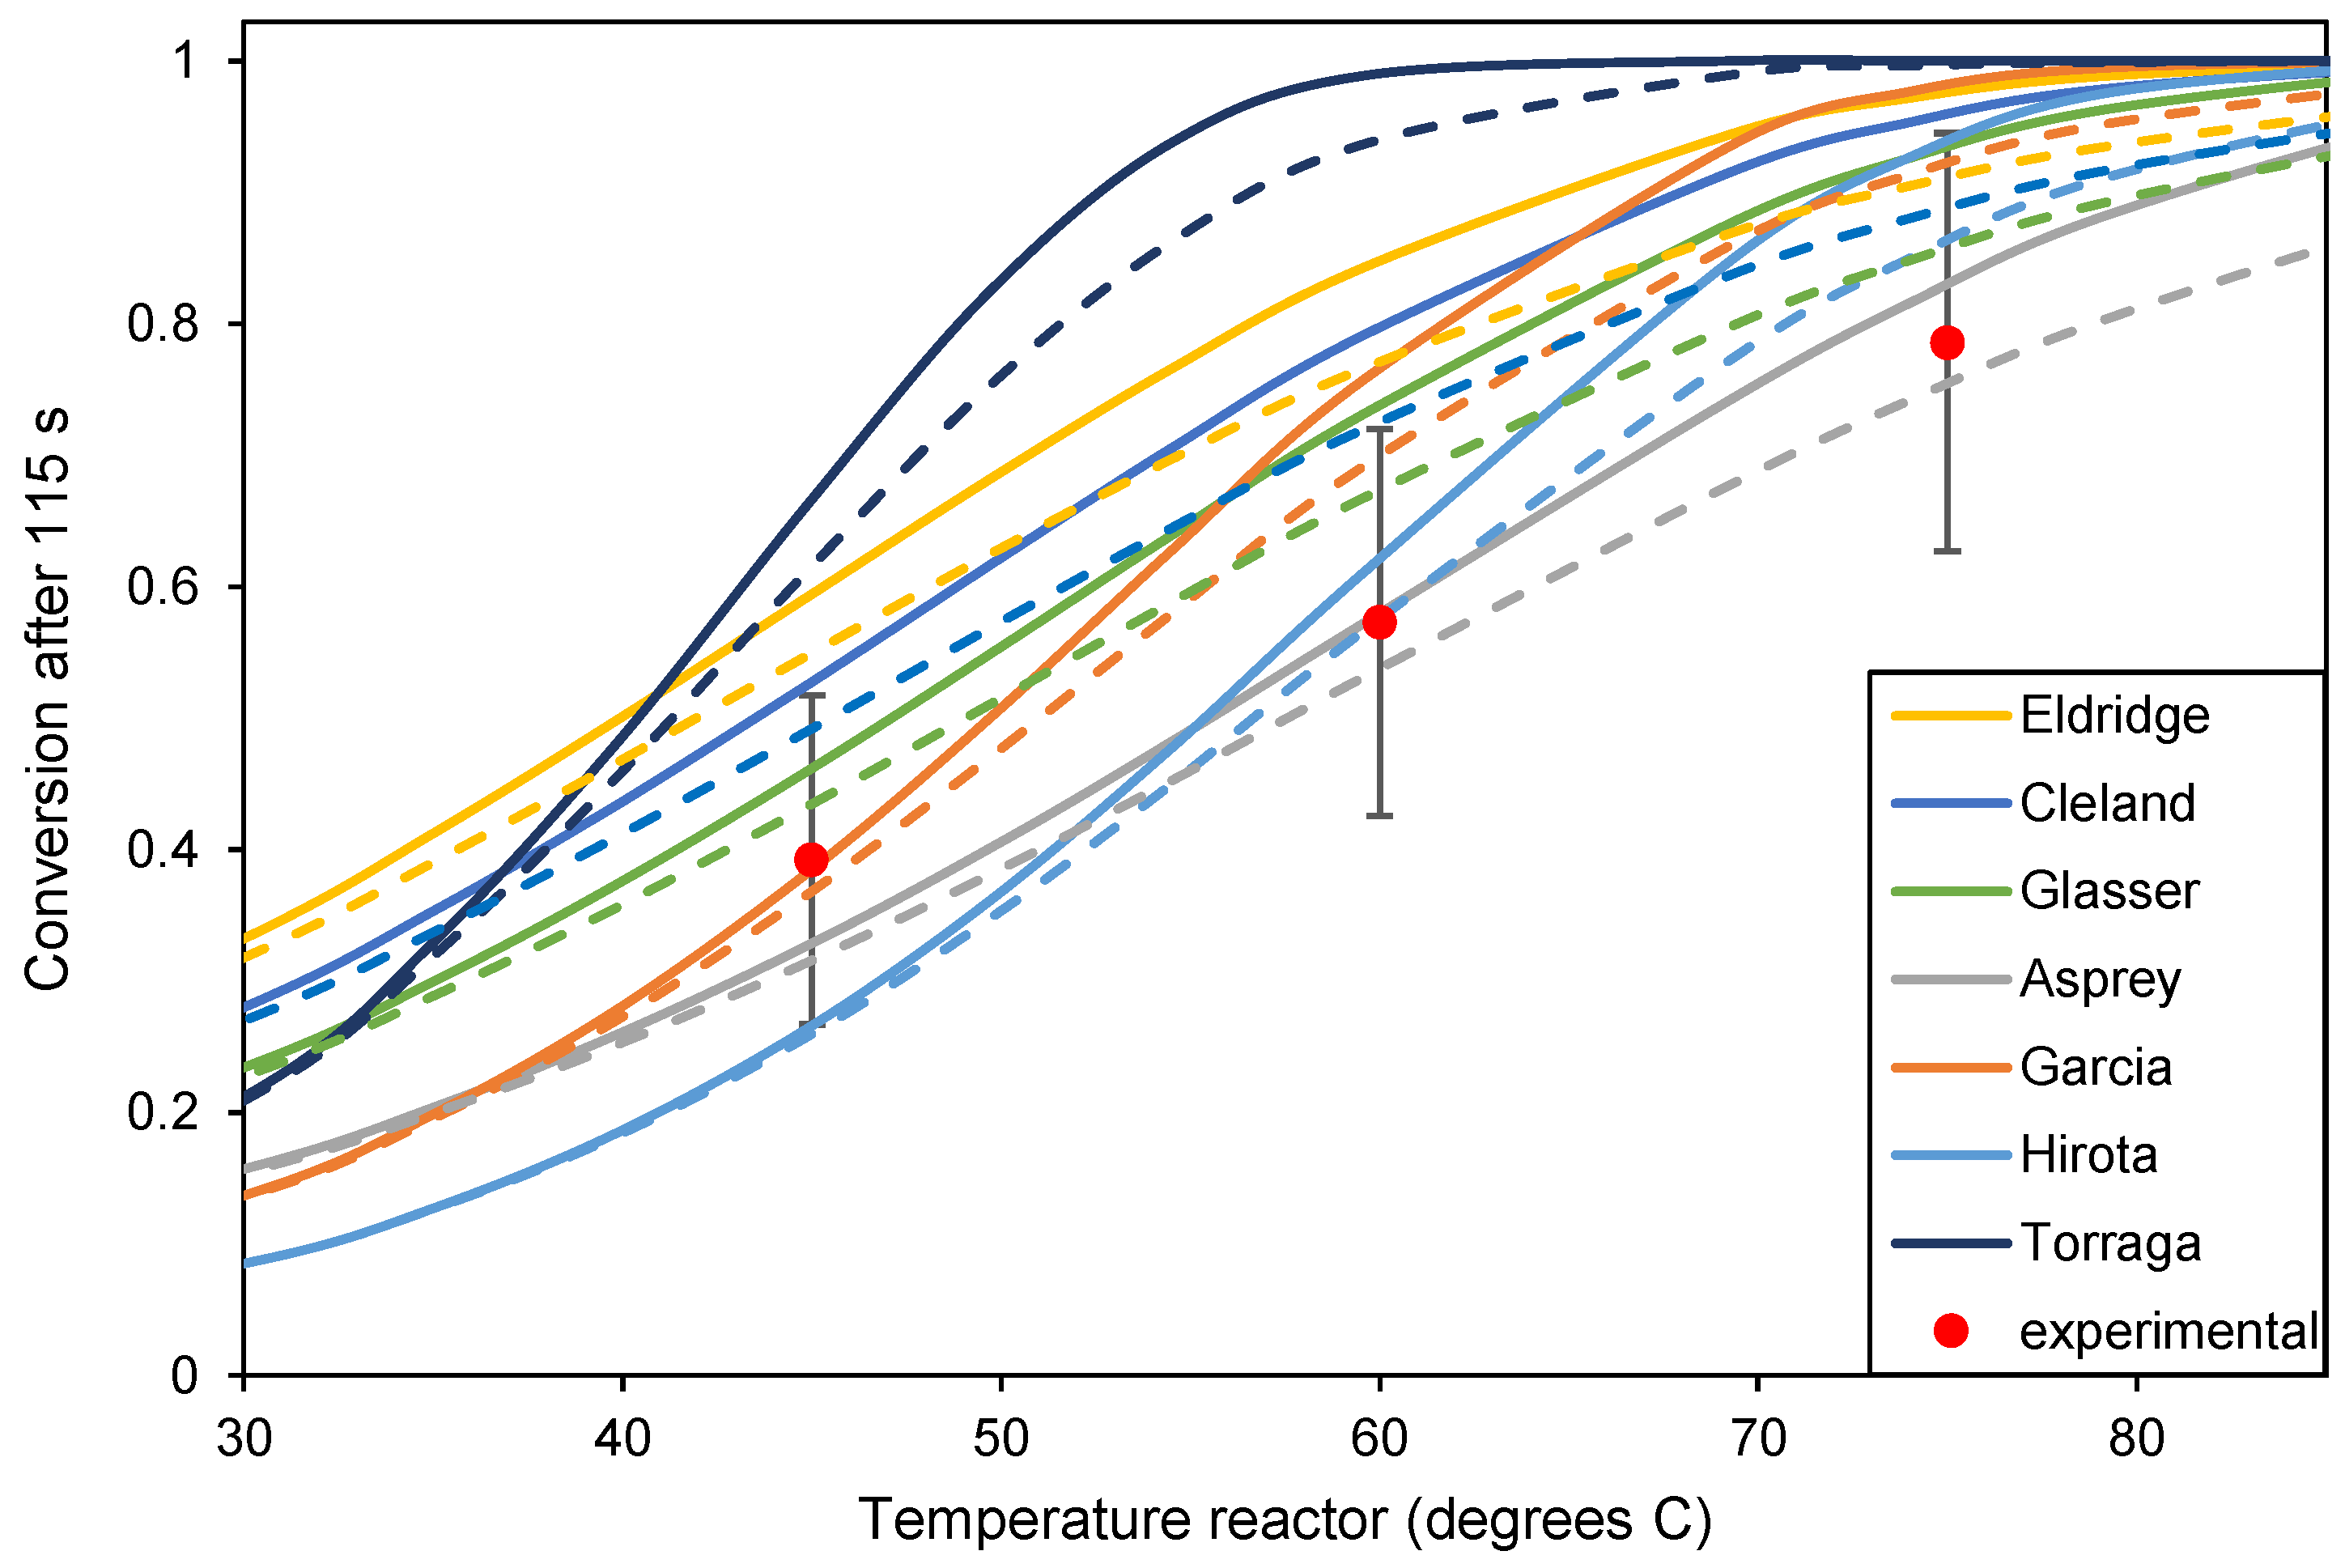
For all literature data, predicted conversion in a PFR (solid line) and in three CSTRs (dotted line) were calculated using the kinetic parameters reported in the literature. This shows that for the reported literature data, the difference between predicted conversion in a PFR is similar to the prediction of the conversion in three CSTRs. The difference between the different literature data is much larger than the difference between a PFR and three CSTRs. The conversion determined in our experiment was within the range of data reported in the literature.
5. Discussion
Before we continue to discuss these findings, we must stress that this model aims to identify those reactions that in the current industrial settings seem slow but that can be sped up considerably using process intensification principles. The intended outcome is to make it possible to raise some awareness of what a mini reactor could mean, not only in terms of smaller reactor volume but also in terms of decreased separation requirements and improved heat integration potential. This method is certainly not fit for reactions that are known to be fast and of which one wants to accurately determine how fast and selective they can be made, in that the other methods described in the literature study are more suitable.
Going back to our results, we found that the error induced by this approach is 10%. We also showed that the variance in reported values in the literature is much larger than this 10%, which makes it sufficiently accurate for a (pre-)feasibility study. However, both findings are only valid if the used equations apply. Therefore, we will have a more careful look at these preconditions:
- The residence time distributions described in Section 2.4 are determined on a single-phase fluid;
The value of the reaction rate constant is a function of temperature only; thus, no limitations in mass- and or heat-transfer.
6. Conclusions
We developed a model describing residence time distribution in spinning disc reactors that is generally applicable to all spinning disc reactors, allowing us to determine the kinetic parameters of reactions without first experimentally determining the residence time distribution of the specific spinning disc reactor that is used for the experimental determination of the kinematic parameters.
Validation with the hydrolysis of acetic anhydride shows that the 10% inaccuracy falls within the accuracy of the value of the experimental determination of the reaction rate constant.
Supplementary Materials
Author Contributions
Conceptualization, M.v.L.; methodology, M.v.L. and P.M.; validation, M.v.L. and P.M.; formal analysis, P.M.; investigation, P.M.; resources, M.v.L. and P.M.; data curation, P.M.; writing—original draft preparation, M.v.L. and P.M.; writing—review and editing, M.v.L. and P.M.; visualization, P.M.; supervision, M.v.L.; project administration, M.v.L. and P.M.; funding acquisition, M.v.L. All authors have read and agreed to the published version of the manuscript.
Funding
This research received no external funding.
Data Availability Statement
Acknowledgments
At the start of this study, we were in a deadlock situation: it was known from the literature that spinning disc reactors were likely to provide opportunities for industry to reduce their energy consumption. However, there was no method to map this at limited cost, nor was there any demand from industry to develop such a method. In the absence of demand from industry, there was also no opportunity to apply for a grant for this research. The deadlock was broken when Liek Voorbij, at the time, Director of the Research Centre for Sustainable Port Cities at Rotterdam University of Applied Sciences, offered to finance the required manpower for this study, and Education Manager Arjan Brenkman of Utrecht University of Applied Sciences agreed to allow us the use of the equipment of the faculty. Without the support of these people, this research would not have been possible.
Conflicts of Interest
The authors declare no conflicts of interest.
References
- Harmsen, J.; Verkerk, M. Process Intensification; De Gruyter: Berlin, Germany, 2020. [Google Scholar]
- Moulijn, J.A.; Stankiewicz, A.; Grievink, J.; Gorak, A. Process intensification and process system engineering: A friendly symbiosis. Comput. Chem. Eng. 2006, 21, 29–37. [Google Scholar] [CrossRef]
- Visscher, F.; van der Schaaf, J.; Nijhuis, T.A.; Schouten, J.C. Rotating reactors—A review. Chem. Eng. Res. Des. 2013, 91, 1923–1940. [Google Scholar] [CrossRef]
- De Beer, M.M.; Keurentjes, J.T.F.; Schouten, J.C.; van der Schaaf, J. Engineering model for single-phase flow in a multi-stage rotor–stator spinning disc reactor. Chem. Eng. J. 2014, 242, 53–61. [Google Scholar] [CrossRef]
- Haddadi, S.; Poncet, S. Turbulence Modelling of Torsional Couette Flows. Int. J. Rotating Mach. 2008, 2008, 635138. [Google Scholar] [CrossRef]
- Daily, J.W.; Nece, R.E. Chamber Dimension Effects on Induced Flow and Frictional Resistance of Enclosed Rotating Disks. J. Fluids Eng. 1960, 82, 217–230. [Google Scholar] [CrossRef]
- De Beer, M.M.; Loane, L.P.M.; Keurentjes, J.T.F.; Schouten, J.C.; van der Schaaf, J. Single phase fluid-stator heat transfer in a rotor–stator spinning disc reactor. Chem. Eng. Sci. 2014, 119, 88–98. [Google Scholar] [CrossRef]
- Hop, C.J.W.; Jansen, R.; Besten, M.; Chaudhuri, A.; Baltussen, M.W.; van der Schaaf, J. The hydrodynamics of a rotor stator spinning disc reactor: Investigations by Large Eddy Simulation. Phys. Fluids 2023, 35, 035105. [Google Scholar] [CrossRef]
- Kleiner, J.; Münch, B.; Rößler, F.; Fernengel, J.; Habla, F.; Hinrichsen, O. CFD simulation of single-phase heat transfer in a rotor-stator spinning disc reactor. Chem. Eng. Process. Process Intensif. 2018, 131, 150–160. [Google Scholar] [CrossRef]
- Manzano Martínez, A.N.; van Eeten, K.M.P.; Schouten, J.C.; van der Schaaf, J. Micromixing in a Rotor–Stator Spinning Disc Reactor. Ind. Eng. Chem. Res. 2017, 56, 13454–13460. [Google Scholar] [CrossRef] [PubMed]
- Manzano Martínez, A.N.; Chaudhuri, A.; Assirelli, M.; van der Schaaf, J. Effects of increased viscosity on micromixing in rotor–stator spinning disk reactors. Chem. Eng. J. 2022, 434, 134292. [Google Scholar] [CrossRef]
- De Beer, M.M.; Keurentjes, J.T.F.; Schouten, J.C.; van der Schaaf, J. Bubble formation in co-fed gas–liquid flows in a rotor-stator spinning disc reactor. Int. J. Multiph. Flow 2016, 83, 142–152. [Google Scholar] [CrossRef]
- Chaudhuri, A.; Backx, W.G.; Moonen, L.L.C.; Molenaar, C.W.C.; Winkenweder, W.; Ljungdahl, T.; van der Schaaf, J. Kinetics and intensification of tertiary amine N-oxidation: Towards a solventless, continuous and sustainable process. Chem. Eng. J. 2021, 416, 128962. [Google Scholar] [CrossRef]
- Kleiner, J.; Hinrichsen, O. Epoxidation of methyl oleate in a rotor-stator spinning disc reactor. Chem. Eng. Process 2019, 136, 152–162. [Google Scholar] [CrossRef]
- Van Kouwen, E.R.; Winkenwerder, W.; Brentzel, Z.; Joyce, B.; Pagano, T.; Jovic, S.; Bargeman, G.; van der Schaaf, J. The mixing sensitivity of toluene and ethylbenzene sulfonation using fuming sulfuric acid studied in a rotor-stator spinning disc reactor. Chem. Eng. Process 2021, 160, 108303. [Google Scholar] [CrossRef]
- Wietelmann, U.; Klösener, J.; Rittmeyer, P.; Schnippering, S.; Bats, H.; Stam, W. Continuous Processing of Concentrated Organolithiums in Flow Using Static and Dynamic Spinning Disc Reactor Technologies. Org. Process Res. Dev. 2022, 26, 1422–1431. [Google Scholar] [CrossRef]
- Magosso, M.; Hazen, L.J.W.; van den Berg, M.; van der Schaaf, J. Intensified Sulfite Reduction of Alkyl Hydroperoxides in a Rotor–Stator Spinning-Disc Reactor. Ind. Eng. Chem. Res. 2021, 60, 15540–15548. [Google Scholar] [CrossRef]
- Levenspiel, O. Chemical Reaction Engineering, 3rd ed.; John Wiley & Sons: New York, NY, USA, 1999. [Google Scholar]
- Visscher, F.; de Hullu, J.; de Croon, M.H.; van der Schaaf, J.; Schouten, J.C. Residence time distribution in a single-phase rotor-stator spinning disc reactor. AIChE J. 2013, 59, 2686–2693. [Google Scholar] [CrossRef]
- Haseidl, F.; König, P.; Hinrichsen, O. Single-Phase Flow Residence-Time Distributions in a Rotor-Stator Spinning Disc Reactor. Chem. Eng. Technol. 2016, 39, 2435–2443. [Google Scholar] [CrossRef]
- Meeuwse, M.; Van Der Schaaf, J.; Kuster, B.F.M.; Schouten, J.C. Gas–liquid mass transfer in a rotor–stator spinning disc reactor. Chem. Eng. Sci. 2009, 65, 466. [Google Scholar] [CrossRef]
- Meeuwse, M.; van der Schaaf, J.; Schouten, J.C. Multistage rotor-stator spinning disc reactor. AIChE J. 2012, 58, 247–255. [Google Scholar] [CrossRef]
- Eldridge, J.W.; Piret, E.L. Continuous-flow stirred-tank reactor system I. Design equations for homogeneous liquid phase reactions, Experimental data. Chem. Eng. Prog. 1950, 47, 363. [Google Scholar]
- Cleland, F.A.; Wilhelm, R.H. Diffusion and reaction in viscous-flow tubular reactor. AIChE J. 1956, 2, 489–497. [Google Scholar] [CrossRef]
- Glasser, D.; Williams, D.F. The Study of Liquid-Phase Kinetics Using Temperature as a Measured Variable. Ind. Eng. Chem. Fund. 1971, 10, 516–519. [Google Scholar] [CrossRef]
- Asprey, S.P.; Wojciechowski, B.W.; Rice, N.M.; Dorcas, A. Applications of temperature scanning in kinetic investigations: The hydrolysis of acetic anhydride. Chem. Eng. Sci. 1996, 51, 4681–4692. [Google Scholar] [CrossRef]
- Hirota, W.H.; Rodrigues, R.B.; Sayer, C.; Giudici, R. Hydrolysis of acetic anhydride: Non-adiabatic calorimetric determination of kinetics and heat exchange. Chem. Eng. Sci. 2010, 65, 3849–3858. [Google Scholar] [CrossRef]
- Torraga, M.G.F.; Colmán, M.M.E.; Giudici, R. Hydrolysis of acetic anhydride: In situ, real-time monitoring using NIR and UV–Vis spectroscopy. Chem. Eng. Sci. 2019, 210, 115244. [Google Scholar] [CrossRef]
- Garcia, J.M.; Bernardino, I.R.; Calasans, V.; Giudici, R. Kinetics of the hydrolysis of acetic anhydride using reaction calorimetry: Effects of strong acid catalyst and salts. Chem. Eng. Res. Des. 2021, 166, 29–39. [Google Scholar] [CrossRef]
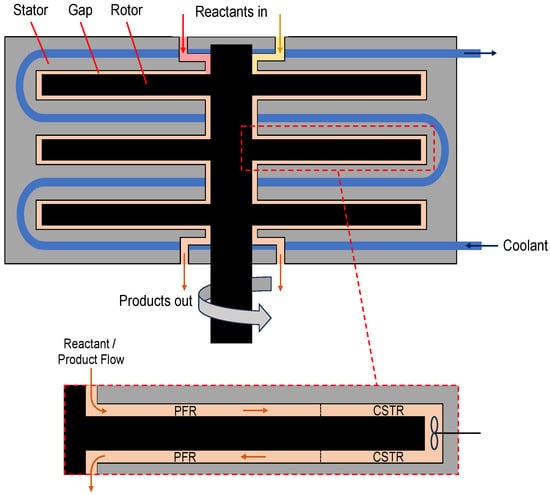
Schematic drawing of a multi-stage rotor–stator spinning disc reactor. Three discs (rotors) spin in a stator cavity with small gaps (0.5–2 mm) in between, creating high shear forces. The reaction mixture is pumped through the gaps in a continuous mode. A coolant flows through the stator to add or remove heat and control the temperature efficiently because of the large contact surface. The close-up shows mixing patterns in the gap, which resemble plug flow reactor (PFR) behavior close to the axis and ideally mixed tank (CSTR) behavior close to the rim of the rotor [4,5].
Schematic drawing of a multi-stage rotor–stator spinning disc reactor. Three discs (rotors) spin in a stator cavity with small gaps (0.5–2 mm) in between, creating high shear forces. The reaction mixture is pumped through the gaps in a continuous mode. A coolant flows through the stator to add or remove heat and control the temperature efficiently because of the large contact surface. The close-up shows mixing patterns in the gap, which resemble plug flow reactor (PFR) behavior close to the axis and ideally mixed tank (CSTR) behavior close to the rim of the rotor [4,5].
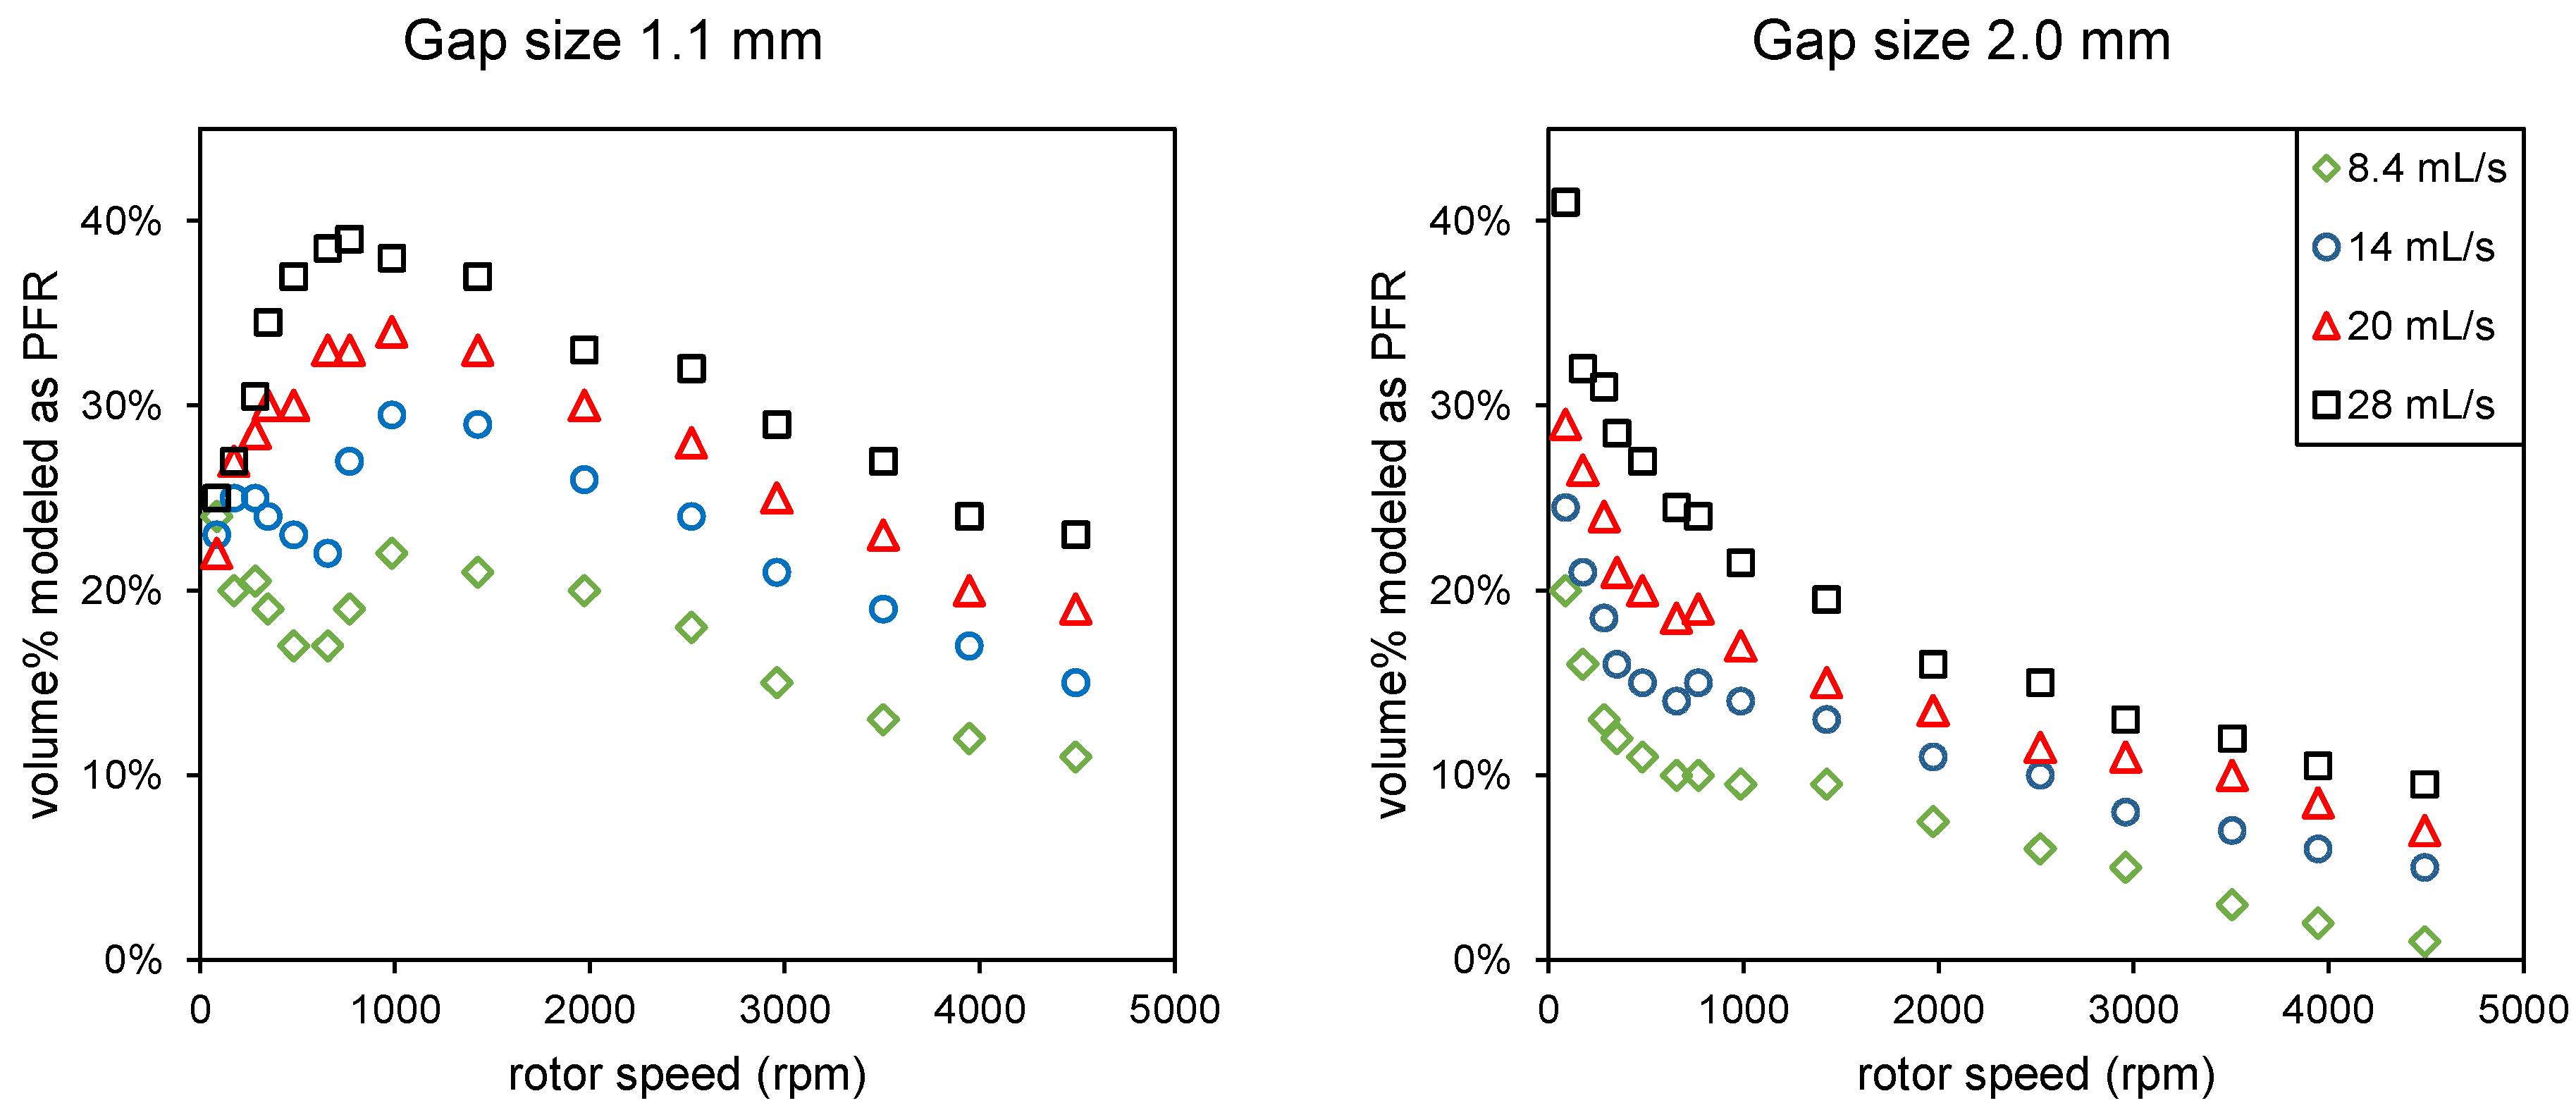
Data from De Beer (2014) [4]: percentage of the volume of the rotor–stator spinning disc reactor modeled as a PFR combined with three CSTRs in series for different flow rates, rotor speeds, and two gap sizes (distance between rotor and stator).
Data from De Beer (2014) [4]: percentage of the volume of the rotor–stator spinning disc reactor modeled as a PFR combined with three CSTRs in series for different flow rates, rotor speeds, and two gap sizes (distance between rotor and stator).
(a) Hydrolysis of acetic anhydride, used as a model reaction. (b) A much faster stop reaction of acetic anhydride with aniline, see 3.7.
Figure 3.
(a) Hydrolysis of acetic anhydride, used as a model reaction. (b) A much faster stop reaction of acetic anhydride with aniline, see 3.7.

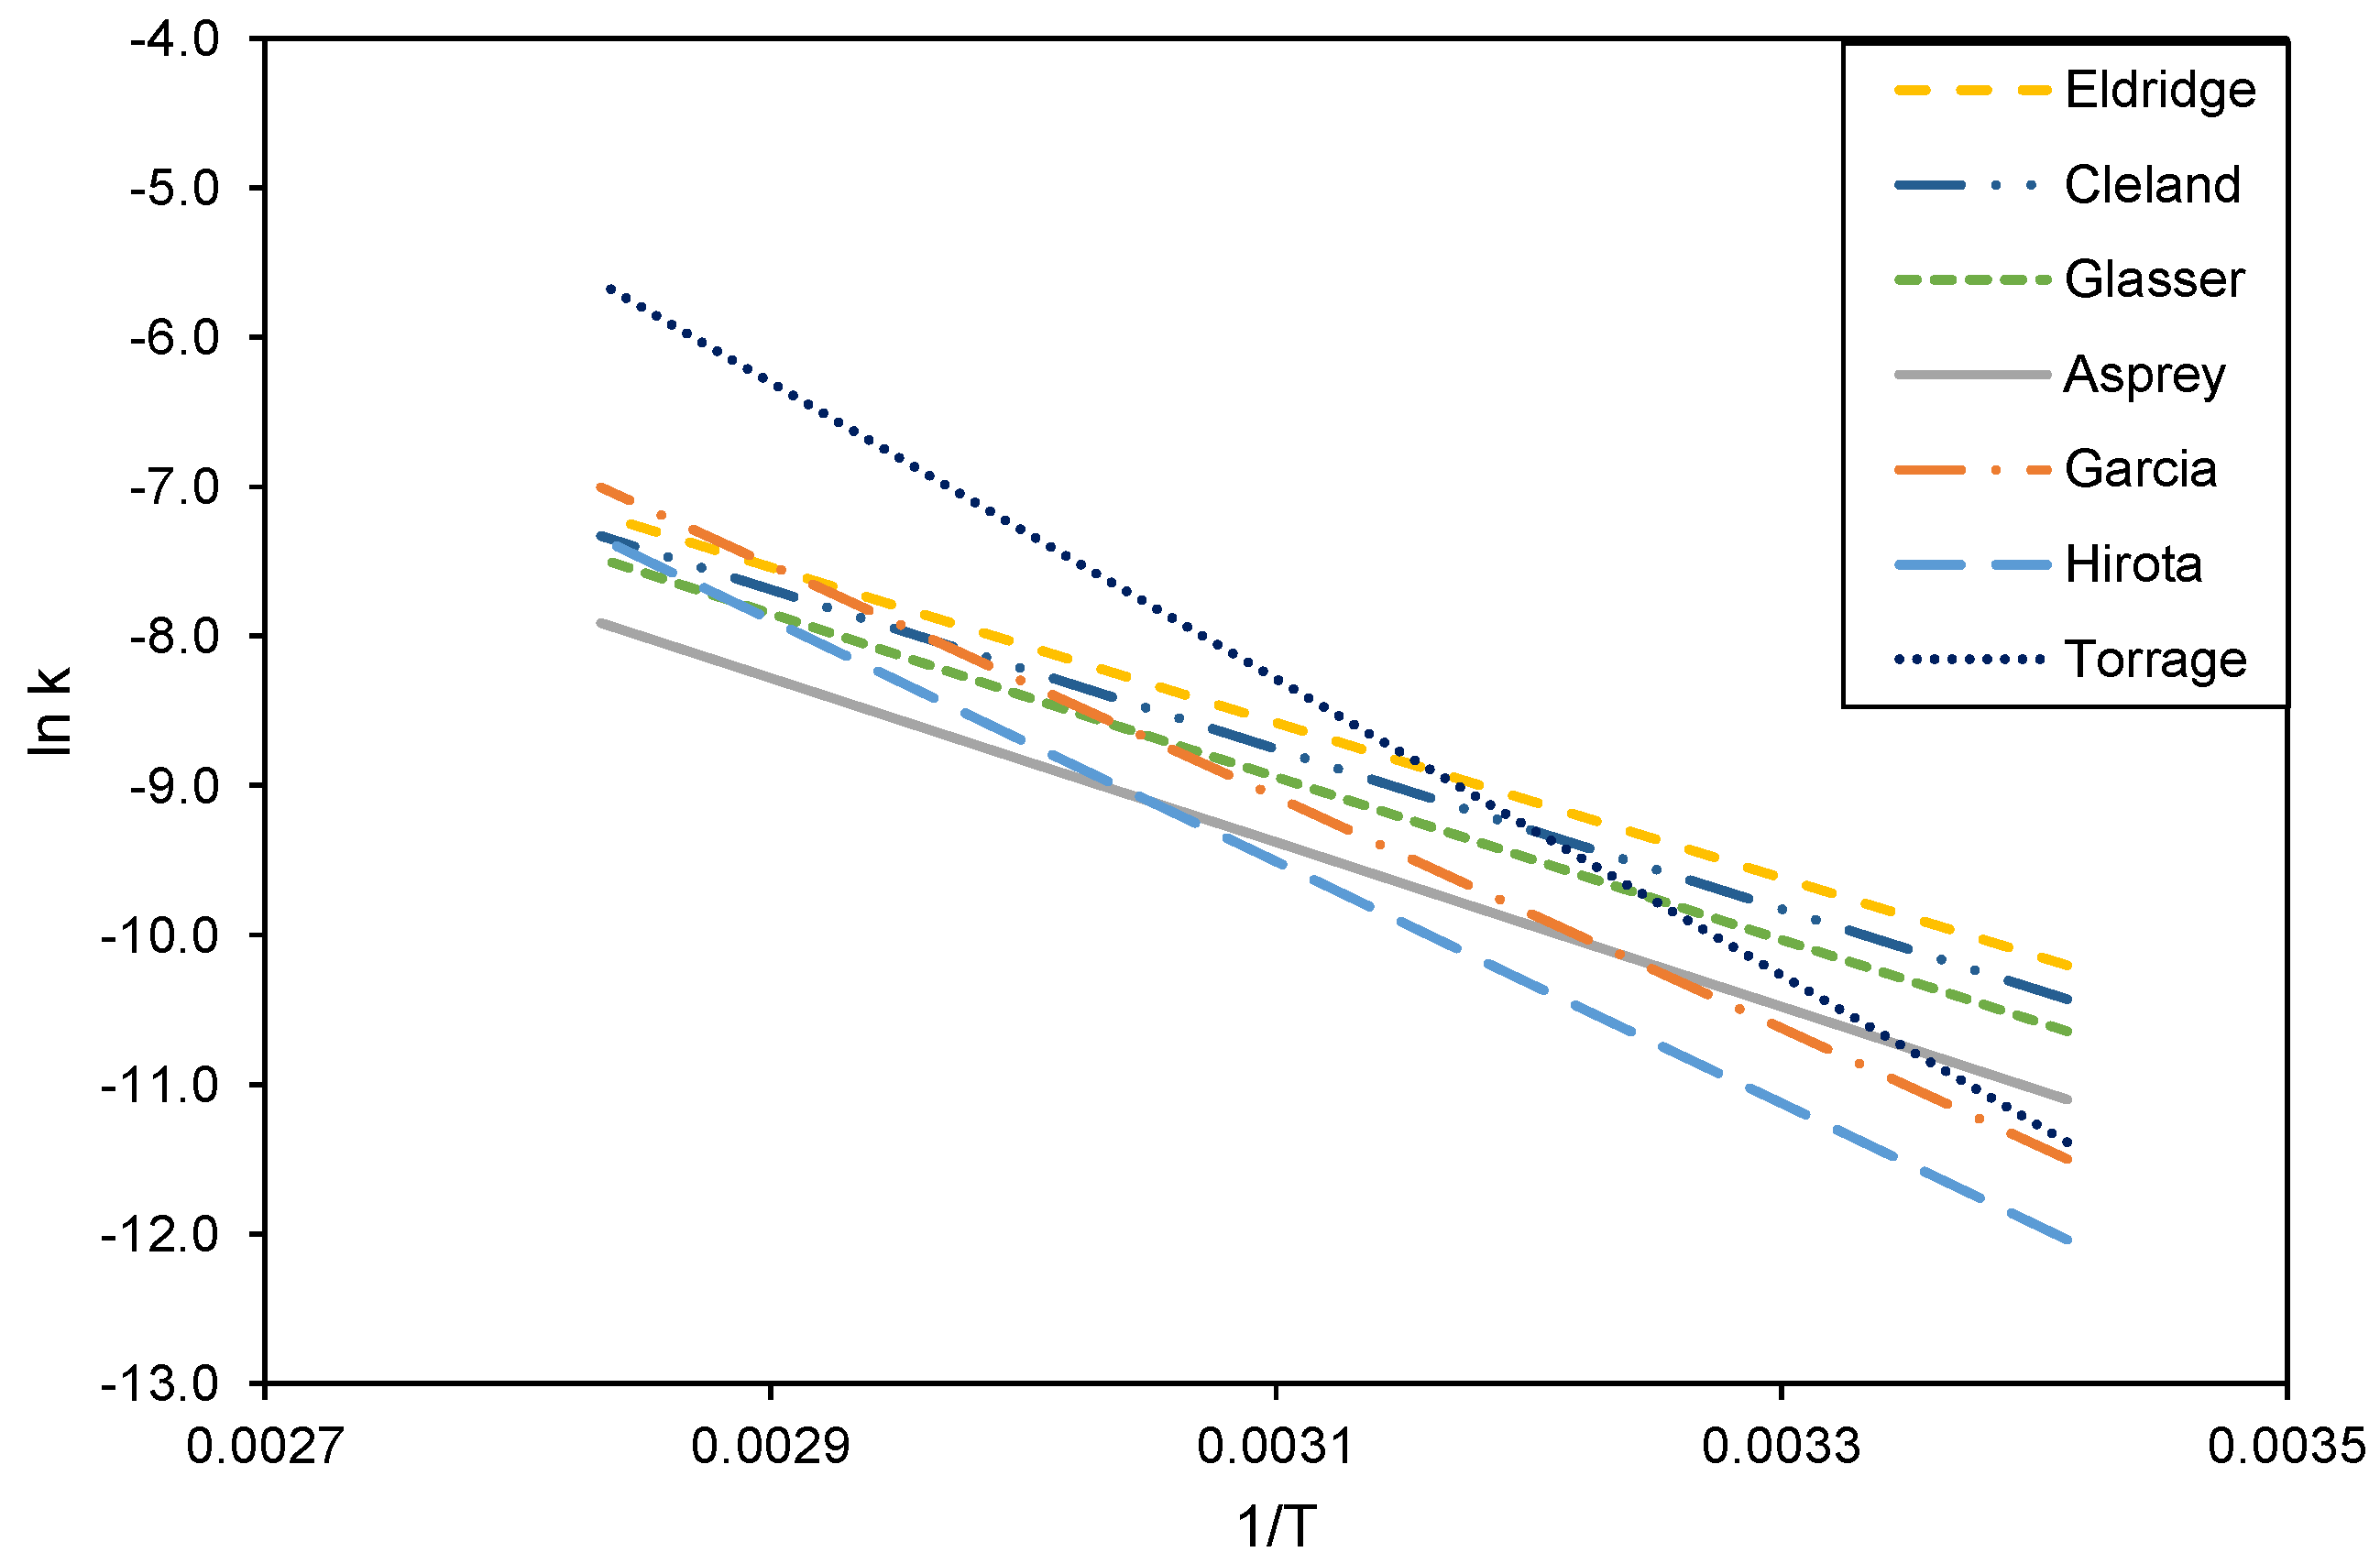
Reaction kinetic data for the hydrolysis of acetic anhydride from the literature. References are described in Table 2. Data are plotted according to the linearized Arrhenius equation , as displayed in Table 2.
Difference of three CSTRs in series compared to a PFR for reactions 1–6, calculated by subtracting the conversion in PFR from the conversion in three CSTRs. Reactions 1 and 2 are shown in all graphs for comparison. The arrow indicates the maximum difference found. The reaction variables at maximum conversion were: k = 0.88 min−1 mol−1 m3, t = 2.21 min, CA0 = 0.88 mol m−3, and CB0 = 1.61 mol m−3 for a second-order reaction (reaction 3 in Table 1).
Difference of three CSTRs in series compared to a PFR for reactions 1–6, calculated by subtracting the conversion in PFR from the conversion in three CSTRs. Reactions 1 and 2 are shown in all graphs for comparison. The arrow indicates the maximum difference found. The reaction variables at maximum conversion were: k = 0.88 min−1 mol−1 m3, t = 2.21 min, CA0 = 0.88 mol m−3, and CB0 = 1.61 mol m−3 for a second-order reaction (reaction 3 in Table 1).

Conversion found for the combination of a PFR and three CSTRs, as shown in Figure 2, for different flow rates, rotor speeds, and gap sizes using the variable values that give the largest difference between a PFR and three CSTRs, as listed in the caption of Figure 5, using the three-disc sequence as indicated in Table 3. The dashed lines indicate conversion in either a PFR or three CSTRs in series.
Conversion found for the combination of a PFR and three CSTRs, as shown in Figure 2, for different flow rates, rotor speeds, and gap sizes using the variable values that give the largest difference between a PFR and three CSTRs, as listed in the caption of Figure 5, using the three-disc sequence as indicated in Table 3. The dashed lines indicate conversion in either a PFR or three CSTRs in series.

Calculated conversions for data on predicted a PFR and CSTRs combinations from Visscher (2013) for different flow rates, rotor speeds, and gap size using the variable values that give the largest difference between a PFR and three CSTRs as listed in the caption of Figure 5, using the one-disc sequence as shown in Table 3. The dashed lines indicate conversion for only PFR, for three CSTRs in series, and for two CSTRs in series.
Calculated conversions for data on predicted a PFR and CSTRs combinations from Visscher (2013) for different flow rates, rotor speeds, and gap size using the variable values that give the largest difference between a PFR and three CSTRs as listed in the caption of Figure 5, using the one-disc sequence as shown in Table 3. The dashed lines indicate conversion for only PFR, for three CSTRs in series, and for two CSTRs in series.

Literature and experimental results for the hydrolysis of acetic anhydride. Conversion was calculated using the literature values for reaction rate at different temperatures, as shown in Figure 4. The continuous line is the calculated conversion in the PFR; the dashed line is the calculated conversion in three CSTRs in series. The experimental results were determined after 115 s.
Literature and experimental results for the hydrolysis of acetic anhydride. Conversion was calculated using the literature values for reaction rate at different temperatures, as shown in Figure 4. The continuous line is the calculated conversion in the PFR; the dashed line is the calculated conversion in three CSTRs in series. The experimental results were determined after 115 s.
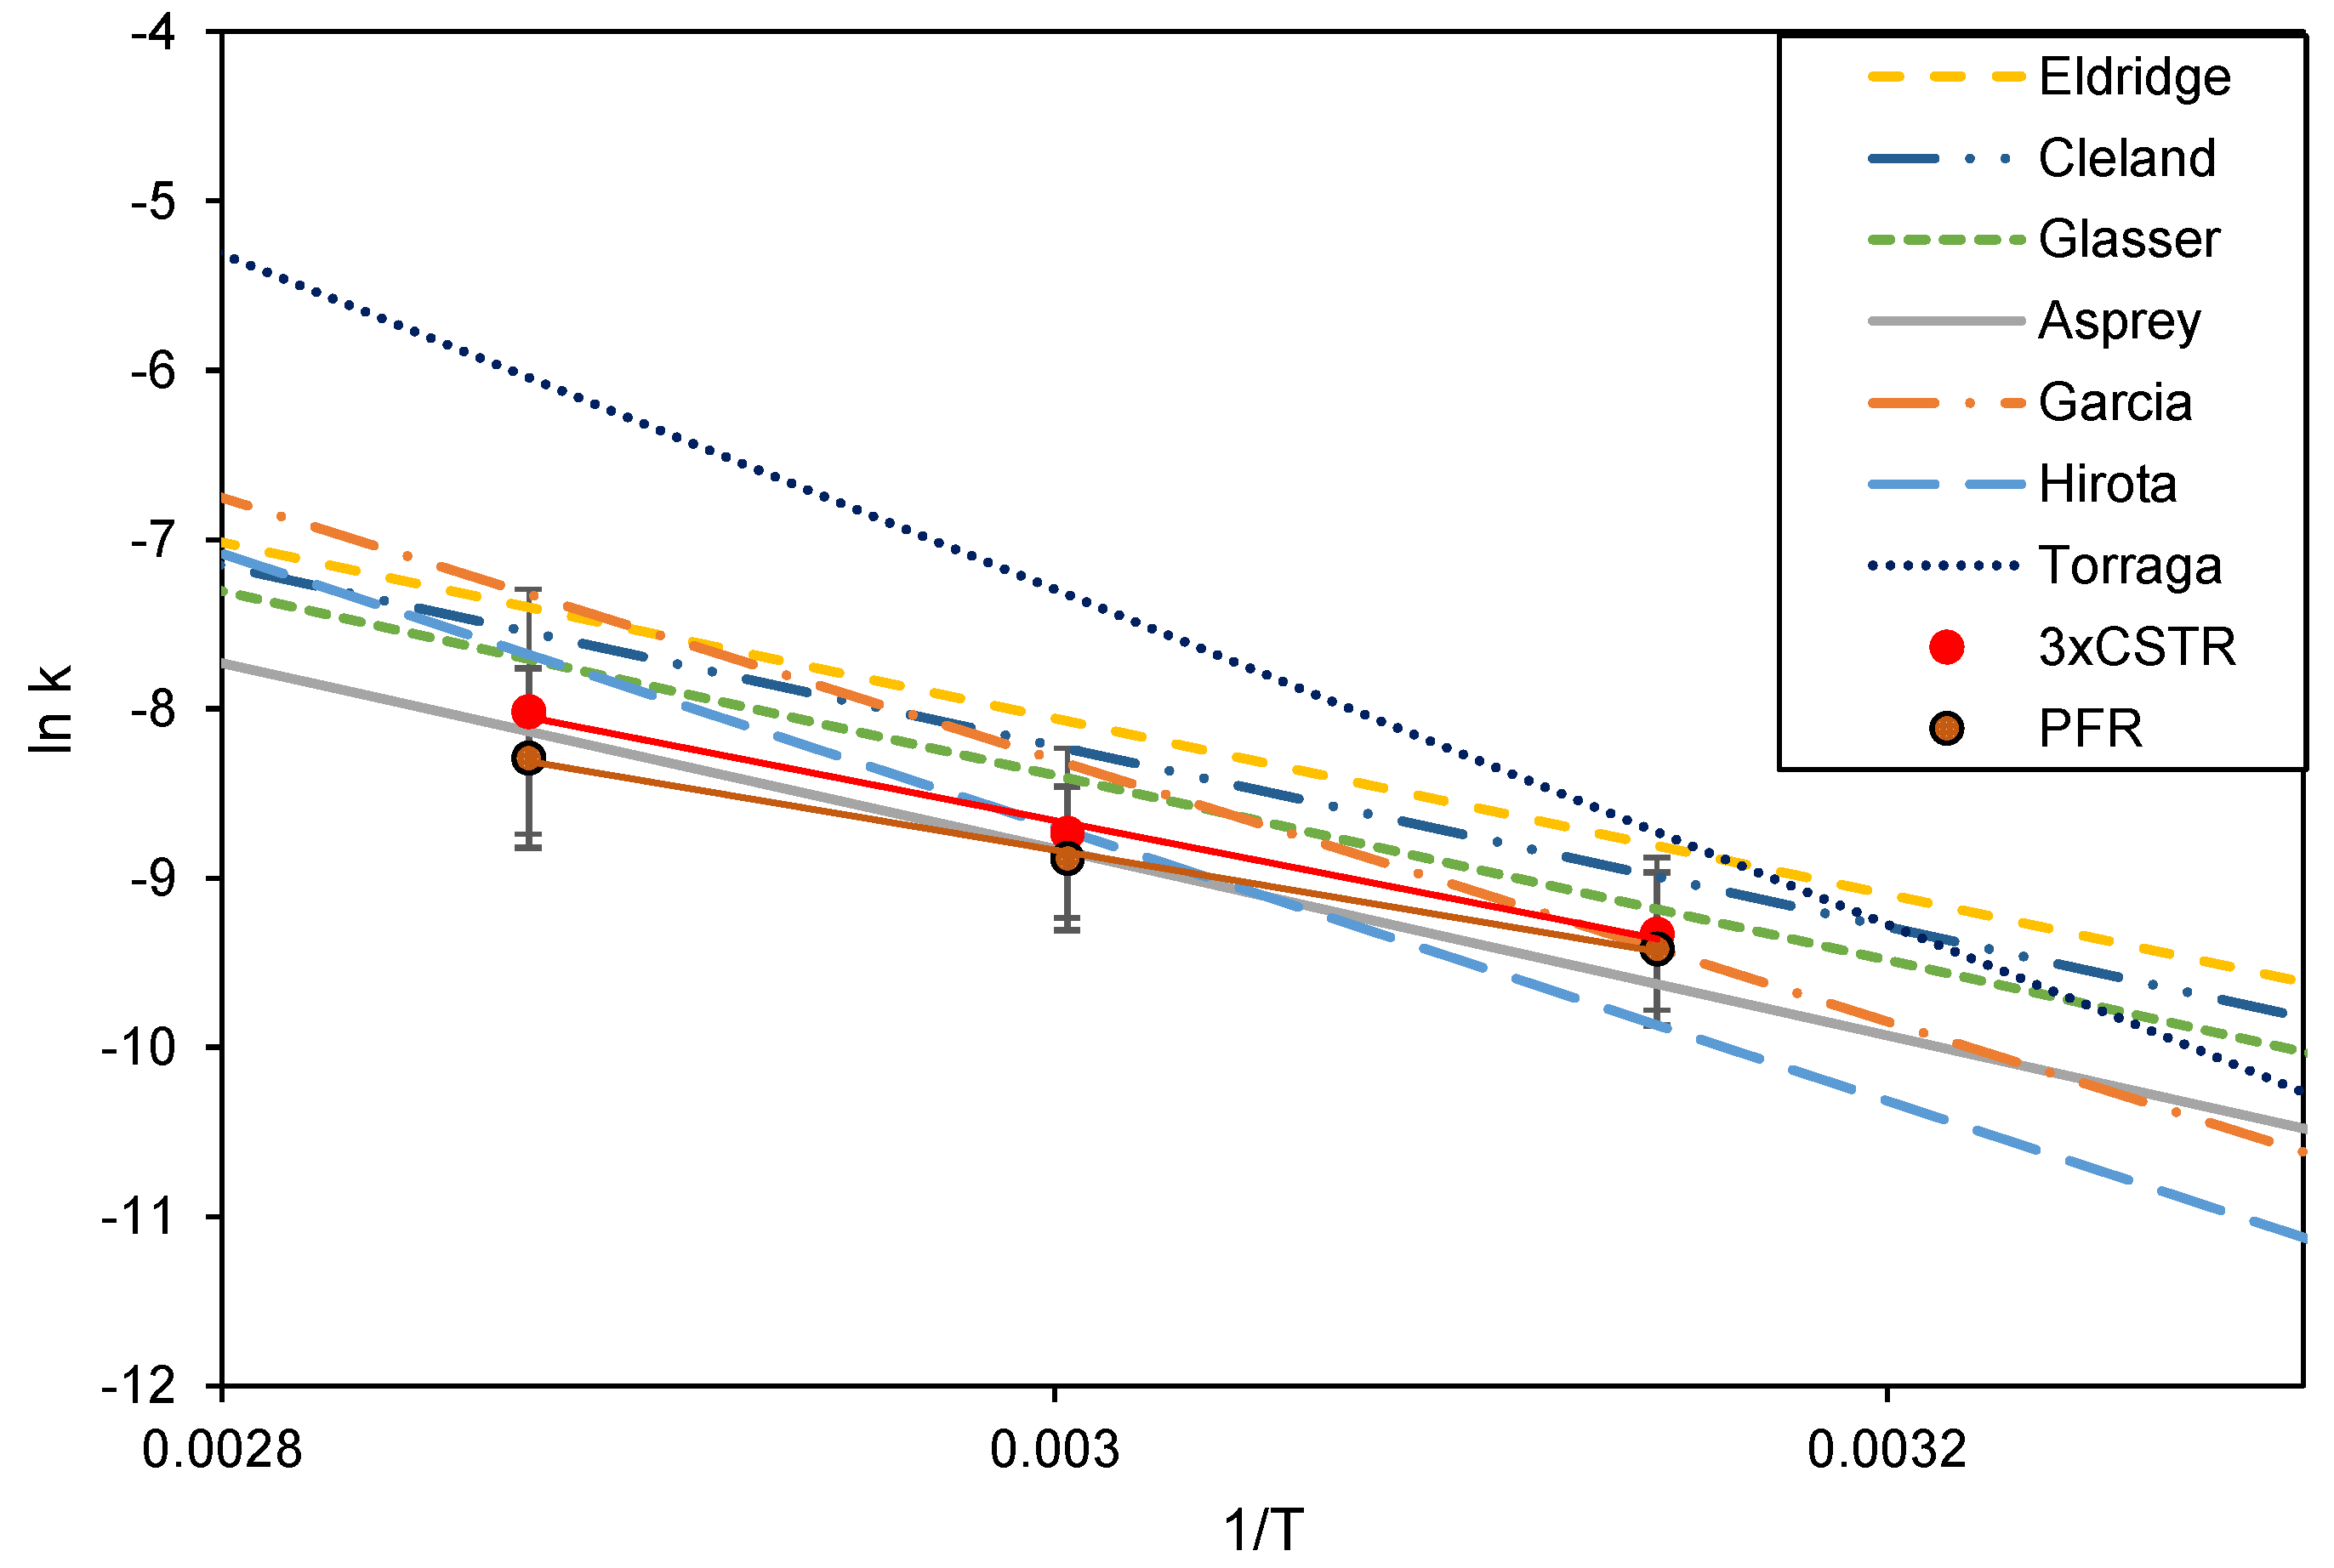
The Arrhenius plot for reaction rate constants (k) calculated from experimental data in Figure 8, assuming the reactor to function as a PFR or as three CSTRs in series, together with the literature data from Figure 4.
Reaction equations with reaction rates for all modeled reactions. A, B, and C are reactants with , P is the desired product, and S is the unwanted side product. Conversion is calculated with (with A:P = 1:1) for residence times of in (each) CSTR and in PFR [18].
Reaction equations with reaction rates for all modeled reactions. A, B, and C are reactants with , P is the desired product, and S is the unwanted side product. Conversion is calculated with (with A:P = 1:1) for residence times of in (each) CSTR and in PFR [18].
| 1. First-order reaction | ||
| 2. Equimolar second-order reaction | ||
| 3. General second-order reaction | ||
| 4. Equilibrium reaction | ||
| 5. Reaction in series | ||
| 6. Reaction in parallel |
Table 2.
Arrhenius parameters from the literature for the hydrolysis of acetic anhydride, calculated with second-order kinetics. The reaction rate constant can be calculated with and this equation can be linearized with where k = reaction rate constant, A = Arrhenius constant, Ea = activation energy, R = gas constant, and T = temperature.
| Reference | Ea (kJ/mol) | ln(A) (L/(mol/s)) | Method |
|---|---|---|---|
| Eldridge and Piret (1950) [23] | 43.2 | 7.5 | Titration |
| Cleland and Wilhelm (1956) [24] | 44.4 | 7.8 | Titration |
| Glasser and Williams (1971) [25] | 45.3 | 8.0 | Calorimetry |
| Asprey et al. (1996) [26] | 45.6 ± 0.6 | 7.7 ± 0.4 | Calorimetry |
| Hirota et al. (2010) [27] | 67.2 ± 1.4 * | 15.6 ± 0.6 * | Calorimetry |
| Torraga et al. (2019) [28] | 82.4 ± 12.4 * | 22.4 ± 4.8 * | Calorimetry, NIR, and UV-vis |
| Garcia et al. (2021) [29] | 64.4 ± 1.5 | 14.9 ± 0.6 | Calorimetry |
| Average (±95% interval) | 56.1 ± 36.3 | 12.0 ± 13.7 |
Calculated conversion for the combination of three CSTRs and a PFR in different sequences. For the initial concentrations, the reaction rate constant and residence time, reaction variables were used that led to the highest difference in conversion between PFR and CSTR, as listed in the caption of Figure 5. These conversions are 0.876 for a single PFR and 0.790 for three CSTRs. Colored bars are a visualization of the reactors used in the calculations, PFR in blue and CSTR in orange. The maximum error is equal to the largest difference between two sequences divided by the average value.
Calculated conversion for the combination of three CSTRs and a PFR in different sequences. For the initial concentrations, the reaction rate constant and residence time, reaction variables were used that led to the highest difference in conversion between PFR and CSTR, as listed in the caption of Figure 5. These conversions are 0.876 for a single PFR and 0.790 for three CSTRs. Colored bars are a visualization of the reactors used in the calculations, PFR in blue and CSTR in orange. The maximum error is equal to the largest difference between two sequences divided by the average value.
Arrhenius parameters calculated from the reaction rate constants in Figure 9. Calculated parameter values are ±95% confidence interval.
Arrhenius parameters calculated from the reaction rate constants in Figure 9. Calculated parameter values are ±95% confidence interval.
| Calculation Method | Activation Energy Ea (kJ/mol) | ln(A) (L/(mol/s)) |
|---|---|---|
| Three CSTRs | 41.3 ± 17.5 | 6.3 ± 6.3 |
| PFR | 35.2 ± 14.6 | 3.9 ± 5.3 |
| Average | 38.3 ± 10.3 | 5.1 ± 3.7 |
| Average of the literature values (Table 2) | 56.1 ± 36.3 | 12.0 ± 13.7 |
Disclaimer/Publisher’s Note: The statements, opinions and data contained in all publications are solely those of the individual author(s) and contributor(s) and not of MDPI and/or the editor(s). MDPI and/or the editor(s) disclaim responsibility for any injury to people or property resulting from any ideas, methods, instructions or products referred to in the content. |
Source link
Petra Meeuwse www.mdpi.com

