1. Introduction
The United Arab Emirates (UAE) faces some of the most challenging agricultural conditions globally, with the summer temperatures often exceeding 50 °C and prolonged heatwaves lasting several weeks. These extreme heat conditions are compounded by scarce water resources, with available groundwater frequently exhibiting high salinity levels [
1,
2,
3]. The combined impact of high temperatures, intense solar radiation, and saline water creates an inhospitable environment for most conventional crops globally. These factors contribute to the UAE’s heavy reliance on agricultural food imports, which account for approximately US
$ 2.28 billion [
4]. This heavy reliance on imports poses a significant economic burden and makes the nation highly vulnerable to fluctuations in global food markets. As the nation strives to enhance its food security and reduce vulnerability, it must explore resilient crop alternatives that can thrive under such unique environmental conditions. One such alternative is promoting millet crops, which are more efficient in photosynthesis (C
4) and can thrive under adverse climatic conditions, including drought and salinity.
Proso millet (
Panicum miliaceum L.), traditionally grown in arid and semi-arid regions, exhibits exceptional resilience to abiotic stresses, including drought, salinity, and low soil fertility, making it an ideal crop for sustainable agriculture in these challenging climates [
5]. Proso millet has been adapted to marginal lands of rainfed agriculture systems characterized by low rainfall (100–400 mm) and high temperatures for food or feed production in arid and semi-arid regions of China, India, Africa, Russia, Nepal, and the Pacific Northwest (PNW) region of the United States [
6,
7,
8,
9]. It is cultivated globally across diverse regions, with significant production areas in China, India, the USA, and Eastern Europe [
10,
11]. Known for its short growing season (60–90 days), proso millet is used as a catch crop before planting the cool season crops such as wheat [
12] and in rotation with sunflower and maize [
13]. Country-level production data on proso millet production are limited, as the statistics for this crop are often grouped with other millets. Consequently, obtaining accurate figures for specific countries, particularly those in arid regions, can be challenging.
Proso millet is a valuable option for resource-poor farmers due to its minimal input requirements. It delivers high nutritional value, with 11–12% protein, 8–9% dietary fiber, and essential vitamins and minerals [
5,
14], making it suitable for both human consumption and animal feed. Its nutritional profile emphasizes its role in enhancing food security and addressing malnutrition. Furthermore, incorporating proso millet into local agricultural practices aligns with the UAE’s National Food Security Strategy, which aims to foster sustainable agricultural development and enhance domestic food production [
15].
This research aimed to evaluate a diverse panel of proso millet genotypes under field conditions, applying various stress treatments across the normal and summer seasons. This study sought to enhance food security and promote self-sufficiency in these water-scarce environments by identifying resilient varieties capable of thriving in the UAE’s challenging environment. The successful cultivation of proso millet could mitigate the import burden and contribute to a diversified agricultural landscape less dependent on traditional crops, paving the way for a more sustainable and resilient food system in the UAE. To ensure optimal crop performance and yield in the UAE’s challenging climate, it is crucial to identify proso millet genotypes that exhibit superior salinity, water-stress, and heat-stress tolerance.
Each test environment in this study provided insights into the phenotypic performance of genotypes under specific stress conditions. During the normal season, ENV1 represented ideal conditions with no stress (100% irrigation), ENV2 imposed only water stress (50% irrigation), and ENV3 applied salinity stress. In the summer, ENV1 was structured to assess genotypes under heat stress alone (100% irrigation; no water stress); ENV2 combined water (50% irrigation) and heat stresses, while ENV3 evaluated the effects of heat, water, and salinity stresses. This combination of treatments will provide researchers with a comprehensive understanding of genetic variation within the tested genotypes, facilitating the identification of genotypes suited to specific or combinations of stresses.
This approach is essential to optimize proso millet’s productivity and ensure its role as a sustainable food source in regions with adverse climatic conditions, such as in the Gulf Cooperation Council countries (GCC). Multiseasonal or location testing of proso millet accessions plays a crucial role in varietal development programs, focusing on the agronomic superiority of new accessions, particularly in grain and fodder yield. However, limited emphasis is often placed on understanding the accession’s interaction with diverse target environments, which can be unpredictable. The development of biplot methodology, especially AMMI and GGE biplots, has simplified complex GEI visualization, allowing researchers to observe genotype and environment interactions in a clear, graphical format [
16,
17,
18]. By introducing climate-resilient proso millet genotypes, our research can significantly impact the UAE’s food production, reduce import dependency, and contribute to a more sustainable and resilient food system.
2. Materials and Methods
2.1. Study Area and Soil Analysis
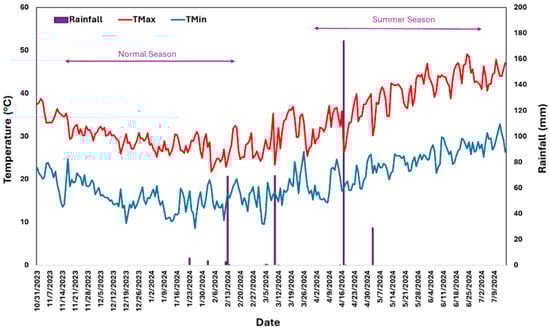
The experiments were conducted under field conditions at the International Center for Biosaline Agriculture (ICBA) in Dubai during the 2023–24 (November to February) and 2024 (Apr–Jun) growing seasons. ICBA is 34 m above sea level, with geographic coordinates of 25°09′ N latitude and 55°39′ E longitude. Dubai has a hot desert climate classified under the Köppen climate classification as BWh (arid, desert climate). High temperatures, minimal rainfall, and intense solar radiation characterize this climate. Summer (May to September) is extremely hot, with average daytime temperatures often exceeding 40 °C and frequently reaching above 45 °C and nighttime temperatures rarely falling below 30 °C. Winter (November to February) is milder, with temperatures ranging between 14 °C and 25 °C (57 °F to 77 °F). However, extremes can dip below 10 °C (50 °F) at night in rare cases (
Figure 1). The average annual rainfall is extremely low, typically around 100 mm annually. Most rainfall occurs during the winter months, between December and March, though it is highly erratic and often in the form of brief showers or thunderstorms. The soils of Dubai are primarily arid and sandy, typical of desert regions, with low organic matter content and limited water retention capacity. They belong mainly to the Aridisols soil orders, as defined by the USDA soil taxonomy. These soils dominate the UAE’s landscape and are common in dry regions with minimal organic content. They are characterized by low fertility, high salinity, and poor moisture retention due to the sandy texture. Due to high evaporation rates, salts accumulate in the upper soil layers, leading to saline conditions that challenge crop growth without proper management.
Soil data were collected in the experimental site using an Agile Camp soil auger of 1 m length. Two representative samplings were selected for freshwater treatment and one for salinity. Soil samples by horizon layer were collected and analyzed for chemical and physical characteristics. Soil layer information regarding bulk density, pH, soil texture, soil organic carbon (SOC), and soil hydraulic properties are shown in
Table 1. The bulk density was estimated by the Core method [
19], pH and EC by the Saturated soil paste method [
20], SOC by Walkley [
21], and FAO [
22] methods and soil texture by Pipette method [
23]. The soil profile in the freshwater zone tends to have a lower sand proportion than in the salinity zone. The Soil Organic Carbon (SOC) in the top layer is 0.89% and 0.78% in the fresh and saline soil, respectively. During the field experiments, three fertilizer doses were applied using fertigation to ensure consistent nutrient availability. The first dose, consisting of a complex fertilizer, was applied 20 days after sowing (DAS) at a rate of 60 kg/ha. The second dose, using Urea, was applied after 30 DAS at the same rate of 60 kg/ha. The final dose, comprising a complex fertilizer, was applied on 40 DAS, also at a rate of 60 kg/ha. These fertilization practices ensured adequate nutrient supply during the experimental period, supporting plant growth and development under the applied stress conditions.
2.2. Plant Materials
A set of 24 genotypes was carefully selected based on yield performance and flowering time from a genebank characterization program that screened over 80 germplasm accessions stored at the ICBA genebank. Pure seeds collected from single plants of each genotype during the 2022–23 season in the germplasm characterization nursery were used in the current experiment. Details on genotype designation, ID, and respective origins are provided in
Table S1. No special permissions were required to use these genotypes, as they were sourced through ICBA’s genebank under the Standard Material Transfer Agreement (SMTA) of the International Treaty on Plant Genetic Resources for Food and Agriculture (ITPGRFA) of the FAO.
2.3. Treatments and Experimentation
The experiment was conducted over two seasons: the normal (November–January/February 2023/24) and the summer (April–June/July 2024). In each season, genotypes were evaluated under three treatments: fresh water with 100% irrigation (ENV1), fresh water with 50% irrigation (ENV2), and saline water with an electrical conductivity of 10 dS/m (ENV3). The experiments followed a randomized complete block design (RCBD) with three replications. Each plot consisted of two rows, each 3 m long, with 30 cm spacing between rows and 25 cm between plants. Irrigation was managed using a drip irrigation system connected to an automated Supervisory Control and Data Acquisition (SCADA) system to control water quantity and quality (ICBA) precisely. Drip Irrigation system of the plots was controlled by SCADA system, which consists of sensors and smart flowmeters that control the required amount of water to the exact plot in exact time. The system also works on 3.5 bars constant pressure. Inline drip tubing with 4LPH discharge was used in the experiment. Eurodrip has pressure compensating emitters which has the same discharge between 1 and 4 bar operating pressures, even though the lateral line for risers were kept at a diameter of 50 mm for an even distribution of water to the extreme end of the drip line. Compression male adapters were used instead of gromets to avoid any type of leakage in the system. Regular inspections were carried out by an irrigation team for leakage. Discharge of emitters were also measured by selecting random emitters in the start, mid, and last emitters of a polyline. Presowing irrigation was applied one day before sowing. In each plot, 2–3 seeds were sown at each dripper on a flat sand bed at a depth of 1.5 cm. A single weeding operation was performed 30 days after sowing across all treatments in both seasons. Irrigation quantities were based on crop coefficients derived from evapotranspiration measurements under local conditions. During the normal and summer seasons, 5.33 mm and 6.40 mm of water were supplied daily for ENV1 and ENV3, respectively. For ENV2, the irrigation was set at half the amount provided to ENV1 or ENV3 (
Figure S1).
2.4. Crop Water Requirements
The irrigation requirement was calculated by using the FAO Penman–Monteith equation [
24]
where the following are represented: ETo is the reference evapotranspiration [mm day−1]; Rn is the net radiation at the crop surface [MJ m−2 day−1]; G is the soil heat flux density [MJ m−2 day−1]; T is the air temperature at a 2 m height [°C]; u2 is the wind speed at a 2 m height February; es is the saturation vapor pressure [kPa]; ea is the actual vapor pressure [kPa]; es − ea is the saturation vapor pressure deficit [kPa]; D is the slope vapor pressure curve [kPa °C−1]; and g is the psychrometric constant [kPa °C−1].
Daily meteorological data from the ICBA weather station were used to calculate ETo, including daily maximum (Tmax) and minimum (Tmin) air temperature, mean wind speed (u2), maximum (RHmax) and minimum (RHmin) relative humidity, and net radiation (Rn).
Daily ETo was calculated over the last 5 years, and the average of these daily values was used to determine the crop evapotranspiration (ETc):
The calculation of ETc involved identifying specific crop growth stages and the duration of each growth stage. The crop coefficient (Kc) values were obtained from the FAO 56 guidelines, with values adjusted for different crop growth stages.
2.5. Application of Saline Water for Irrigation
Two sources of water were available for irrigation. The first source was fresh water supplied by DEWA (Dubai Electricity and Water Authority), with a salinity level of 0.2 dS/m. The second source was groundwater, with a high salinity level of 23 dS/m. For the experiment, the crop was irrigated with water at a target salinity of 10 dS/m, achieved by mixing fresh and saline water using a specific mixing formula.
Phenotypic data were recorded on a plot basis for each replication, capturing the following traits: days to flowering (DF), days to maturity (DM), plant height (PH), green fodder yield (FY), grain yield (GY), chaffy grain yield (CGY), and 1000-grain weight (TGW) or grain size. Flowering was recorded when 50% of the plants in a plot showed panicle emergence, while maturity was noted when 50% of panicles in a plot had reached physiological maturity. The PH and GY were measured when the plants in each plot reached maturity. The mature panicles were hand-threshed and cleaned by winnowing.
High temperatures during the summer season led to the formation of chaffy or unfilled grains in the panicles across genotypes. Both GY and CGY were converted to kg/ha for analysis.
2.6. Statistical Analysis
Data analysis was conducted using R statistical software version 4.4.1 [
25] and Python programming language version 3.12.6 [
26]. The main effects of genotype, environment (treatments), and genotype-by-environment (G × E) interaction were estimated through a combined analysis of variance (ANOVA) for both the normal and summer seasons. The ANOVA model included replication (REP), genotype (GEN), environment (ENV), and their interaction as factors, using the formula Trait ~ REP + GEN × ENV. Python’s statsmodels v0.14.3 package [
27] was employed for model fitting, following standard procedures described by [
28]. This analysis treated genotypes as fixed variables, while environments were treated as random variables. The significance of effects was evaluated based on
p-values, with significance levels indicated by stars (* for
p < 0.05, ** for
p < 0.01, *** for
p < 0.001). The results were summarized, and their contributions to the total sum of squares (TSS%) were calculated. Significant G × E interactions were observed for the target trait in the ANOVA, prompting further analysis using additive main effects and multiplicative interaction (AMMI) and genotype × environment (GGE) biplots to identify high-performing, stable, and environment-specific genotypes under both seasonal conditions at the target location. The original datasets underwent quality checks before AMMI and GGE biplot modeling in RStudio, as developed by the R Core Team [
29]. Multivariate stability analysis was performed on GGE biplots and AMMI to graphically interpret the G × E interactions, enabling the ranking of genotypes and environments based on both mean performance and stability [
18].
Due to extreme variability in phenotypic data across and within treatments during the summer season, primarily driven by cumulative water stress, salinity, and repeated episodes of heat stress, grain yield data were standardized. Yields ranged from 0 to 100 kg ha−1 under salinity treatment, 0 to 200 kg ha−1 with 50% irrigation, and 0 to 810 kg ha−1 with 100% irrigation. This high variability caused genotypes to cluster closely at the origin in the GGE biplot, limiting interpretability. To address this, z-score normalization was applied to standardize the data. This method transforms data so that they have a mean of 0 and a standard deviation of 1, transforming each value Z as follows:
where the following is represented:
X is the original data point.
μ is the mean of the dataset.
σ is the standard deviation of the dataset.
Z is the standardized value, representing how many standard deviations the original value is from the mean.
Standardization was used to eliminate the effect of differing scales while preserving the original data distribution, maintaining the original shape of the data distribution, and being especially useful when the data follow a normal (Gaussian) distribution [
30,
31].
4. Conclusions
The study highlights the significant impact of heat, drought, and salinity stress on proso millet yields, with drastic reductions observed during the summer season, particularly under combined stresses. Genotypes such as G22 showed high stability under optimal conditions, while G15, G24, and G7 exhibited specific adaptability to stressed environments. Critical growth stages like booting, panicle emergence, and flowering were most affected, leading to increased chaffy grain production and reduced grain yields. Despite these challenges, resilient genotypes like G7, G10, and G12 maintained relatively high yields, demonstrating their potential for stress-prone environments. These findings underscore the importance of developing stress-resilient cultivars with enhanced heat and salinity tolerance to ensure yield stability in regions vulnerable to climate variability. During the normal season, temperatures were moderate (Tmax: 29.5 °C and Tmin: 16.4 °C), while the summer season experienced extreme heat (Tmax: 40.3 °C and Tmin: 24.8 °C), with peaks reaching 49.2 °C. The reproductive phase was particularly vulnerable, with 88% (62 out of 70 days) of this period experiencing surface maximum temperatures above 40 °C. These extreme conditions coincided with critical growth stages, significantly reducing 1000-seed weight, grain yield, and fodder yield while increasing chaffy grain production. The correlation analysis highlights key trait–yield relationships in proso millet across diverse environments. In the normal season, GY strongly correlated with FY and PH, emphasizing the importance of biomass and plant height for yield. TGW also contributed to GY in stressed environments, reinforcing its role in yield resilience. Under summer stress, delayed maturity negatively impacted GY, while TGW remained a key positive driver. The moderate positive correlation between GY and CGY under stress suggests resource allocation trade-offs, with non-productive grains reducing efficiency. These insights underline the need to prioritize traits like biomass, plant height, and TGW while minimizing chaffy grains for breeding stress-resilient proso millet. Developing mapping populations from the identified stress-tolerant and sensitive genotypes will enable the detection of large-effect QTLs, which are promising candidates for enhancing stress tolerance in proso millet improvement programs. Additionally, multilocation testing of these genotypes will improve our understanding of target population environments (TPEs) and optimize production areas.