1. Introduction
Mesenchymal stem cells (MSCs) derived from various tissues are crucial resources for regenerative medicine and serve as products for cell and/or gene therapy for tissue engineering [
1]. Together with their relatively easy availability, lower donor morbidity, and ability to support in vitro expansion, MSCs can release trophic and immunomodulatory factors, which are highly desirable for the treatment of various diseases [
2]. They can self-renew and maintain their differentiation potential even after multiple passages in culture. Compared with those in other human tissues, human adipose tissue-derived MSCs (hADSCs) are abundant, can be isolated in significantly larger quantities—approximately 500 times more than bone marrow—and can be obtained from tissues discarded after lipoaspiration procedures. Additionally, hADSCs have been reported to exhibit similar immunomodulatory effects to those of bone marrow-derived MSCs [
3,
4].
In vitro and in vivo studies are needed to better understand the therapeutic effects of utilizing MSCs in regenerative medicine [
5]. Developing mechanisms to monitor cells after transplantation may provide valuable information on administration routes, biodistribution, cell dosage, and cell survival. The incorporation of nanoparticles into stem cells in vitro followed by tracking in vivo could be a promising approach to address new insights into unanswered questions [
6]. Among these nanoparticles, superparamagnetic iron oxide nanoparticles (SPIONs) stand out as an ideal candidate for this purpose due to their unique properties.
SPIONs are nanostructured materials whose movement can be controlled in the presence of a magnetic field. The basic composition of these materials usually consists of iron oxides, such as magnetite or maghemite [
7]. These nanoparticles can be characterized by their size, superparamagnetic behavior, and traceability via magnetic resonance imaging (MRI). They are considered great tools for cell tracking due to their biocompatibility with cells and low synthesis cost [
8,
9]. Several types of SPIONs can be endocytosed by cells for subsequent tracking; they can be of different sizes, coated or surface-loaded, or functionalized with fluorescent components or markers [
10]. Fluorophore-conjugated nanoparticles allow multimodal tracking because they can be visualized by an in vivo imaging system (IVIS) in addition to MRI. Each of these nanoparticle components has different advantages and disadvantages, so a nanoparticle with double labeling is highly relevant, mainly in preclinical studies [
11].
Fluorophores are cost-effective and enable highly sensitive detection of labeled cells. However, there are limitations to these methods, including low spatial resolution and limited tissue penetration when using the IVIS technique, restricting their application in small animals [
12,
13]. On the other hand, the magnetic component offers greater availability and clinical applicability, providing high spatial resolution and allowing simultaneous acquisition of patient functional data with MRI tracking. However, it has a lower sensitivity for detecting labeled cells than fluorescent labeling [
14].
It is essential that nanoparticle treatment does not induce cytotoxicity in cells, preserving their therapeutic potential. At the same time, it is important that a sufficient number of nanoparticles are incorporated into the cells to ensure adequate imaging contrast without compromising their viability. For clinical application, it is equally important that labeled cells maintain their therapeutic properties, cause no harm to the patient, and allow non-invasive in vivo tracking [
14,
15]. Assessment of the effectiveness of nanoparticle labeling and the effects on cellular cytotoxicity would contribute to possible clinical translation of this technique.
Molday ION Rhodamine B (MIRB) nanoparticles are commercially available SPIONs used for labeling and monitoring transplanted cells in preclinical studies. Although MIRB nanoparticles, with a size of 35 nm, are characterized by the manufacturer and classified as ultrasmall SPIONs, there is a lack of studies providing detailed characterization [
16]. The present study characterized MIRB nanoparticles and introduced a novel approach by combining hADSCs with MIRB as a possible cell-tracking system post-transplantation. It is the first to evaluate the biocompatibility parameters of MIRB nanoparticles for hADSCs. We provided valuable insights into the impact of these nanoparticles on MSCs, particularly concerning cell proliferation.
2. Materials and Methods
2.1. Cell Isolation and Characterization
The hADSCs were isolated from adipose tissue aspirates from a healthy donor at the University Hospital of the Universidade Estadual do Rio de Janeiro, Brazil. The study was approved by the Health Care Ethics Committee of the UNIGRANRIO (references 46799215.1.0000.5283) in accordance with the Declaration of Helsinki. As described previously [
15], briefly, the adipose tissue was minced and digested with 1 mg/mL collagenase type I (Sigma–Aldrich, St. Louis, MO, USA) at 4 °C for 8 h (h) and then washed in phosphate-buffered saline (PBS 0.01 M). After passing through 100 µm cell filters, the cells suspended in the culture medium were centrifuged. The cell pellet was resuspended in Dulbecco’s modified Eagle’s medium: nutrient mixture F-12 (DMEM/F12; Gibco, Invitrogen Corporation, Carlsbad, CA, USA) supplemented with 10% fetal bovine serum (FBS; Gibco, Invitrogen Corporation, Carlsbad, CA, USA) and antibiotics. The cells were maintained at 37 °C in a humidified atmosphere of 5% CO
2 and 95% air. For routine culture, hADSCs were cultivated in DMEM/F12 supplemented with FBS without antibiotics and trypsinized with TrypLE solution (Gibco, Invitrogen Corporation). We analyzed the presence of microorganisms using the automated instrument BACTEC™ FX BD (Becton, Dickinson and Company, Franklin Lakes, NJ, USA) and the presence of mycoplasma using the MycoAlert Plus Kit (Lonza, Basel, Switzerland). Characterization of hADSCs was performed by flow cytometry using the surface markers CD105, CD73, CD90, CD45, CD34, and HLA-DR (Becton, Dickinson and Company) as part of the minimum criteria for defining multipotent mesenchymal stromal cells [
17].
2.2. Characterization of MIRB NPs
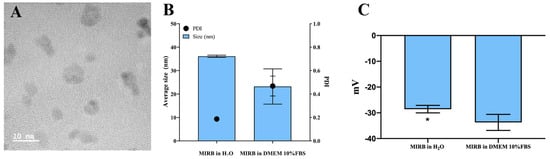
In the present study, we used MIRB (BioPAL, Inc., Worcester, MA, USA) nanoparticles, a commercially available SPION with an average size of 35 nm, functionalized with rhodamine B. According to the manufacturers, MIRB nanoparticles have a concentration of 2 mg/mL with a zeta potential (ζ (mV)) of ~+31 mV and an iron oxide core with a diameter of 8–10 nm and are surrounded by a dextran matrix. The MIRB parameters were analyzed by evaluating the MIRB size distribution through dynamic light scattering (DLS) to determine the hydrodynamic diameter (HD) using a ZetaSizer Nano ZS (Malvern Instruments GmbH, Malvern, Worcestershire, UK). DLS measurements were performed at 25 °C using standard 10 mm disposable optical polystyrene cuvettes. Electron microscopic analysis was performed using a transmission electron microscope (Tescan VEGA 3 LMU, Brno, Czech Republic). A drop of the aqueous solution of MIRB nanoparticles was placed on a carbon-coated copper grid and air-dried.
2.3. Labeling of Cells with MIRB
hADSCs were seeded in different culture flasks at a density of 1.05 × 10⁴ cells/cm2 and treated with 25 μg/mL MIRB overnight (for approximately 18 h) in the presence of FBS. After this period, the control and treated cells were washed 3 times with PBS and used for different experiments.
2.4. Internalization of MIRB in hADSCs
After treatment, the cells were fixed with 2.5% glutaraldehyde in 0.1 M sodium cacodylate buffer (pH 7.2) for 2 h. Subsequently, the tissues were postfixed for 30 min in a mixture of 1% osmium tetroxide and 2.5% glutaraldehyde in 0.1 M sodium cacodylate buffer (pH 7.2). The pellet was dehydrated in increasing concentrations of ethanol (50, 70, 90, and 100%) and embedded in epoxy resin. Finally, ultrathin slices (approximately 60 nm) were cut in a PT-PC ultramicrotome (RMC Boeckeler-New Wales, Australia) and counterstained in a 5% uranyl acetate solution. Then, in a lead citrate solution, TEM images were taken with a Tescan VEGA 3 LMU Scanning Electron Microscope operating in STEM mode at 30 kV and a JEOL 2100F HRTEM (Jeol Ltd., Tokyo, Japan) at 200 kV.
2.5. Evaluation of Labeling Efficacy
The efficacy of MIRB-labeled cells was assessed using a Prussian blue kit (Sigma–Aldrich). The kit consists of two basic steps: 10 min in potassium ferrocyanide and hydrochloric acid solution and 5 min in pararosaniline. The hADSCs were stained with 1% acid fuchsin (Sigma–Aldrich) for 10 min and washed with PBS. Then, eight random photographs were taken using a NikonEclipse TS100 inverted microscope (Motic Images Plus 3.0 software) at 10× magnification and manually quantified using ImageJ software 1.54G (Wayne Rasband, National Institutes of Health, Bethesda, MD, USA). Cells were also grown on coverslips to assess the efficacy of the fluorescence. The cells were fixed with 4% formaldehyde (Sigma–Aldrich), and the nuclei were stained with DAPI (Sigma–Aldrich) and mounted. Eight random images at 20x magnification were acquired using a DMI 6000 inverted fluorescence optical microscope for counting.
2.6. Effect of MIRB on Viability
Cellular viability was assessed 1 to 3 days after MIRB exposure using a CellTiter 96® AQueous Non-Radioactive Cell Proliferation Assay (MTS; Promega Corporation, Madison, WI, USA) according to the manufacturer’s instructions. Briefly, MTS was diluted in culture medium and incubated with the cells at 37 °C and 5% CO2 for 2 h. The absorbance was measured at 490 nm using a Multiskan GO (Thermo Scientific, Waltham, MA, USA). The following different controls were used: a negative control with dead cells (incubated with 1% X-Triton X-100 (Sigma–Aldrich) for 20 min); a negative control (treated with pure PBS); an interference control (incubated with MIRB in cell-free culture medium); and a blank control (with MTS reagent only). The blank control was used to subtract all the mean values found in the tested samples.
2.7. Quantification of hADSCs
To count the cells, the cells were cultivated in 96-well plates for 1, 2, or 3 days (0.33 × 10
4 cells/well) or for 5 days (0.165 × 10
4 cells/well). Treated and control cells were fixed with 4% formaldehyde and stained with Prussian blue and acid fuchsin as described in
Section 2.5. Eight random photographs were taken using a Nikon Eclipse TS100 inverted microscope (Motic Images Plus 3.0 software) at 10× magnification for counting.
2.8. Differentiation Potential of hADSCs
hADSCs and MIRB-hADSCs were plated in 24-well plates until 80% confluence and divided into the following groups: control (undifferentiated control cells), dcontrol (differentiation-induced control cells), MIRB (undifferentiated MIRB-hADSCs), and dMIRB (differentiation-induced MIRB-hADSCs), with n = 3 for each group. Control and MIRB-hADSC wells were maintained in DMEN/F12 supplemented with FBS, whereas dcontrol and dMIRB were maintained in a differentiation medium throughout the experiment, as described below.
2.8.1. Adipogenic Differentiation
The adipogenic differentiation medium contained DMEN/F12 supplemented with 10% SFB, 10−6 M dexamethasone, 0.5 mM 3-isobutyl-1-methylxanthine, 200 μM insulin-transferrin-sodium selenite (ITS) in liquid media, 56 mM indomethacin and 1% penicillin/ciprofloxacin. After 21 days, the cells were fixed with 4% formaldehyde and stained with Oil Red O solution for 30 min. Eight random photomicrographs of each well were taken at 10× magnification using a Nikon Eclipse TS100 for quantification. All reagents used in this study were obtained from Sigma–Aldrich.
2.8.2. Osteogenic Differentiation
The osteogenesis medium consisted of DMEM/F12 supplemented with 10% FBS, 10−8 M dexamethasone, 50 μg/mL ascorbic acid 2-phosphate, 0.8 M β-glycerophosphate and 1% penicillin/ciprofloxacin. After 18 days, the cells were fixed in 4% formaldehyde and then stained with Alizarin Red. For quantification, all the samples were incubated in a mixture of 100% methanol and 100% glacial acetic acid and shaken at 150 rpm for 15 min. The contents of the samples were transferred to a 96-well plate, after which the absorbance was read using a Multiskan Go spectrophotometer (450 nm). All reagents used in this study were obtained from Sigma–Aldrich.
2.8.3. Chondrogenic Differentiation
For chondrogenic differentiation, the cells were resuspended in the medium at a concentration of 1.6 × 10⁷ cells/mL. The cells were subsequently grown in isolated 7 µL droplets in 24-well plates for 2 h. After this period, 350 μL of StemPro Chondrogenesis Differentiation Kit (Gibco) reagent was added to the wells. After 14 days, the cells were fixed with 4% formaldehyde, incubated with 100 μL of 3% glacial acetic acid for 3 min, and subsequently incubated with Alcian blue (Sigma–Aldrich) dye for 30 min. The cells were embedded in paraffin and cut with a microtome at a thickness of 3 μm (LeicaRM 2125RT, Leica Biosystems, Buffalo Grove, IL, USA) to record the sections.
2.9. Immunocytochemistry
Cultured cells in Nunc Lab-Tek (Thermo Fisher Scientific) were fixed with 4% formaldehyde. After washing 3 times in PBS with 0.3% Triton X-100 solution, the cells were incubated with 5% normal donkey serum (NDS; Gibco) for 30 min and then incubated with a primary anti-Ki67 antibody (1:200, rabbit monoclonal IgG; Abcam, Inc., Cambridge, UK) diluted in 5% NDS (2 h at room temperature). The slides were washed and incubated with a secondary Alexa 488 donkey anti-rabbit IgG antibody (1:100; Abcam, Inc., Cambridge, UK) diluted in 5% NDS for 1 h and 30 min. This was followed by washing with PBS. The nuclei were counterstained with DAPI, and the slides were mounted. Eight random images at 20× magnification were taken for quantification.
2.10. Statistical Analysis
GraphPad Prism 5 software (GraphPad Software, Inc., San Diego, CA, USA) was used to perform the statistical analyses. To evaluate if there was a significant difference between the experimental groups, a t-test was used for the comparison of two groups, and one-way ANOVA was used for the comparison between three or more experimental groups.
4. Discussion
SPIONs were initially designed as contrast agents for diagnostic use, but the use of these nanoparticles for cellular tracking is relatively novel. This labeling method has been severely affected by the discontinuation of commercially available SPIONs that were already approved for human use as contrast agents. Consequently, several preclinical studies have been published using SPIONs that are no longer commercially available, including studies from our research group [
13,
14,
18]. Although the MIRB nanoparticles are characterized by the manufacturer, we evaluated their properties in a culture medium supplemented with serum (rich in bovine serum albumin, BSA), as this contains components that could alter the surface charge, dispersion, and behavior of the nanoparticles. As the serum has an undefined composition, this condition is different from that analyzed by the manufacturer. Thus, in this study, we chose to evaluate the biocompatibility of a commercial SPION conjugated with rhodamine B, which is not approved for humans. The use of MIRB to label MSCs has already been carried out by other authors, but here, valuable approaches were found. The effect of MIRB on hADSCs was evaluated and revealed some extremely important discoveries regarding the effect of the nanoparticles on cell proliferation.
Andrzejewska et al. compared different techniques for labeling MSCs and demonstrated strong changes in metabolic activity after labeling the cells with CellTracker Green CMFDA reagent and genetic pre-labeling with eGFP-mRNA. In the same study, they also used MIRB and did not observe changes in viability when cells were treated with 20 μg/mL MIRB (after 6 days). The viability of the CellTracker-labeled MSCs was significantly lower after 2 and 7 days than that of the control, MIRB-transfected or eGFP-transfected cells. After 7 days, a decrease in fluorescence signal intensity was observed for CellTracker (69%) and eGFP-labeled cells (86%), which was not observed for the MIRB-treated cells (99% after 2 days and 97% after 7 days). It was suggested that MIRB is the best contrast agent for cell tracking and does not alter cell surface area, proliferation or multipotency markers [
19].
Using ADSCs from mice transfected with eGFP and labeled with 10 μg/mL MIRB, Nan et al. did not observe significant differences in cell viability as determined by MTT assay on days 1, 3, 5 and 7. However, the group treated with MIRB showed a decrease in fluorescence intensity, while eGFP fluorescence was maintained for up to 4 weeks. It is possible that the 10 μg/mL nanoparticle concentration was too low for effective screening [
20]. BioPalm, the supplier of MIRB, recommends a study as a reference for a labeling protocol in which the best dose is between 20 and 30 μg/mL MIRB overnight for a 20 h period [
21]. This concentration range did not cause damage to cellular metabolism and was efficient for cellular monitoring via MRI and fluorescence microscopy [
22,
23]. A preclinical osteoarthritis study in sheep showed that injection of 10 × 10
6 MIRB-labeled bone marrow mononuclear cells (50 μg MIRB/mL for 10 h) into the knee was sufficient to track MSCs by MRI for up to 12 weeks [
23]. The autologous transplant of bone marrow MSCs into monkeys labeled with MIRB at concentrations of 10, 20, and 50 μg/mL (for 16 h) revealed that the 20 μg/mL concentration was the most promising. This protocol preserved the cellular viability, phenotype, and differentiation capacity. Two weeks after intracerebral transplantation, MIRB-labeled MSCs could be detected through in vivo magnetic resonance imaging, fluorescence microscopy, and ex vivo Prussian blue staining [
24]. In neural cells, an interaction between MIRB (20 μg/mL) and the plasma membrane has been reported. The authors observed that internalization occurred within 2 min. Additionally, for the authors, dextran enhances the efficiency of cellular uptake by facilitating electrostatic interactions between the nanoparticles and the cell membrane of neuronal cells. It was suggested that the uptake and internalization of MIRB by neuronal cells are successful and that dextran-coated iron oxide nanoparticles are more efficiently internalized via the cargo-mediated endocytosis pathway [
25]. Based on these studies and the manufacturer’s recommendation, here, a working concentration of 25 μg/mL MIRB was established for a period of approximately 18 h. Our results confirmed that a concentration of 25 μg/mL MIRB was effective at labeling 100% of the hADSCs in culture for up to 3 days after the initial exposure. Moreover, the internalization of the nanoparticles was observed in the cytoplasm of the cells by TEM. Although this study does not specifically investigate the internalization pathway, it is widely known that iron oxide nanoparticles are commonly endocytosed by cells through mechanisms such as clathrin-mediated and caveolae-mediated endocytosis. In clathrin-mediated endocytosis, a network of proteins deforms the membrane to create vesicles that transport the nanoparticles into lysosomes, while caveolae-mediated endocytosis involves flask-shaped invaginations coated with caveolin that internalize the particles into vesicles [
22,
26,
27]. In this research, we also observed the presence of nanoparticles attached to the cellular plasma membrane, which corroborates studies that used the SPION called Resovist (Schering, Berlin, Germany) [
28].
Evaluating the influence of the culture medium on the properties of MIRB could be considered as important. Our data showed that the DH of MIRB dispersed in water was 36 nm, which is close to the 35 nm diameter specified by the manufacturer. This difference is likely due to the formation of a protein corona influenced by ions, proteins, and other components in the culture medium [
29,
30]. However, this value decreased to 23.2 nm when the nanoparticles were dispersed in the culture medium. The PdI values also varied between the analyzed groups, with the culture medium group showing a higher PdI indicating a more heterogeneous size distribution for the MIRB population; this parameter was not specified by the manufacturer. The size distribution described by the PdI indicates the nanoparticles’ uniformity. A PdI value between 0.1 and 0.25 signifies a narrow size distribution, while a PdI greater than 0.5 indicates a broad distribution [
31]. The culture medium is rich in ions, proteins and other factors that can induce the formation of protein coronas and influence these parameters [
32,
33]. BSA has been identified as a key factor in the formation of the protein corona. BSA adheres to the nanoparticle surface through surface charge affinity, preventing agglomeration by stabilizing attractive forces influenced by the pH and ionic forces in the culture medium [
34,
35]. The ionic forces, pH, and proteins determine the stability of the NP suspensions [
29]. The conventional threshold for distinguishing stable from unstable suspensions is a zeta potential of ±30 mV. Particles are generally considered stable if their zeta potentials are more positive than +30 mV or more negative than −30 mV [
34,
35,
36]. In this study, the MIRB suspensions demonstrated stability with a zeta potential of around −30 mV. However, a significant difference was observed between the suspensions in water and in DMEM with 10% FBS. The MIRB in water showed a slightly more negative potential, suggesting that the interaction with the culture medium led to a less negative zeta potential. This probably occurs due to the high presence of anions such as Cl-11, F-1, O-2, N-3 and others in culture medium, which increases the negative surface charge of MIRB [
36,
37]. Originally, the MIRBs had a zeta potential of +30 mV, but after dilution in ultrapure water and culture medium, a negative profile was observed. This can be explained by the fact that the zeta potential depends on the type of dispersant, pH, and dispersant content [
36,
37]. Nevertheless, the MIRB nanoparticles are stable at various dilutions. Further studies are encouraged to comprehensively investigate the adsorption capacity of the corona protein and its influence on the average size of MIRB, subsequently evaluating its impact on clinical research.
It is essential to ensure that nanoparticle treatment does not cause toxicity to the patient or compromise the therapeutic efficacy of the cells. Notably, the amount of nanoparticles administered for cell tracking during therapy is very low. Feridex I.V. (Bayer HealthCare Pharmaceuticals, Inc., Leverkusen, Germany) nanoparticles serve as an example despite being discontinued for economic reasons. Feridex is a clinically approved SPION used for diagnostics with a composition similar to that of the MIRB. Its package inserts report that the single dose of Feridex is 0.56 mg of iron per kg of body weight or 39 mg of iron for a 70 kg person, which is only 1/5 of the iron amount in a blood bag for transfusion. Regarding labeling of cells with SPIONs, it is estimated that the incorporation of 10 pg of iron per cell is sufficient for subsequent in vivo tracking [
38]. Assuming a therapy using 1 × 10
6 MSCs per kg of body weight, a 70 kg patient will be administered 0.7 mg of iron incorporated into the cells, which is almost 56 times less than the recommended dose for a single diagnosis [
39]. Cell labeling with nanoparticles necessitates a balance in concentration to ensure effective in vivo tracking without causing cytotoxicity. The literature suggests that concentrations above 100 μg/mL of Fe are toxic and can adversely affect cell viability and proliferation [
11,
40]. The cytotoxicity of iron oxide nanoparticles is related to their nonspecific binding to cellular components as well as their colloidal instability [
41,
42]. The most commonly used assays for studying the biocompatibility of SPIONs are lactate dehydrogenase (LDH), neutral red, and viability assays using MTT or MTS. In particular, viability assays are the most widely used methods [
39,
43].
The experiments conducted in this research revealed remarkable results, indicating that three days after treatment, MIRB nanoparticles promoted an increase in hADSC proliferation, as evidenced by the Ki67 immunostaining assay. These findings seem to diverge from most of the available literature [
19,
20,
21,
41,
44]. Although there are limited reports in the literature on this phenomenon, some studies have also shown alterations in cell proliferation caused by the incorporation of SPIONs [
42,
45]. Huang et al. showed an increase in cell proliferation and viability, suggesting that this occurs because nanoparticles may act as antioxidants, inhibiting reactive oxygen species and contributing to a more stable cellular environment [
42]. In line with this, in our study, both osteogenic and adipogenic differentiation were more pronounced in the groups treated with MIRB nanoparticles. Our interpretation is that MIRB nanoparticles accelerated cell proliferation, inducing the cells to reach confluence more rapidly. In this scenario, cell proliferation is stopped by contact inhibition, which likely triggered a differentiation process earlier than in control cells. Signaling pathways such as Hippo and TGF-β, modulated by the extracellular matrix (ECM), may be involved in this process, as suggested by Botta et al., who demonstrated the importance of ECM composition and the plasmin proteolytic cascade in regulating differentiation when cells reach confluence [
46].
In the present study, we observed that a few cells remained MIRB-positive even after 21 days in culture. However, due to the high confluence of cells, it was difficult to clearly define which ones were MIRB-positive. One of the reasons for this loss of labeling is the high rate of proliferation in vitro, as shown previously by our group. After 21 days, the number of labeled MSCs blocked for proliferation with mitomycin C was markedly greater than that of the proliferating group [
14]. Another hypothesis, using metastatic tumor cells treated with 50 μg/mL of a homemade SPION, Weis et al. evaluated the destiny of the nanoparticles for 60 h in vitro. A total of 105 cell divisions were counted, revealing that in 10% of the divisions, the SPIONs were evenly split between daughter cells, while in 52% of the cases, one daughter cell received at least 90% of the nanoparticles [
47,
48]. Interestingly, after transplantation, the cellular proliferation rate was greatly reduced, so the cells could be detected by MRI for longer periods. Using commercial SPION FeraTrack Contrast Particles (Miltenyi Biotec, Bergisch Gladbach, Germany), our group previously observed that MSCs remained labeled in the vitreous for 18 weeks after intraocular injection [
49]. Beyond proliferation, the progressive degradation of iron into paramagnetic iron-free ions may also contribute to MRI signal loss over time [
48]. Based on these findings, MIRB nanoparticles have shown great potential as screening agents for cell therapy as they can be detected noninvasively by MRI and IVIS in preclinical models, even when the number of cells labeled with nanoparticles appears to decrease.
From this, it is believed that MIRB nanoparticles are indeed potential screening agents for cell therapy and are an interesting multimodal tool. While the magnetic properties of the nanoparticles are important, this study prioritized evaluating the cytotoxicity and biocompatibility of MIRB. The present study extends the current knowledge on the use of SPIONs for labeling stem cells. This study is one of the pioneers in reporting the use of MIRB to label hADSCs, and it suggests that MIRB nanoparticles are an easy-to-use and efficient tool for labeling and tracking these cells. An increase in the proliferation rate is rare in the literature and requires thorough investigation to better understand the phenomenon itself and to determine whether this event is beneficial or detrimental to MSC-based therapy.