1. Introduction
An aptamer, derived through the systematic evolution of ligands by exponential enrichment (SELEX) [
1], is a short single-stranded nucleic acid sequence capable of binding to specific ligands due to its three-dimensional structure [
2]. Through the screening of large oligonucleotide libraries, aptamers have been successfully selected against a wide range of analytes, including metal ions [
3], small molecules [
4], proteins [
5], toxins [
6], miRNAs [
7], and even whole cells [
8]. Due to their high specificity, aptamers are widely used as recognition elements in biosensors, where their performance is closely linked to their affinity for the target ligand [
9].
The affinity of aptamers, often expressed using the dissociation constant (
Kd) [
10,
11], is a key metric for evaluating their performance. Methods such as the enzyme-linked immunosorbent assay (ELISA), surface plasmon resonance (SPR), isothermal titration calorimetry (ITC), microscale thermophoresis (MST), and fluorescence spectrometry are commonly used to determine
Kd values. However, due to differences in recognition conditions and measurement principles among these methods, variations in
Kd values with an order-of-magnitude divergence can be observed for the same aptamer [
12].
Marine toxins, produced by algae, are biotoxins commonly found in shellfish and fish, often coexisting as multiple toxins. Given their potent toxicity, aptamers have emerged as promising recognition probes for detecting these toxins. While sequences of marine toxin aptamers have been reported, studies on their binding sites and recognition mechanisms remain limited. Investigating these aspects can reveal the interaction principles between aptamers and their targets, providing a foundation for designing more efficient and specific aptamers. Systematic research in this area is of considerable scientific and practical importance.
Okadaic acid (OA), a major diarrhetic shellfish toxin, poses a significant public health risk, making its detection critical for food safety. Advancing OA detection methods is crucial for enhancing food industry practices and safeguarding consumer health. To better understand the recognition mechanisms and binding regions of aptamers, molecular docking simulations have become widely employed [
13,
14]. These simulations rely on three-dimensional structures of aptamers and ligands, but variations in software tools and parameters can lead to differing results. In this study, we used SYBYL-X [
15] and H-dock [
16] to simulate aptamer–OA interactions. The results were analyzed and validated through Förster resonance energy transfer (FRET) experiments, confirming the aptamer’s binding site.
Finally, a colorimetric detection biosensor was developed by combining gold nanoparticles (AuNPs) with the selected aptamer [
17]. The aptamer–ligand interactions modulate the salt tolerance of AuNPs, causing a visible color change in the solution. By analyzing absorbance spectra, the local concentration of OA was accurately quantified. This approach enables the rapid detection of OA, particularly in food safety applications. Overall, this study advances our understanding of aptamer–target interactions and contributes to the development of practical toxin detection methods.
2. Materials and Methods
2.1. Materials and Apparatus
All DNA sequences were synthesized by Suzhou Genewiz Biotechnology Co., Ltd. (Suzhou, China), in dry powder form and purified by high-performance liquid chromatography (HPLC) with a purity of 95%. The detailed DNA sequences are provided in
Table S1. Each aptamer was dissolved in buffer solutions as specified in the original literature for the corresponding primer and stored at −20 °C, with minimal freeze–thaw cycles to maintain stability and prevent degradation. Saxitoxin (STX), decarbamoylsaxitoxin (dcSTX), neosaxitoxin (NEO-STX), microcystin YR (MC-YR), okadaic acid (OA), dinophysistoxin-1 (DTX-1), brevetoxin-2 (BTX-2), and brevetoxin-3 (BTX-3) were procured from the National Research Council of Canada (NRCC, Halifax NS, Canada). Tetrodotoxin (TTX), microcystin LR (MC-LR), microcystin LA (MC-LA), microcystin RR (MC-RR), gonyautoxin-1/4 (GTX-1/4), and domoic acid (DA) were purchased from Pribolab Co., Ltd. (Qingdao, China). Trisodium citrate dihydrate (99.5%), NaCl (99.5%), and other inorganic salts used in buffers were obtained from Sinopharm Chemical Reagent Co., Ltd. (Shanghai, China). DEPC-treated water and HAuCl
4 (99.99%) were purchased from Sigma-Aldrich (St. Louis, MO, USA). The buffers used in this work are listed in
Table S2. Water was purified with a Milli-Q purification system (18.2 MΩ, DI water, Milli-Q) and buffers were made fresh each week.
Fluorescence intensity was measured using an EnVision® 2105 multimode plate reader (PerkinElmer, Inc., Waltham, MA, USA). MST experiments were performed using a Monolith NT.115 (NanoTemper, Munich, Germany) with Mo NT.115 capillaries. The shellfish tissue sample was homogenized using a FastPrep 24 sample preparation system (MP Biomedical, Santa Ana, CA, USA). All statistical analyses were performed using Origin 2018 software (Origin Lab, Northampton, MA, USA).
2.2. FRET-Aptamer Assay
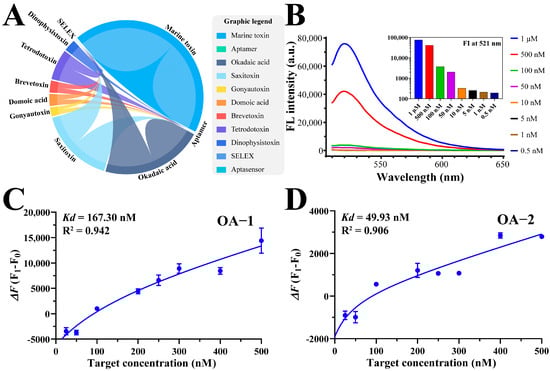
All the reported marine toxin aptamers were summarized and synthesized, and were labeled with FAM at the 5′-end and BHQ-1 at the 3′-end to construct the FRET-aptamer. Each sequence was diluted with its respective buffer and annealed with incubation at 95 °C in a water bath for 10 min followed by an ice bath for 10 min. The analyte stock solution for each aptamer was diluted to a series of concentrations of working solution (i.e., 0.5, 1.0, 2.0, 4.0, 5.0, 6.0, 8.0, and 10.0 μmol L−1). Then, 90 μL FRET-aptamer was mixed with 10 μL of different concentrations of targets, and the solution was transferred to a 37 °C incubator and incubated for 60 min in the dark. The fluorescence intensity (FI) was measured, and curve fitting, as well as data analysis, were performed to calculate the Kd values of each sequence.
2.3. Microscale Thermophoresis Assay
The aptamers were labeled with Cy5-dye at the 5′ end and kept a constant concentration of 0.1 nmol L
−1 in all MST experiments. The procedure of MST was adapted from a previous study [
18] and can be briefly summarized as follows. With the help of MO. Affinity Analysis v2.3, the concentration of Cy5-aptamer was optimized to make its FI value between 5000 and 20,000, and this concentration was used to bind with the target. The target concentration was varied by 1:1 gradient dilution 16 times. Then, the aptamer and the corresponding target solution were incubated with a mixing ratio of 1:1 for 5 min at room temperature and loaded into standard treated capillaries. The software MO. Affinity Analysis v2.3 was used for data analysis, and the curves were fitted by the
Kd algorithm.
2.4. Docking Simulation by SYBYL-X
The secondary and tertiary structures (PDB format) of aptamers were built using the Mc-fold/Mc-sym pipeline (
https://major.iric.ca/MC-Pipeline/, accessed on 8 January 2025) [
19]. The python tool was utilized for automated download and renamed for the tertiary structures (see the
Supplementary Materials, File S1). The 3D structure (mol2 format) of the target molecule was built and minimized by MM2 using Chem 3D software 20.0 [
20]. Subsequently, both aptamer and ligand tertiary structures were imported into SYBYL-X for visualization and simulation. Finally, the potential binding sites of the aptamer with ligand-specific recognition were predicted by the molecular docking module surflex-dock in the SYBYL package [
21].
2.5. Docking Simulation by H-Dock
The secondary structures (
ct file format) of aptamers were predicted by the UNAFold web server (
http://www.unafold.org/, accessed on 8 January 2025) [
22]. Then, they were imported into RNA Composer (
http://rnacomposer.cs.put.poznan.pl/, accessed on 8 January 2025) [
23] to generate the 3D structure (PDB format), and all the T bases were modified to U bases during this process. The target molecule was built using the same method as for the 3D structure. Discovery Studio 2021 [
24] was used for visualization and converting U bases to T bases. The docking between aptamers and ligands was performed by using the H-dock server (
http://hdock.phys.hust.edu.cn/, accessed on 8 January 2025) [
25], which uses an FTT-based docking algorithm.
2.6. Detection of OA
Gold nanoparticles (AuNPs) were synthesized using the classical Plech Turkevich method with slight modifications [
26]. Briefly, 0.02 g of HAuCl
4 powder was added to 200 mL of pure water and allowed to boil on a hot plate with magnetic stirring in the dark. Subsequently, 0.06 g of trisodium citrate dihydrate was accurately weighed and dissolved into 6 mL water, which was quickly injected into the boiling solution with continuous stirring and boiling for 15 min. The prepared AuNP solution was condensed by centrifugation at 10,000 rpm for 20 min, and one-fourth of the volume of the lower layer of the solution was retained, which was sonicated for 2 min and stored at 4 °C while protected from light.
The following is a brief overview of the OA detection process. First, 10 μL of OA standard solution and an equal volume of 1 μmol L−1 aptamer sequence were mixed and incubated at room temperature for 5 min. Subsequently, the mixed solution and 150 μL of the AuNP solution were incubated together for another 5 min in the dark. After 50 μL of 100 mmol L−1 NaCl was added and vortexed for 30 s, the mixture was transferred to a 96-well transparent microplate, and the absorbance at 520 nm and 650 nm was measured.
2.7. Real Sample Preparation
Fresh shellfish was bought from the local market, and the tissue was removed from the shell. A DI water rinse was performed on the shellfish tissue mass, and the excess water was removed by touching it with filter paper. An adaptation of the shellfish pretreatment procedure was established from a previous method, which can be summarized as follows. A 2.0 g sample was accurately weighed and homogenized for 30 s. Subsequently, 20 mL of methanol was added and sonicated for 5 min. Then, 1.0 mL of the extraction solution was transferred to a new centrifuge tube and supplemented with 125 μL of 2.5 mol L−1 NaOH, and the solution was heated at 76 °C for 40 min, after which we added 125 μL of 2.5 mol L−1 HCl to the mixture. Finally, the extraction solution was well mixed and filtered with a 0.22 μm filter for further experimentation.
4. Discussion
It is important to acknowledge that while the aptamer sequences used in this study were synthesized based on previously reported sequences, variations in affinity measurements can arise due to differences in experimental methodologies. In this study, the initial
Kd values for the 19 aptamers were determined using the FRET method. As a preliminary selection, fluorophore and quencher groups were positioned at the termini of the aptamer sequences. The distance between the fluorophore and the quencher is crucial for FRET efficiency and, consequently, impacts the accuracy of affinity measurements [
30]. Variations in their positioning may influence energy transfer efficiency, leading to differences in the observed
Kd values. Additionally, the optimization of aptamer concentrations in our experiments, particularly the molar ratio between the aptamer and target molecule, may have contributed to slight discrepancies when compared to the original studies. These methodological differences highlight the significance of experimental context when interpreting binding affinity results, underscoring how even minor variations in experimental conditions can lead to notable differences in the measured outcomes. Moreover, while both the FRET and MST methods are widely used to assess aptamer binding affinity, they rely on different principles and experimental setups, which can lead to variations in sensitivity and interpretation. The FRET method depends on the proximity between the fluorophore and the quencher, with fluorescence recovery linked to their spatial arrangement [
31]. This can be influenced by the aptamer’s conformational flexibility and binding-induced structural changes. In contrast, MST measures the movement of the aptamer–target complex in solution, with binding affinity inferred from changes in the complex’s thermal mobility [
32]. These methodological differences can result in consistent trends in aptamer affinity, but slight discrepancies in the measured
Kd values.
Although both methods revealed consistent trends in aptamer affinity, the minor differences in
Kd values underscore the importance of considering experimental context and methodology. Factors such as fluorophore positioning, aptamer concentration, buffer composition, and temperature conditions can all contribute to variations in affinity measurements [
33]. These findings suggest that while FRET and MST offer complementary insights into aptamer–target interactions, a comprehensive understanding of binding affinity requires the integration of multiple techniques, each with its inherent strengths and limitations. Future studies should aim to standardize protocols for aptamer labeling, concentration optimization, and experimental conditions to ensure the reproducibility and comparability of results. In addition, incorporating other validation techniques, such as surface plasmon resonance (SPR) or isothermal titration calorimetry (ITC), could further enhance the robustness of the findings and provide additional support for FRET and MST results [
34,
35]. Computational simulations, including molecular dynamics studies, can also provide insights into the structural dynamics of aptamers and their interactions with target molecules, potentially refining our understanding of their binding mechanisms [
36].
The discrepancies in binding site predictions between SYBYL and H-dock reflect their distinct methodologies and scoring principles. The SYBYL focuses on geometric optimization and conformational stability, its scoring functions tend to prioritize structural flexibility, which may not always align with the true nature of the binding interactions [
37]. While H-dock has superior ability to evaluate shape complementarity, which is critical for the precise fitting of molecular shapes, especially in nucleic acid-target interactions [
16]. The SYBYL’s shape-based similarity algorithm, optimized for small, flexible regions, identified a localized site near the 3’ end. In contrast, H-dock’s grid-based strategy predicted more dispersed binding interactions, accommodating the entire aptamer sequence. These differences emphasize the complementary nature of the two approaches and the necessity of integrating their results for a comprehensive assessment.
Experimental validation further demonstrated that OA-2’s recognition sites are dispersed throughout its sequence, aligning more closely with H-dock predictions. Attempts to truncate the aptamer revealed no improvement in affinity, suggesting that OA-2 represents an already optimized sequence. While SYBYL and H-dock provided valuable insights, the discrepancies highlight the need for more advanced docking tools capable of accommodating flexible nucleic acid structures. These findings lay the groundwork for future optimization strategies and support the robust integration of computational and experimental methods in aptamer research.
In recent years, artificial intelligence (AI)-assisted biosensing has gained significant attention due to its ability to enhance sensor performance, data analysis, and real-time detection through machine learning algorithms [
38]. Advanced techniques such as deep learning have been applied to various aspects of aptamer-based sensor development, including aptamer selection, binding site prediction, and sensor platform optimization. AI-driven methods have been successfully integrated into colorimetric biosensors for rapid visual detection and electrochemical sensors for highly sensitive and selective analyte recognition [
39,
40], demonstrating their potential to significantly improve detection accuracy, minimize false positives, and enable real-time data processing. These advancements highlight the growing synergy between AI and label-free aptasensors, paving the way for more efficient and intelligent biosensing systems. Future research should focus on refining AI algorithms specifically designed for aptamer-based sensors, broadening their applicability to complex sample matrices, and developing portable, user-friendly diagnostic platforms that can facilitate on-site and point-of-care testing.
5. Conclusions
This study utilized previously reported marine toxin aptamer sequences to conduct homogeneous fluorescence quenching screening, ultimately identifying OA-2 as the optimal template sequence through MST analysis. Building on this, binding site predictions and computer-simulated docking were performed for OA-2. By designing and testing complementary sequence fragments, the recognition region was precisely determined, providing valuable insights into the recognition mechanism of this aptamer. Furthermore, leveraging the unique structural and functional characteristics of the OA-2 sequence, a classic aptamer–AuNP colorimetric biosensor was developed. This sensor demonstrated excellent performance in detecting OA in real shellfish samples, showcasing its potential for practical applications in food safety monitoring. Despite these promising results, this study also highlights the limitations of current computational docking tools. Factors such as force field selection, ionic strength, and environmental temperature significantly influence the accuracy of predictions, making it challenging to precisely model nucleic acid and small-molecule interactions in complex environments. In the future, precise simulations of molecular docking under specific conditions could greatly enhance the predictive capabilities of aptamer-based biosensor design.