1. Introduction
According to GLOBOCAN 2020 data, breast cancer is the most prevalent cancer among women and the fifth leading cause of cancer-related deaths [
1]. It exhibits high heterogeneity at both morphological and molecular levels. Breast cancer is primarily categorized into four intrinsic subtypes—Luminal A, Luminal B, Basal-like, and HER2-enriched—based on the expression profiles of 50 genes, commonly known as PAM50 [
2]. While the PAM50 gene signature is valuable for classifying subtypes and guiding treatment decisions, it has some limitations, such as its reliance on numerous genes which increases both the costs and complexity of analyses in research and clinical settings [
3].
In addition to the molecular subtyping based on the gene expression, extensive research has aimed to identify risk factors for breast cancer, with genome-wide association studies (GWASs) highlighting common genetic variations associated with the disease [
4,
5]. However, these genetic factors only partially account for the heritable risk. Emerging evidence suggests that epigenetic changes could play a critical role in the development and progression of breast cancer, influenced by environmental and dietary factors [
6,
7,
8]. This underscores the need for a comprehensive understanding of epigenetic factors in the breast cancer.
Recent studies have advanced our understanding of epigenetic mechanisms underlying breast cancer subtypes. For instance, Hector et al. demonstrated that subtype-specific enhancers influence gene expression patterns in breast cancer using RNA-seq, GRO-seq, and ChIP-seq [
9]. Similarly, Soledad et al. identified molecular differences related to PAM50 gene signature that may lead to functional variations [
10]. They selected 13 coding transcripts and two microRNAs (MiR-21 and miR-10b) for the four breast cancer subtypes by integrating gene expression, DNA methylation, and microRNA expression data.
Another important epigenetic factor is chromatin accessibility, which plays a vital role in gene regulation by allowing access to transcription factors and other regulatory proteins [
11]. ATAC-seq (assay for transposase accessible chromatin with sequencing) is a powerful technique that identifies the open chromatin regions, providing insights into gene expression regulation and its variability across cell types and conditions [
12]. Yuexin et al. highlighted subtype-specific promoter regions, such as
FOXC1 and
ESR1, which differ between basal and non-basal breast cancer [
13].
However, to our knowledge, no systematic analysis has yet explored the connections between gene expression and chromatin accessibility using RNA-seq and ATAC-seq, particularly coupled with machine learning algorithms, to differentiate between breast cancer subtypes. Although several studies have combined machine learning algorithms with epigenetic information, most of these primarily used DNA methylation profiling datasets [
14,
15]. Integrating the RNA-seq transcriptome data with the ATAC-seq epigenetic information yields a more comprehensive understanding of gene regulation and its impact in breast cancer [
16].
Here, we utilized bulk RNA-seq and ATAC-seq data to explore the association between gene expression and chromatin accessibility at promoter regions in breast cancer patients. The primary objectives and contributions of the present research are (1) to develop a classification model to predict breast cancer intrinsic subtypes based on gene expression levels obtained from the integrated RNA-seq and ATAC-seq dataset, (2) to identify signature genes for the molecular classification of the breast cancer intrinsic subtypes, and (3) to search for potential transcription factor binding sites associated with these marker genes. Overall, our study demonstrates that combining RNA-seq and ATAC-seq data with machine learning algorithms can enhance our understanding of chromatin accessibility in breast cancer intrinsic subtypes and provide valuable insights into the molecular mechanisms driving the progression of these subtypes.
2. Materials and Methods
2.1. Data Preparation and Integration
In this study, four gene expression datasets—GDC TCGA-BRCA, GSE96058, GSE81538, and GSE135298—were obtained from the UCSC Xena browser (
https://xenabrowser.net/, accessed on 15 August 2024) and the Gene Expression Omnibus (GEO) database (
https://www.ncbi.nlm.nih.gov/geo/, accessed on 15 August 2024) [
17,
18,
19]. The gene expression data were transformed to log
2(TPM + 1). These datasets were generated by different institutions. Genes overlapping with gene symbols from GENCODE version 22 and GEO datasets were selected, excluding genes on sex chromosomes and mitochondrial chromosomes. For genes with multiple Ensembl IDs, the genes with the longest gene length were used.
ATAC-seq peak data for GDC TCGA-BRCA were also obtained from the UCSC Xena browser (
https://xenabrowser.net/, accessed on 15 August 2024). The data are represented as log
2(count + 5)PM-qn, where raw counts were adjusted by adding 5, converted to counts per million (CPM), and then transformed using log2 and quantile normalization.
Clinical information from GDC TCGA-BRCA patients was extracted using the R package TCGAbiolinks version 2.32.0 (accessed on 15 August 2024) [
20]. Patients from the primary vial (e.g., −01A) were selected, excluding individuals with technical replicates and those classified under the normal-like subtype. Similarly, clinical data from GEO gene expression datasets were processed using the R package GEOquery version 2.72.0 [
21].
2.2. Integrative Analysis between RNA-Seq and ATAC-Seq in GDC TCGA-BRCA
Accessible peaks from preprocessed TCGA-BRCA peak calling data were annotated using the R package ChIPseeker version 1.40.0 to search the nearest transcription start site (TSS) [
22,
23]. Promoter regions were defined as areas within 2 kb upstream and downstream of the TSS, and peaks located in promoter regions were used for the further analysis. Gene annotation was performed using the R package org.Hs.eg.db version 3.19.1. Initially, peaks on sex chromosomes and mitochondrial chromosomes were excluded for consistency. When multiple peaks were assigned to the same gene, the peak with the highest normalized score was chosen.
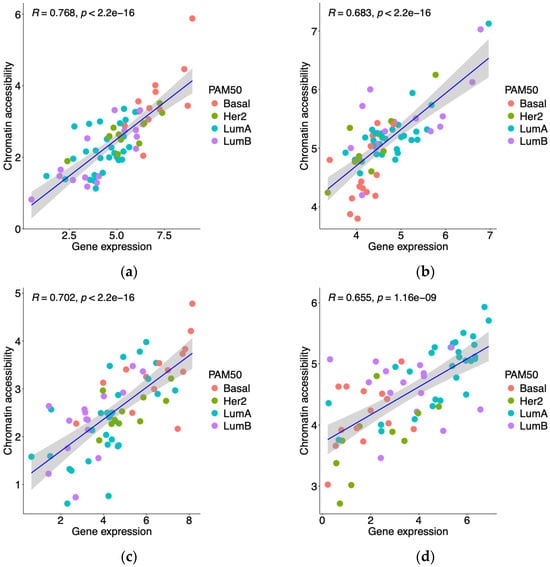
RNA-seq and ATAC-seq data from 68 matched GDC TCGA-BRCA patients were used for the integrative analysis. Genes and peaks with low variability, specifically a median gene expression ≤ 1 and median peak signal ≤ 1, were excluded. A Spearman correlation analysis was conducted to examine the relationship between gene expression and chromatin accessibility at promoter regions in the matched patients. Correlations with a coefficient ≥ 0.65 and a p-value < 0.01 were considered significant.
2.3. Data Preprocessing and Feature Selection
Gene expression and clinical data from the GSE96058 dataset were utilized to develop a classifier for breast cancer intrinsic subtypes. The dataset included genes that exhibited significant correlations between promoter accessibility and gene expression, as identified from matched GDC TCGA-BRCA patients. The data were generated using both the Illumina HiSeq 2000 and Illumina NextSeq 500 sequencers. For model development and evaluation, patients with a GPL1154 platform ID (from the Illumina HiSeq 2000) were used, while patients with a GPL18573 platform ID (from the Illumina NextSeq 500) were used for external validation. The preprocessed GSE96058 dataset was divided into training data (70%) and test data (30%). Subsequently, data normalization was applied separately to the training and testing sets by calculating the Z-score [
24].
Feature selection was performed using recursive feature elimination with cross-validation (RFECV), with a support vector machine (SVM) as the estimator and based on SHAP (SHapley Additive exPlanations) feature importance [
25]. This approach was employed to identify optimal genes, aiming to enhance both accuracy and computational efficiency. This process used stratified 10-fold cross-validation, repeated ten times, to enhance the robustness of the model performance estimates. All the data preprocessing and feature selection experiments were conducted using the Python library probatus version 3.1.0 and scikit-learn version 1.5.1.
2.4. Construction and Evaluation of Machine Learning Algorithms
Machine learning algorithms were developed using the selected feature sets. Six algorithms were employed: SVM (support vector machine), LR (logistic regression), NB (naïve Bayes), AdaBoost (adaptive boosting based on decision trees), and MLP (multilayer perceptron).
Before constructing the classification algorithms, the distribution of breast cancer subtypes was assessed, revealing an imbalance that could bias the models. We applied a clustering-based under-sampling technique, replacing majority class samples with centroids identified using the k-means algorithm [
26]. The performance of models trained on the under-sampled data was compared with those trained on the original data. This comparison aimed at evaluating improvements in classification accuracy, ensuring robust performance estimation and minimizing prediction errors.
To visualize the gene expression profile of the training data, the uniform manifold approximation and projection (UMAP) method was employed. Optimal hyperparameter values for each model were determined through grid search with stratified 10-fold cross-validation, repeated 10 times. The hyperparameter settings for this process are detailed in
Table S1. Model performance was evaluated using several metrics: accuracy, specificity, sensitivity, F1 score, and AUROC (area under the receiver operating characteristic curve). For multiclass classification, all metrics were evaluated using the macro-average method for a comprehensive assessment across all classes, except for accuracy.
All the experiments using the machine learning were conducted using the Python libraries imbalanced-learn version 0.12.3, umap-learn version 0.5.6, scikit-learn version 1.5.1, and Yellowbrick version 1.5.
2.5. Validation with Independent Gene Expression Datasets
To assess the generalizability and robustness of the model, we used external validation datasets—GSE81538, GSE135298, and GSE96058—that were not involved in the model construction phase. These datasets also normalized by calculating Z-scores at the machine learning model construction.
Additionally, further validation was performed using the GDC TCGA-BRCA dataset, which was not included in the initial correlation analysis. This dataset was split into a training set (70%) and a test set (30%), and underwent Z-score normalization. The model was then retrained on the GDC TCGA-BRCA training set with genes selected through feature selection, and its prediction performance was subsequently evaluated.
2.6. GO and KEGG Enrichment Analysis
To elucidate the biological significance of the selected genes identified through feature selection, Gene Ontology (GO) and Kyoto Encyclopedia of Genes and Genomes (KEGG) were used for enrichment analyses using the R package clusterProfiler version 4.12.1 [
27,
28,
29]. Biological process terms were considered enriched if they had a
q-value < 0.05, which represents the adjusted
p-value using the Benjamini–Hochberg method for controlling false discovery rates [
30,
31]. KEGG pathways were deemed enriched with a
q-value < 0.1. Visualization of the enrichment results was carried out using the R package enrichplot version 1.24.2.
2.7. Motif Discovery Analysis
To identify peak locations of genes selected through feature selection within promoter regions, ATAC-seq data from the GDC TCGA-BRCA cohort were utilized. DNA sequences corresponding to these peak locations from the masked human reference genome version 38 (
https://genome.ucsc.edu/, accessed on 15 August 2024) were extracted using bedtools version 2.31.1 [
32]. Subsequently, MEME-ChIP (version 5.5.5) was employed to analyze these sequences and identify both novel DNA-binding motifs and known transcription factor binding sites associated with the selected genes. Motifs for analysis were sourced from the JASPAR 2024 database (
https://jaspar.elixir.no/, accessed on 15 August 2024) [
33,
34]. Motifs with an E-value < 0.01 were considered as significantly enriched, reflecting a low probability of the alignment occurring by chance. This approach integrates genomic sequence analysis with motif discovery to uncover potential regulatory elements influencing the selected genes.
4. Discussion
In this study, we developed a classification model for predicting breast cancer intrinsic subtypes by integrating gene expression and chromatin accessibility profiles with machine learning algorithms. We identified 813 genes from the GDC TCGA-BRCA cohort that exhibited significant correlations between their expression levels and chromatin accessibility at promoter regions. Using RFECV with SVM as the estimator and SHAP for feature importance, we refined the gene set to 10 key genes critical for breast cancer intrinsic subtype classification.
Among these 10 genes, 7 were part of the PAM50 gene signature:
CDH3,
ERBB2,
TYMS,
MYBL2,
ESR1,
FOXC1, and
NAT1. The inclusion of
GREB1,
OSR1, and
FAM83D, which are not in the PAM50 gene signature, highlights the potential of our integrative approach to reveal prognostic markers related to breast cancer intrinsic subtypes. For instance,
GREB1 is a key regulatory factor of the estrogen receptor, influencing chromatin accessibility through interactions with PRC1.2, ERα, and
FOXA1, with
FOXA1 being a notable biomarker for the luminal breast cancer subtype [
36,
37,
38]. Amir et al. demonstrated that
OSR1 is significantly down-regulated across Luminal A, Luminal B, HER2-positive, and TNBC (triple-negative breast cancer) subtypes and interacts with hsa-miR-21-5p, a microRNA biomarker for breast cancer diagnosis identified by Min Liu et al. [
39,
40]. Additionally,
FAM83D has been identified as an independent biomarker for breast cancer intrinsic subtypes through meta-analysis, and separate research has shown that it is associated with immune-infiltrative subtypes while displaying variable correlations with stromal cell infiltration and tumor stem cells [
41,
42,
43].
We evaluated the model’s performance using metrics including accuracy, specificity, sensitivity, F1 score, and AUROC, demonstrating its effectiveness in subtype classification. Validation on independent datasets confirmed the model’s robustness and underscored the relevance of the 10 genes across different datasets. Additionally, retraining the model on GDC TCGA-BRCA data, which were not initially used, further validated its generalizability and strong performance in subtype classification. Previously, Okimoto et al. demonstrated that a support vector machine classifier based on 36 subset genes from the PAM50 gene signature achieved accuracy comparable to models using the full PAM50 gene signature [
3]. Our findings highlight that the 10 genes selected through our integrative analysis are highly effective for classifying breast cancer intrinsic subtypes, even though not all are part of the traditional PAM50 gene signature.
Additionally, we conducted enrichment analysis and motif discovery to explore the biological functions and pathways associated with these genes. This analysis revealed significant connections with immune responses, hormone signaling, cancer progression, and cellular proliferation, underscoring their relevance in breast cancer biology. Motif discovery identified motifs associated with three transcription factors—EBF1, ZNF770, and PATZ1—suggesting potential regulatory mechanisms influencing gene expression and breast cancer intrinsic subtypes. For example, the EBF1 motif is a crucial regulator of subtype-specific methylation and gene expression, with notably high expression in triple-negative breast cancer [
44,
45]. Several studies have shown that
ZNF770 is significantly upregulated across Luminal A, Luminal B, HER2-positive, and TNBC subtypes and interacts with miR-3656, with expression changes observed following HER2-targeted drug treatment, as identified by Lisa et al. [
39,
46]. Meanwhile, Fangchao et al. found that
CBLL1 expression was significantly higher in Luminal A and Luminal B subtypes compared to others, and that
ZNF770 expression was significantly lower in the CBLL1-low group compared to the CBLL1-high group within the luminal subtype [
47]. Furthermore,
PATZ1 is targeted by miR-29b, a microRNA biomarker for the HER2-enriched subtype, with its expression negatively associated with this subtype, and overexpression of miR-29b inhibits breast cancer cell proliferation and induces apoptosis primarily by downregulating STAT3 protein levels [
48,
49].
These findings highlight the potential of the 10 informative genes as promising biomarkers. However, several limitations should be acknowledged. Firstly, due to computational constraints, it was impractical to exhaustively test all possible parameter values for machine learning algorithms; thus, we relied on grid search with stratified 10-fold cross-validation and preselected hyperparameter values. Secondly, the ATAC-seq data from the GDC TCGA-BRCA cohort had a limited sample size, which may impact result robustness. To mitigate this, we performed Spearman correlation analysis at the individual sample level to link open chromatin with gene expression, and validated our model across multiple independent gene expression test sets. Finally, since our study was based solely on bioinformatics analyses, experimental validation is necessary to confirm the reliability of these genes as biomarkers for accurately predicting breast cancer intrinsic subtypes.
Furthermore, recent advances have highlighted the importance of multiomics integration, particularly in the classification of breast cancer subtypes using machine learning algorithms [
50,
51,
52,
53]. Lin et al. developed DeepMO, which classifies breast cancer subtypes based on gene expression, DNA methylation, and copy number variation [
54]. Choi et al. proposed moBRCA-net, which employs an attention-based neural network to classify breast cancer subtypes based on gene expression, DNA methylation, and miRNA expression [
55]. Huang et al. developed a differential sparse canonical correlation analysis network (DSCNN) model, a multitask deep learning neural network based on gene expression and DNA methylation [
56]. Looking ahead, future research could benefit from integrating chromatin accessibility data with other multiomics profiling datasets. This integration has the potential to enhance our understanding of the complex biological mechanisms underlying breast cancer, potentially revealing novel insights into gene regulation and epigenetic modifications specific to various breast cancer subtypes. Moreover, it is necessary to develop more advanced machine learning algorithms capable of effectively integrating multimodal omics data and systematically interpreting biological phenomena. In addition, exploring temporal dynamics in multiomics data to capture the evolving nature of cancer progression, advancing single-cell multiomics integration techniques to better understand tumor heterogeneity, and focusing on translating multiomics findings into clinically actionable insights are also required.