Since February 2024, extensive research has been carried out diligently, and so far up to 200 plants have been documented with a variety of end-products such as bioethanol, biochar, syngas and bioenergy. The main challenge of this documentation was the incomplete emission reports from the plants. The data correctness depends on each country’s registration accuracy. Nevertheless, this fact was anticipated since the reporting of biogenic emissions is not mandatory.
The minimum data necessary to include a plant in our analysis were the feedstock type; the annual feedstock consumption; and the annual production, or in the case of combustion, the heat capacity. Optional details, such as feedstock moisture content and process efficiency when available, were used to provide more accurate results.
The following graphs provide a visual representation of biogenic emissions and the distribution of the documented facilities across Europe. These visual aids are integral to understanding the spatial patterns of emissions and the geographic spread of facilities involved in bioenergy, biofuel, and biochar production. More specifically,
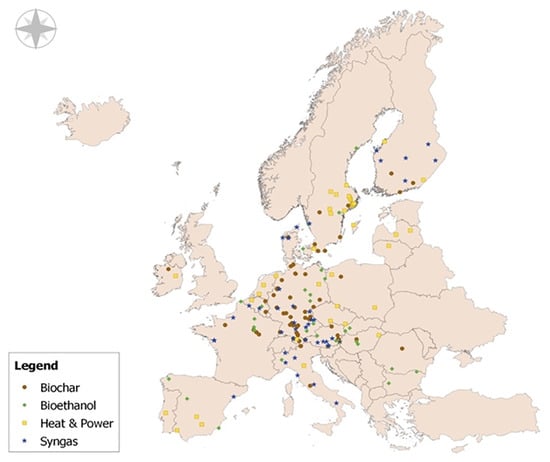
Figure 1 provides a comprehensive overview of the geographical distribution of bioenergy, biofuel, and biochar production facilities across the EU-27, aiming to identify distinct regional patterns while the biogas/biomethane sector is studied separately. Central and Western Europe, particularly Austria and Germany, boast a substantial number and diverse range of plant types. The well-established circular economy practices in these countries support their success within the framework of the European Green Deal (EGD) strategy. In Northern Europe, the Scandinavian countries (Sweden, Finland, Denmark) have a significant number of heat and power plants utilising wood chips and pellets. This is closely linked to their high proportion of forested land, their early adoption of bioenergy production in the late 1990s, and the European Commission’s promotion of waste-to-energy initiatives in the 2000s [
22]. Conversely, Southern Europe shows moderate distributions, while Eastern Europe has limited facilities, with only a few noted in Hungary and Romania. The distribution by plant type reveals that biochar plants are predominantly concentrated in Central and Western Europe, where agricultural and green biomass residues are readily available [
23]. In contrast, bioethanol plants are more evenly distributed but are primarily located in Central Europe. Combined heat and power (CHP) plants and gasifiers, on the other hand, are notably concentrated in regions with extensive forestry land and significant industrial activity, where they serve to meet local energy needs while contributing to carbon footprint reduction through carbon-neutral energy sources.
For the case of biomethane production, the Gas Infrastructure Europe and European Biogas Association have created the European Biomethane Map 2024, which includes all infrastructure for biomethane production and is accessible through the following link: European Biomethane Map [
24]. The geographical distribution of biomethane plants within the EU-27 reflects the varying levels of adoption and development of biomethane production across member states. Countries in Western and Central Europe, such as Germany, France, and the Netherlands, exhibit the highest concentration of biomethane plants. This is largely due to well-established policies supporting renewable energy, robust infrastructure for biogas upgrading, and a strong emphasis on achieving carbon neutrality. In contrast, Eastern European countries show a lower density of biomethane facilities. This disparity may be attributed to factors such as limited infrastructure, lower levels of investment, and varying degrees of regulatory support for biomethane production. However, some countries in this region, like Hungary, are gradually expanding their capacity as part of efforts to diversify energy sources and meet EU climate targets. Northern Europe, including countries like Sweden and Denmark, also demonstrates a significant presence of biomethane plants, leveraging their strong forestry sectors and early adoption of renewable energy strategies. Meanwhile, Southern Europe displays a moderate but growing number of plants, with countries like Italy making strides in utilising agricultural residues and organic waste for biomethane production. Overall, the distribution underscores the influence of regional policies, resource availability, and technological readiness in shaping the biomethane landscape across the EU-27.
The ranking of the total biogenic emissions (excluding biogas/biomethane plants) by country is presented in
Figure 2, while the biogas/biomethane sector is studied separately. From
Figure 2, it is evident that Sweden is the largest emitter across the rest EU Member States with a significant contribution comparing to the total documented emissions, summing up to 11 million tonnes of biogenic CO
2 per year. This is justified by the significant presence of biomass combustion plants in Sweden. Following this, Finland and Poland emit 4.46 and 2.9 million tonnes of biogenic CO
2, respectively. A significant disparity is observed between the top three emitters. Observing the list further, a moderate difference is noticed among countries like Germany, Belgium, Ireland, Czech Republic, France, and Italy, which are contributing minor amounts to the overall emissions. Countries with minor contribution or with no record of emissions, like Greece, Estonia, Malta, Luxemburg, Portugal, Romania, and Bulgaria, are likely correlated with underdeveloped bioenergy infrastructure and energy policies within the nations.
Figure 3, as reported by EBA 2023 [
25], presents the ranking of total biogenic emissions from biogas and biomethane plants by country. The data indicate that Germany is the largest emitter among EU Member States, accounting for nearly 22.5 million tonnes of biogenic CO
2 annually—a substantial share of the total documented emissions. Italy follows with 6.3 million tonnes per year, while Spain and the Czech Republic each emit 2.1 million tonnes annually, highlighting a significant disparity among the top four emitters. France and Poland contribute between 1.5 and 2 million tonnes of biogenic CO
2 per year. Meanwhile, countries with minimal contributions or no recorded emissions, such as Romania, Malta, Luxembourg, the Czech Republic, and Bulgaria, likely indicate limited development of bioenergy infrastructure and less advanced energy policies in these regions.
While this study focuses on quantifying biogenic CO2 emissions from biofuel and bioenergy production, it is useful to contextualise these figures within the broader landscape of fossil-fuel-derived emissions. In 2023, the European Union’s total greenhouse gas emissions were estimated at 3.4 billion tonnes of CO2 equivalents, reflecting a 7% decline from 2022 due to reductions in fossil fuel use. Notably, emissions from coal, oil, and natural gas combustion still accounted for the vast majority of the EU’s CO2 footprint, despite ongoing decarbonisation efforts.
By contrast, the biogenic CO2 emissions recorded in this study, while significant, are fundamentally different as they are part of the short-term carbon cycle. Unlike fossil CO2, which adds to atmospheric carbon levels over geological timescales, biogenic emissions are reabsorbed by biomass growth under sustainable management. However, this does not eliminate the need for carbon capture and utilisation (CCU) technologies in the bioenergy sector, particularly for large-scale combustion and anaerobic digestion plants, which contribute substantial emissions despite their renewable nature.
Countries such as Sweden and Germany demonstrate the potential for bioenergy-based carbon neutrality, with Sweden capturing up to 60% of its biogenic CO2 through BECCS and flue gas treatment. However, the overall adoption of BECCS and similar technologies across the EU remains below 13%, highlighting the need for further investment in carbon-negative bioenergy systems. Expanding the deployment of these technologies could bridge the gap between bioenergy sustainability and long-term climate targets, enabling the sector to contribute more effectively to the European Green Deal’s goal of climate neutrality by 2050.
3.1. Feestock Type Analysis
Figure 5 presents an analysis of biomass feedstocks and their categorisation by type. According to the collected data, up to 70% of the plants utilise forestry residues, with 65% of these being secondary forestry residues (SFR), such as wood chips and pellets, contributing to 12.3 million tonnes of CO
2eq biogenic emissions. The remaining 35% process primary forestry residues (PFR), including green waste and branches, accounting for 11.9 million tonnes of CO
2eq biogenic emissions.
Agricultural residues rank second, primarily consisting of cereal crop waste (up to 85%), with a smaller proportion of plants using animal manure or digestate to meet their energy needs. Due to their composition, agricultural residues are more suitable for producing biofuels like bioethanol or biochar, which serves as a carbon sink. Most plants producing bioethanol rely on agricultural biomass residues, emitting a total of 2.5 million tonnes of CO2eq biogenic emissions.
Energy crops, such as miscanthus, giant reedgrass, reed canary grass, and switchgrass, represent another significant feedstock. These low-cost biomass sources are used exclusively for renewable energy production, particularly bioethanol, due to their high sugar content. Processing energy crops generates 2.8 million tonnes of CO2eq biogenic emissions across 16 documented plants.
Industrial residues, including pomace from olive and wine production and molasses from sugar refining, along with municipal solid waste (MSW) such as kitchen and garden waste, form another promising biomass stream. Approximately 10% of the plants are supplied by these two waste streams, collectively contributing 1.55 million tonnes of CO
2eq biogenic emissions.
Figure 5 provides a detailed breakdown of the categorisation and distribution of raw materials among the various feedstock categories.
The EBA Report [
16] provides comprehensive tracking and updates on biogas and biomethane production facilities, offering valuable data and insights to enhance bioenergy infrastructure and inform the development of policy frameworks. Biogas is generated through the decomposition of organic materials, with the feedstocks categorised by their source, as shown in
Figure 6. Approximately 79% of anaerobic digestion plants in Europe utilise agricultural residues, including straw, husks, corn kernels, sequential crops, and manure. The second most common feedstock for biogas production is sewage sludge from municipal wastewater treatment plants (bioethanol, syngas, biomass combustion, and biochar production), accounting for around 10% of the total. Organic waste from landfill sites also serves as a notable feedstock, contributing to 5% of the plants. The remaining facilities process organic solid waste from municipalities and industries, as well as the organic fraction of wastewater from industrial residues, further diversifying the feedstock sources used for anaerobic digestion.
Table 1,
Table 2,
Table 3,
Table 4 and
Table 5 present the corresponding biogenic CO
2 emissions per country for each feedstock type (excluding biogas/biomethane plants) and for all technological readiness levels (TRL). The background colour presents the sum of the lines below (up to the next background colour), The bold signifies the sum of what follows (up to the next bold) for all tables.
A total of 132 plants utilising forestry residues are listed in
Table 1. These plants are categorised based on plant type, TRL, and country of operation. When evaluating the processing technologies and technology readiness for valorising forestry residues, several plants use the biomass directly or with minimal processing. For example, bioenergy production (thirty-eight at TRL 9) and syngas production through biomass gasification (three at TRL 6–7, forty at TRL 9) are both mature, commercially established technologies.
An alternative approach for utilising this feedstock involves pyrolysis to produce biochar or fermentation to produce bioethanol, a renewable energy biofuel. As shown in
Table 1, there are several commercial and pre-commercial plants (two at TRL 4–5, twelve at TRL 6–7, thirty-eight at TRL 9) producing biochar, although these still require process validation, either as a replacement for fossil fuels or as a means of carbon storage.
Additionally, no plants were found to produce bioethanol from forestry residues, mainly due to the high production costs, which can vary significantly depending on location, season, and the complex composition of the residues. More critically, the cost of the necessary pretreatment (such as delignification) and enzymatic hydrolysis to efficiently convert cellulose and hemicellulose into monomeric sugars results in high ethanol production costs. This process is economically unfeasible unless other by-products can be extracted during production [
27,
28].
The majority of plants primarily produce biochar through biomass pyrolysis, with most of them located in Germany. This highlights the emerging waste management practices for woody biomass aimed at effectively addressing the negative impacts of GHG emissions [
13,
29]. Many pyrolysis plants, currently at the pre-commercial stage, are still in the process of optimising various parameters to maximise biochar yield and stability, so they can fully demonstrate their environmental benefits [
30]. While Germany has the highest number of documented units, Sweden leads in terms of the volume of forestry residues used, with a carbon footprint approximately ten times greater. Sweden has been utilising forestry residues as a carbon-neutral fuel since the late 1990s to provide heat and electricity to its population, benefiting from its extensive forested areas, which cover up to 70% of the land, and its relatively low population density.
Since the European Commission introduced its first directive on biofuels and renewable fuels for transport [
31], followed by the Renewable Energy Directive (RED) [
32], the production and consumption of first-generation biofuels began to rise across the EU [
33]. Due to their high sugar content, agricultural residues have been identified as a promising raw material for sustainable energy production, contributing to the EU’s renewable energy targets and the transition away from fossil fuels. However, despite their availability in large quantities, agricultural crop residues present challenges, such as potential conflicts with the food supply chain and the risk of crop land erosion [
34,
35].
As shown in
Table 2, EU Member States are encouraged to produce sustainable fuels while improving soil fertility and minimising negative impacts. Most plants are focused on advancing process maturity and capacity for bioethanol and biochar production. While the Renewable Energy Directive continues to evolve to meet its targets, pre-commercial plants across Europe are working to provide integrated solutions that enhance both environmental and economic efficiency before the commercialisation of these processes.
Currently, 21 plants have been documented using 4.00 million tonnes of agricultural crop residues, contributing to a total carbon footprint of 2.48 million tonnes of biogenic CO
2eq per year, with 20% carbon capture. As numerous studies explore methods for valorising this raw material [
36,
37,
38], attention has turned to bioethanol and pyrolysis plants.
In addition to concerns about promoting first-generation biofuels, there has been growing interest in second-generation biofuels, which can be considered truly carbon-neutral as they derived from non-food biomass, such as energy crops. The cultivation and use of energy crops offer a reliable pathway to producing renewable energy without impacting the food supply chain or the environment [
39,
40,
41]. The use of energy crops across the EU-27, along with their corresponding biogenic emissions, is presented in
Table 3, totalling 2.69 million tonnes of biogenic CO
2 per year.
Biofuels generated from energy crops are crucial to assess sustainable management strategies and develop efficient bioenergy production systems with improved environmental and agro-economic conditions. Moreover, energy crops are mainly used to produce transport biofuels on account of the easy extraction of sugars from this raw material, thus making the process more viable and affordable for commercial scale applications with minimum impact of land-use change [
42,
43,
44]. Nevertheless, it is questionable whether the use of land, even for non-food energy crops, is sustainable [
45,
46]. Europe is updating its policies in line with the Renewable Energy Directive [
32] and is focused on promoting the production of advanced biofuels from energy crops cultivated on marginal lands. As part of this, the implementation of carbon capture technologies has been proposed, with significant research directed towards achieving “negative emissions” processes. By combining bioenergy production with carbon capture and storage systems (BECCS), it is possible to generate carbon-neutral biofuels while simultaneously capturing CO
2 from the atmosphere to support biomass growth. However, the large-scale deployment of BECCS with energy crops is not yet feasible due to concerns about land-use changes, which could negatively impact food crop cultivation and the food supply chain. To implement BECCS systems with energy crops successfully, EU Member States must carefully regulate and manage investments in this technology to meet the European Commission’s target goals for 2050 [
39,
47,
48,
49].
Following the European Commission’s set targets and the increasing cost of residues disposal, industries have begun implementing waste management strategies to support renewable energy production. These strategies, particularly in the food and beverage sector, are documented in
Table 4. These industries, including breweries and olive mills, generate various organic residues. Alongside these waste streams, municipal kitchen organic waste, with similar characteristics and potential energy value, is another resource. Plants utilising this waste are listed in
Table 5. To date, 11 plants have been documented using these residues, resulting in up to 1.56 million tonnes of biogenic CO
2 emissions, either by producing bioethanol to increase revenue or by generating bioenergy to meet their own heat and power needs.
While the technology for valorising these organic residues has advanced, techno-economic factors still need to be considered before industries take the next step in contributing to biofuel production and renewable energy generation, while also offsetting their emissions [
50]. In contrast, while industrial and municipal organic residues can facilitate the transition away from fossil fuels, a well-established and sustainable supply chain system is crucial for creating new, flexible pathways to achieve carbon neutrality [
51].
Table 6 provides an overview of the distribution and CO
2 emissions from biogas and biomethane plants across the EU-27 Member States. A total of 18,140 biogas plants are in operation, producing over 60 million tonnes of CO
2 annually. Germany is the leading producer, with 11,000 plants generating more than 22 million tonnes of CO
2 per year. Other significant contributors include Italy, the Czech Republic, and France. While there are fewer biomethane plants (1104), they still contribute notably to CO
2 emissions, with Germany again at the forefront, emitting over 300,000 tonnes annually. The widespread use of TRL 9 commercial technologies in both biogas and biomethane plants highlights their maturity in the market, although there are notable differences in their distribution and impact across Europe.
3.2. Biogenic CO2 Management and Valorisation
The integration of bioenergy with carbon capture and storage (BECCS) is a pivotal strategy in achieving climate targets by enabling negative emissions, particularly within sectors where emissions are challenging to mitigate [
52]. BECCS, as a technology, holds promise in transitioning towards carbon neutrality by linking large-scale biomass energy production to CO
2 capture and permanent storage [
44,
53]. The main challenge for BECCS lies in developing scalable, commercial processes for capturing and storing CO
2.
Out of the 188 plants for biomass combustion, gasification, pyrolysis, and fermentation documented, 130 facilities have been identified as actively applying carbon capture, utilisation, and storage (CCUS) technologies across the EU-27. These facilities are presented in the inventory database as previously mentioned along with the methods used for emissions management. A variety of technologies to reduce, capture, or valorise biogenic CO2 emissions are reported. Examples include the following:
Sorption-enhanced water gas shift (SEWGS) for syngas production, integrating CO2 capture into the process to enhance hydrogen generation.
Cryogenic capture and liquefaction, primarily used in bioethanol plants where the CO2 stream is relatively pure, allowing for efficient storage or utilisation.
Biochar-based carbon sequestration, which stabilises carbon in solid form through pyrolysis and uses the biochar as a soil amendment.
Amine scrubbing and selective non-catalytic reduction (SNCR) in biomass combustion plants to capture and purify CO2 from flue gases.
Based on the data collected, the following comparative figures are presented (
Figure 7,
Figure 8,
Figure 9,
Figure 10,
Figure 11 and
Figure 12). From these figures, it is obvious that most plants that apply CCUS technologies are in Germany, followed by Sweden and Austria. However, while Germany hosts almost half of these plants, it captures only 10% of the biogenic gases captured by Sweden. Most plants applying CCUS in the EU-27 are pyrolysis plants, while just a few (less than 10) are bioethanol plants. Nevertheless, the biogenic CO
2 captured from the pyrolysis plants amounts to just 11% of the biogenic emissions captured from biomass combustion plants. It is also noteworthy that in the Netherlands, almost all biogenic emissions are captured, but this is largely because only one CCUS plant was identified. For the countries that have several CCUS plants, the highest share (almost 60%) is held by Sweden. As for the plant types, in the pyrolysis plants, most of the biogenic CO
2 produced is captured.
Although Sweden has a much larger carbon footprint than the rest of the EU-27, as shown in
Table 1, it is also the country with the highest percentage of carbon capture, around 60% of emissions from biomass combustion plants for energy recovery with selective non-catalytic reduction (SNCR) combined with flue gas condensation. Regarding the agricultural residues described in
Table 2, in total, these plants documented valorising 3.05 million tonnes of agricultural crop residues with a carbon footprint of 991,000 tonnes of biogenic CO
2 eq. and up to 50% carbon capture, while recovering soil fertility in lands with carbon sequestration and supplying the food and beverage industry with pure CO
2 from alcoholic fermentation. However, from the emissions produced from processing energy crops (
Table 3), just 30% are documented to be captured.
Table 7 outlines a range of bioenergy or biochar plants and their corresponding CO
2 emissions, providing a detailed breakdown of the emission outputs from different biomass conversion processes such as biomass combustion plants, gasification plants, bioethanol production, and pyrolysis. Biomass combustion plants represent the largest share of biomass plants, with substantial CO
2 emissions reported. Gasification and bioethanol plants follow, each demonstrating the potential for CO
2 reduction through innovative capture technologies. Pyrolysis plants, particularly those producing biochar briquettes, show significant potential for negative emissions, contributing to long-term carbon storage with soil amendment practices.
In addition to the emission data presented in
Table 7, different biogenic gas management (stack gas recovery, flue gas condenser, SNCR) and capture technologies, including liquefaction/cryogenic capture, amine scrubbing, and SEWGS, are employed for CO
2 utilisation in industries like horticulture, food and beverage, and soil amendment. These examples underscore the technical feasibility of integrating CCS with bioenergy systems, though challenges related to economic viability and scalability persist.
Biochar is used as a carbon sink because when biochar is applied to soil (direct application to soil is the standard procedure), it locks away carbon, reducing the amount of carbon released into the atmosphere. This process is often referred to as a form of biogenic carbon capture [
54].
Moreover, the overall CCUS management for the biochar, bioethanol, and biomass combustion plants are presented in
Table 8 linked with the sum of the captured emissions.
Despite technical feasibility, economic uncertainties and high investment costs continue to pose challenges to BECCS implementation. BECCS remain essential for providing negative emissions, thus compensating for the unavoidable GHG emissions in other sectors [
55,
56]. Furthermore, the source and lifecycle of biomass is increasingly critical, as outlined by the RED III directive [
57], in determining the overall success of BECCS in the coming years. In summary, BECCS technology presents a promising route to reducing greenhouse gas emissions and aiding the transition to a carbon-neutral society, though significant economic and technical barriers remain to be addressed for its widespread adoption. The background colour presents the sum of the lines below (up to the next background colour), The bold signifies the sum of what follows (up to the next bold).
Source link
Diogenis Christianides www.mdpi.com