1. Introduction
With the recent increase in global demand for electrical energy, power systems have become larger and more complex to meet growing energy consumption. This increasing complexity is anticipated to heighten the stress, disturbances, and vulnerability of power systems. To address these challenges and ensure high reliability, it is critical to perform continuous inspections and implement preventive maintenance to achieve fault-free operation [
1]. Typically, utility assets are exposed to damage from natural hazards such as fallen trees, wildfires, and so on. At the same time, the majority of maintenance tasks still heavily rely on manual labor. Since most utility assets involve high voltage and high current environments, the maintenance and inspection work is extremely risky for technical personnel.
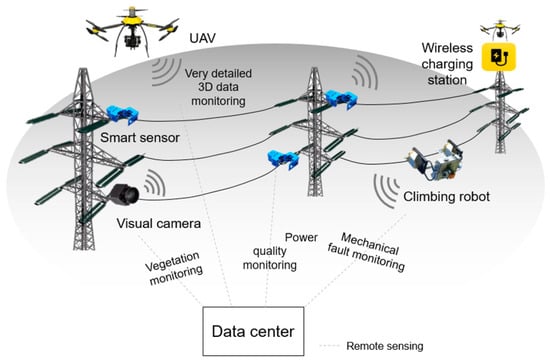
To solve these issues, various applications have been developed, including wireless sensors [
2,
3], inspection robots [
4,
5], and uncrewed aerial vehicles (UAVs) [
6], as shown in
Figure 1. These devices enable utility operators to maintain high reliability while monitoring and managing extensive areas. In addition, human exposure to hazardous high-voltage environments can be eliminated, and maintenance costs can be significantly reduced. While these devices are efficient, they require an independent power source for continuous operation. Indeed, physical connection to a power supply is infeasible due to the large potential differences near high-voltage power lines. Consequently, most of these devices rely heavily on battery power, which necessitates periodic replacement. To overcome the limitations of current power supplies, energy harvesting is being explored as a practical solution to make these systems self-sustainable, eliminating dependence on battery power.
There are various candidate energy sources for harvesting near power lines. In [
7], several energy harvesting methods were compared from a practical perspective. Referring to the above paper, our research concluded that MEH was a suitable method near power lines in three major aspects. Firstly, MEH has high reliability as a power supply. MEH is relatively less affected by weather conditions compared to other energy harvesting technologies, such as photovoltaic energy harvesting. These characteristics make MEH a reliable power supply for applications beyond sensor devices to tens of watts. Secondly, the MEH has a high power density compared to other energy sources [
8]. This characteristic minimizes the impact on the power line, such as additional undesired sag caused by the weight of the harvester. Finally, MEH has the distinct advantage of being applicable to indoor environments, such as underground transmission lines, unlike other harvesting methods. Among these advantages, power density is the most critical design factor in MEH, so many related studies have been conducted [
8,
9,
10,
11,
12,
13,
14].
One major hurdle in MEH design is the degradation in power density caused by magnetic saturation. When the MEH operates in the saturation region, the magnetic flux density ceases to change, resulting in a reduction of harvested power to zero. For this reason, previous studies have focused on preventing or overcoming saturation. In [
10], the threshold current, which is the current at which the magnetic core is saturated, was determined based on the maximum flux density of the magnetic material. In [
11], the output was improved by using the saturation region in reverse. It was confirmed that the maximum output is generated in the region called the ‘soft saturation region’. To operate in this region, the load voltage is controlled using
B–
H curve modeling. In [
12], the saturation was overcome by using a reverse magnetic field through an additional power circuit. To manipulate the magnetic field, the optimal load voltage was analyzed based on the previously mentioned
B–
H curve model. To summarize the previous research, the power density was improved by adjusting the load voltage based on the
B–
H curve model.
However, from a practical point of view, MEH is easily affected by temperature depending on the weather conditions, installation location, primary current intensity, and housing design. In particular, the magnetic core is sensitive to temperature. This may produce a variation in the magnetic flux density, as shown in
Figure 2, which may affect the output performance as a result [
13]. If temperature effects are not accounted for at the design stage, the saturation voltage may be set higher than the intended value. This can cause the magnetic core to enter saturation prematurely due to temperature changes. In [
13], the resonance condition was used by adding a compensation capacitor to minimize reactive power. However, as the temperature rises, the impedance matching condition changes and the output power is rather reduced. These challenges have not yet been addressed. Consequently, the optimal load voltage may be inaccurately predicted, leading to a significant reduction in output power. In any case, from a practical point of view, it is necessary to consider the effect of temperature rise on maximum power extraction in the MEH design.
In this paper, we propose a robust MEH design method with improved power density using a control algorithm considering magnetic saturation induced by temperature changes. For the first time, we analyze the MEH for maximum power extraction by considering the relationship between magnetic saturation and temperature variation. In order to consider temperature effects in MEH design, circuit parameters and saturation conditions were obtained through temperature-dependent B–H curve modeling.
To validate the impact of temperature variation, ferrite was selected as the magnetic material, and harvested power was measured under varying temperature conditions ranging from 25 to 200 °C. This range is based on the temperature characteristics of ferrite PL-7 [
15] by considering Curie temperature. Using the proposed algorithm, the maximum harvested power of MEH under different temperature conditions improved compared to conventional methods.
Consequently, our research differs from and extends conventional works [
2,
3,
4,
5,
6,
7,
8,
9,
10,
11,
12,
13,
14,
15,
16,
17,
18] in many respects, as follows:
- (1)
Modeling and procedures for maximum harvested power were developed while considering temperature effects
- (2)
Improved power density was obtained under different temperature conditions, compared to the conventional model
The paper is organized as follows: Details on the output power model are given in
Section 2.
Section 3 gives a detailed description of the proposed design methodology.
Section 4 presents a detailed description of the measurement setup and experiment results. Finally, the conclusions are given in
Section 5.
2. Theoretical Analysis for Maximum Harvested Power in MEH
An equivalent circuit was developed, as shown in
Figure 3a. To simplify the circuit analysis, we expressed the magnetizing inductance
Lm and transformer model instead of using the mutual inductance model [
7]. The supercapacitor was connected to the core as a load, which can be considered to be a constant dc voltage. The leakage inductance and core-loss components were neglected because the power line current is modeled as the current source. For simplicity, all components are reflected on the primary side, as shown in
Figure 3b. In this case, the primary voltage
Vpri is the important factor for determining harvested power in the MEH [
8].
2.1. Analysis of Load Voltage and Harvested Power in MEH
The formulas for averaged harvested power
Po can be expressed as follows [
14]:
where Tp is primary line period and ts is the start time of harvesting current, respectively. Vrec is rectifier voltage across the dc/dc converter. NS is the number of windings turns in MEH, and NP is the number of turns in a main power line, commonly equal to 1 in the power system. The waveform of ipri and iLm represent the primary current and magnetizing current, as shown in Figure 3a. The harvested power current ihar is the difference between ipri and iLm. Figure 4 shows the waveform of Vpri, considering active components using circuit simulation (PSIM).
At first, to ensure a volt-second balance for an inductor, the ripple of
iLm can be derived as follows:
Since
ipri and
im have the same value at
ts, as shown in
Figure 4, the peak value of the magnetizing current
impk can be obtained as follows:
where ωo is the angular frequency on the primary side and Ipri is the peak value of the power line current.
Equation (2) can be used to calculate the impk because the offset value of im is zero. Taking this into account, impk can be expressed as half of the ripple of the magnetizing inductance current.
Then, the
impk simply become
In summary,
ts can be determined by substituting (4) for
impk as follows:
Based on Equation (5), if the magnetic core is fixed, the ts depends on not only the intensity of the primary current but also the load voltage across.
Taken together,
Po can be expressed by substituting (5) for
ts in Equation (1) as follows:
Based on (5) and (6), if
Ip and
Lm are fixed with a constant value, the
Po only depends on the load voltage across. To calculate the primary voltage for harvesting the maximum power
Vpri,max, Equation (6) is differentiated with respect to
Vpri as follows:
Thus, the maximum harvested power
Po,m can be derived from (6) to (8) as follows:
According to Equation (8),
Po,m increases with the intensity of the power line current and magnetizing inductance.
Figure 5 illustrates an example with
Lm = 30.4 μH and frequency = 60 Hz according to different power line currents. As the
ipri increases, the load voltage for maximum harvested power also increases according to Equations (7) and (8).
2.2. Design Consideration: Magnetic Saturation Effect in Magnetic Core
Equation (8) is helpful to confirm the relationship between the design parameters. However, from a practical point of view, magnetic saturation should be considered in the MEH design. The environment in which the MEH is installed can include irregular current flows and has a very wide current range. In other words, the magnetic core can be saturated by an extremely strong magnetic field intensity.
When the MEH is operated in the saturation region,
Po is drastically reduced because there are no changes in magnetic flux density and the reduction of the
Lm value, as shown in
Figure 6. Here, it is assumed that the primary voltage and load voltage are the same due to the supercapacitors across the load.
As the primary voltage across the load increases, the
Lm no longer maintains a constant value. To determine the saturation voltage
Vsat, a voltage second balance between the maximum flux is set by the saturation flux density
Bsat for the magnetic core, and the applied voltage is integrated over half period.
where the cross-sectional area of the magnetic core and the number of primary winding turns are expressed as Ae and Np, respectively.
According to [
11], in the expression on the right side of Equation (9), the coefficient ‘2’ before
Bsat on the left side means that the magnetic flux density is changed from one end of the
B–
H curve(−
sat) to the other end of the
B–
H curve(+
Bsat), which results in a total change of 2
Bsat in a half period.
To prevent saturation in the magnetic core,
Vpri must be determined under the
Vsat, which can be expressed as follows [
14]:
However, MEH can also be saturated with temperature rises. In general, the saturation magnetic flux density characteristic of a magnetic material decreases with rising temperature, as shown in
Figure 7. When the temperature rises, the above Equations (1)–(10) are invalid due to the changes in the properties of magnetic material, such as
Lm and
Bsat.
If the temperature effect is not taken into account in the MEH design, as in the conventional design method, the magnetic core may be easily saturated and operated in the hard saturation zone. As a result, heat is generated due to increasing core loss, and the power density may be reduced. Until now, there has been no research considering these effects. So, it is necessary to consider the effect of temperature rise for maximum power extraction in the MEH design.
3. Proposed Harvesting Method for Maximum Power Considering the Magnetic Saturation Effect Due to Temperature Changes
3.1. Proposed Algorithm for Maximum Power Extraction in MEH by Considering Temperature Dependence
The conventional method of maximum power extraction aims to prevent saturation by controlling the primary voltage, which can be derived from (7) and (10). From a practical point of view, this is not effective since the variation in magnetic flux density with rising temperature will cause a change in Vsat. As a result, the output performance of the MEH is degraded when operating in the hard saturation region.
If the change in magnetic flux density with temperature changes can be predicted, magnetic saturation can be prevented, and the power density can be increased compared to the conventional design method. A design method to solve the above challenges related to temperature dependence in MEH is proposed, as shown in
Figure 8.
In the conventional methods, the maximum power is extracted by measuring the line current and adjusting the load voltage accordingly. According to Equation (7), the primary voltage is determined for harvesting the maximum power. However, the conventional design method [
11,
12] does not consider the temperature dependence of the magnetic material in the magnetic core. So, it is not robust to variable temperature conditions, and as a result, the power density is greatly reduced due to the incorrect selection of the optimal load voltage.
In order to solve the above problems, the B–H curve information, according to temperature changes, was estimated through the proposed modeling. The additional part added to the conventional algorithm is marked in yellow. In the content added to the existing algorithm, based on the proposed B–H curve model, which is temperature-dependent, Bsat and Lm are re-estimated and reflected in the MEH design. By adjusting refined Vpri,max, maximum power can be harvested according to the temperature change. As a result, power density can be improved compared to the existing design method.
The control scheme for maximum power extraction is shown in
Figure 9. The variable
Lm is controlled by the variation of
Vpri through a DC/DC converter. However, in this case, the characteristic of the magnetic material is changed according to the magnetic core’s temperature. Therefore, the control scheme is needed to become a robust system against disturbance, such as the variation of temperature.
In order to confirm the magnetic core’s temperature changes, the temperature is measured using a thermometer. Based on the measured temperature, a B–H curve model is selected according to temperature. Through the comparator, the error between the reference voltage and the measured Vpri is confirmed, and saturation voltage is reset by considering temperature dependence. Here, the reference voltage is Vpri according to temperature variation. Taken together, the maximum power is extracted by adjusting the Vpri through DC/DC converter.
3.2. Proposed Theoretical Model for Temperature Dependence in the B-H Curve
In this section, the principle of the proposed theoretical model of the B–H curve is going to be explained. According to the previous analysis based on Equations (1)–(10), Bsat and Lm are important design factors when determining the power density of the MEH. The two design parameters are determined using the B–H curve of the magnetic material.
According to [
11], the
B–
H curve can be modeled with the ‘arctangent’ function as follows:
where the magnetic flux density, the magnetic field intensity, and the inner radius of the magnetic core are expressed as B, H, and Rin, respectively.
The ‘2/π’ is a scaling factor, which is used to normalize the arctangent function to 1 when the magnetic core is saturated. The ‘
α’ describes the sensitivity factor in the linear region and determines relative permeability, which affects the
Lm value [
11]. However, one limitation of Equations (11) and (12) is that
Bsat is a constant value and thus cannot accurately reflect the change in the properties of the magnetic material as the temperature varies. As described in the previous section, the main difference is the reduction of
Bsat as the temperature rises. For example, at 175 °C,
Bsat decreases by 55% compared to room temperature. Besides, the gradient (i.e., relative permeability) changes in the linear region also have an effect. Therefore, it is necessary to model the changes in
Bsat and
α with the temperature changes.
To solve the above problems, the proposed theoretical model was based on a combination of physical and empirical approaches to represent the experimental data-related temperature. The
Bsat response with temperature is shown in
Figure 10a. In this figure,
Bsat decreases as the temperature rises, which means that the magnetic core is more easily saturated as temperature rises. In other words, the MEH can be saturated not only by the magnetizing current but also by the rising temperature.
To describe the reductions of
Bsat with increasing temperature, an exponential decay model is used, as follows:
where Tref is room temperature, 298 K (=25 °C) and T is the ambient temperature.
The ‘
α’ response with temperature variation is shown in
Figure 10b. To describe the variation in ‘
α’ with temperature rise, ‘
α’ can also be expressed as a function of temperature with an exponential decay model, as follows:
where αref is the sensitivity factor at room temperature. Using the proposed model, Equations (11) and (12) can be replaced by substituting (13) for Bsat. Similarly, Equation (12) can be also replaced by substituting (14) for ‘α’. As a result, the accuracy can be significantly improved compared to the existing model.
4. Experimental Results
Based on the above analysis, the feasibility of the proposed design method was tested using experimental results. The magnetic core was manufactured in a toroidal form by laminating a sheet-type Mn-Zn ferrite PL-7 [
15]. The detailed parameters of the magnetic core are listed in
Table 1.
To verify the proposed method, an experimental setup was built, as shown in
Figure 11. To confirm the temperature effect for the MEH design, the magnetic core and power line were placed in a temperature-controlled chamber. The temperature range in the chamber was from 25 to 200 °C. In the constant voltage condition, the load voltage was adjusted through an electronic load (KIKUSUI PLZ1004W, KIKUSUI ELECTRONICS, Yokohama, Japan). Since the optimal load voltage varies depending on the primary current, the duty ratio was adjusted to determine the optimal load, and then power measurement was performed.
To compare the results of the proposed model and the measurement results, the
B–
H curve can be extracted based on the IEEE standard [
16]. For the first time, to consider the temperature dependence, the test sample was placed in a temperature chamber. The temperature range in the chamber was from 25 to 200 °C. The temperature of the magnetic material was measured using a thermocouple and collected via a DAQ system. Power measurements were conducted under the condition that the chamber temperature and the magnetic material temperature were the same. Ferrite was selected as the magnetic material, and the magnetic core was manufactured in a toroidal form by laminating a sheet type.
Figure 12 illustrates measurement examples with
T = 443 K (=175 °C) compared to the conventional model.
Figure 12a shows a significant difference between the experimental results and the theoretical model. The cause of the error is that the change in
Bsat according to temperature was not reflected in the model [
11]. To address the above problems,
Bsat variation according to temperature was reflected in the model, as shown in
Figure 12b. The accuracy of the theoretical model was significantly increased compared to the previous model, but it was not perfectly accurate near the knee point. The shaded circular area expressed in gray indicates the knee point of the magnetic material. Finally,
Figure 12c shows the proposed model, which considers both
Bsat and ‘
α’ in order to reflect the change in permeability near the knee point. The main difference from the theoretical model applied in
Figure 12b is that the change in permeability at the knee point is considered. Using the proposed model, the magnetizing inductance can be more accurately extracted than when using the existing model under variable temperature conditions.
Figure 13 shows the
Po measured with the power analyzer (YOKOGAWA WT1800, Yokogawa, Tokyo, Japan) under varying load voltage according to different temperature conditions of 25, 50, 100, and 150 °C, respectively. At 25 °C, it has a
VL,max of 5.927 V, but the maximum
Po decreases as the temperature rises. The reason is that as the
Lm value with temperature rises,
VL,max also changes. To compensate for this, the proposed design method adjusts the
VL according to temperature and tracks the point of maximum
Po.
Figure 14a shows the
Po response with a
VL according to temperature
. When the temperature in the chamber increases, the maximum
Po gradually decreases. Interestingly,
VL,max and
Vsat also decrease with rising temperature. This means that the MEH can operate under saturation conditions depending on the temperature. If the effect of temperature is not taken into account, as with the conventional methods [
17,
18], there is a possibility that it will operate in the hard saturation section, and as a result, the output of the MEH will drastically decrease, and the reactive power will increase.
Figure 14b compares the maximum
Po with the conventional method according to temperature changes. The red bar indicates the maximum
Po when the proposed method is applied. The blue bar represents the maximum
Po of the MEH using the conventional method, which ignores the temperature effect. By considering the temperature variation effect, the proposed design method had a 26.5% higher output performance than the conventional method. This tendency is attributed to the reduction in the change in magnetic flux density in the magnetic core as the temperature increases.