1. Introduction
Quite a number of empirical studies have been undertaken to shed light on the connectedness of volatility across agricultural commodities (see, for example, refs. [
1,
2,
3,
4,
5,
6,
7], with [
8] highlighting that accounting for co-volatility of Chinese futures of five agricultural commodities (corn, cotton, palm, wheat, and soybeans) improved the accuracy of volatility forecasts—in particular for corn, cotton, and wheat. It must be noted that the underlying spillovers of risk across agricultural commodities is not surprising, given that behavioral, macroeconomic, and financial shocks, which define the underlying state of these markets, tend to be common and that the commonality has grown stronger in recent years (see the detailed discussions in [
9,
10,
11] in this regard). We contribute to this area of research by exploring whether stacking algorithms that have been developed in the recent bioinformatics literature can help to improve the accuracy of out-of-sample forecasts of the intraday data-based realized volatility (RV) of 15 important agricultural commodities during the daily sample period of July 2015 to April 2023.
An important advantage of using RV for our empirical analyses derives from the rich information contained in intraday data, besides being a consistent and asymptotically unbiased estimator of volatility [
12,
13,
14]. In addition, RV is an observable and unconditional metric of “volatility”. This, in turn, is unlike the latent processes underlying the class of Generalized Autoregressive Conditional Heteroskedasticity (GARCH) and Stochastic Volatility (SV) models that have been widely used in predicting agricultural commodity price volatility (see [
15,
16] for reviews of this extensive literature). Moreover, the dynamics of RV can be easily modeled by means of the heterogeneous autoregressive (HAR)-RV model [
17]. The HAR-RV model has been extensively studied in research on realized volatility, including that of agricultural commodities (as reviewed in [
18,
19,
20]) because it is able to capture long-memory and multi-scaling properties of realized volatility, as reported by [
21,
22,
23]. Because the HAR-RV model employs RVs at different time resolutions to model and predict RV, it can be interpreted as a simple empirical representation of the heterogeneous market hypothesis (HMH; Ref. [
24], which stipulates that asset markets (in our case, markets for agricultural commodities) are populated by various types of market participants, such as investors, speculators and traders, who, in turn, in turn, vary in their sensitivity to information flows at high and low frequencies.
Another advantage of the HAR-RV model is that it can easily be adapted to a multi-task forecasting setting, i.e., a setting where a forecaster seeks to forecast not only the RV of a single agricultural commodity but the RVs of several agricultural commodities simultaneously. One possibility to address such a multi-task forecasting problem is to consider as a modeling framework one of the multivariate HAR-RV models with heteroskedastic error structures, as has been studied by, for instance, refs. [
5,
8,
25,
26,
27,
28]. The focus of many studies in this area, however, has been on modeling and forecasting co-volatilities (see, for example, refs. [
5,
27,
29,
30,
31,
32]). Moreover, applications of HAR-RV cum heteroskedastic error models are often restricted to settings where the number of RVs to be analyzed is relatively small, as was the case in [
5,
8], involving seven and five agricultural commodities, respectively. This is due to the fact that, in a multivariate setting, the number of parameters to be estimated rapidly increases in the dimension of the model unless a researcher is willing to impose restrictions on parameters and/or functional forms so as to obtain a parsimonious representation of the heteroskedastic error structures.
In our case, the dataset comprises the RVs of 15 agricultural commodities (and, in an extended model, the RVs of three additional important energy commodities and the RVs of five precious metals), so we use various computationally efficient multi-task stacking algorithms that have been proposed in the recent bioinformatics literature (along with a multivariate shrinkage estimator) to re-examine the out-of-sample predictability of the RVs of the commodities in our sample (for a recent application of stacking in a univariate forecasting exercise of stock returns, see [
33]). We also focus on direct spillovers among the RVs as captured by a multi-task HAR-RV model and do not consider the issue of forecasting co-volatility, which requires the imposition of further structure on the residuals. The multi-task stacking algorithms are easy to implement, even when the dimension of the model is large. Moreover, they make it possible to employ and combine alternative popular machine learning algorithms that make it possible to estimate a multi-task HAR-RV model in a data-driven way, that is, without imposing any specific structure that restricts the spillover dynamics across the RVs a priori. Finally, the multi-task stacking algorithms can be set up in a way such that the resulting statistical model captures potential nonlinear structures in the data, an issue that certainly deserves special attention in the wake of the type of sudden outbreaks and clustering of volatility typical of financial markets and of markets for agricultural commodities as well. In the process, our paper adds to the growing literature on modeling and predicting the RVs of agricultural commodities by investigating the role of volatility spillovers; thus far, researchers in this literature have otherwise relied on realized moments (such as realized kurtosis and realized jumps) and various other predictors that relate, for example, to the state of financial and other (non-agricultural) commodity markets, investor sentiment, climate change-related risks, and infectious disease-related uncertainty (see, for example, [
8,
15,
16,
18,
19,
20,
34,
35,
36,
37,
38,
39]).
Agricultural commodities have become increasingly financialized [
40,
41,
42]. This process has caused institutional investors to increase their holdings in agricultural commodities relative to traditional assets. Naturally, besides the academic value of our work, accurate forecasts of the volatility of agricultural commodity prices are of key importance for investors because volatility is a core input in investment and portfolio allocation decisions, risk management, derivatives pricing, and assessments of hedging performance [
43,
44]. In addition, agricultural commodities comprise a large proportion of household consumption spending, implying that price volatility in agricultural commodities markets is likely to have substantial consequences for food security, especially as far as the economically vulnerable groups of the population are concerned [
45,
46,
47]. Hence, from a policy perspective, it is important to produce accurate high-frequency forecasts of agricultural commodity price volatility so that policies can be discussed and implemented in a timely manner to protect vulnerable groups, in particular, from large and adverse food price fluctuations [
48,
49].
In order to present our empirical findings, we organize the rest of the paper as follows. In
Section 2, we provide a description of the data we use in our study, while in
Section 3, we outline our methods. In
Section 4, we present our empirical results. In
Section 5, we conclude the paper.
2. Data
In our empirical analysis, we use data on the RVs of 15 agricultural commodities. The data are available publicly for download from the Internet page of Professor Dacheng Xiu. (Internet address:
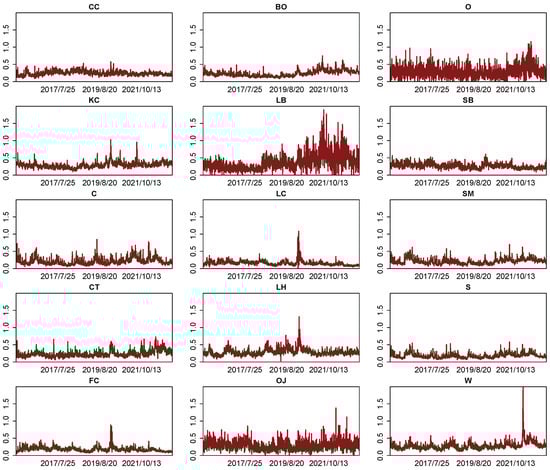
https://dachxiu.chicagobooth.edu/#risklab. Data downloaded on 4 May 2024). The data are based on (Globex) data for the following 15 agricultural commodity futures: soybean oil futures (BO), cocoa futures (CC), corn futures (C), cotton no. 2 futures (CT), feeder cattle futures (FC), coffee C futures (KC), lumber futures (LB), live cattle futures (LC), lean hog futures (LH), orange juice futures (OJ), oat futures (O), sugar #11 futures (SB), soybean meal futures (SM), soybean futures (S), and CBOT wheat futures (W). After matching the data by date, the matched dataset starts on 27 July 2015 and ends on 28 April 2023. We plot the RV data of the agricultural commodities in
Figure 1. The RVs display a discernible heterogeneity across the agricultural commodities, and they also exhibit the type of clusters and sudden outbursts characteristic of many financial market volatilities.
In order to obtain a first glimpse of the comovement of the RVs, we plot their full-sample contemporaneous correlation matrix in
Figure 2. The contemporaneous correlations vary from weakly negative to strongly positive, with the positive correlations mainly collected in the lower part of the matrix. For example, we observe strong positive contemporaneous correlations between C and S, S and SM, and LC and FC, among others. While the full-sample contemporaneous correlations shed light on an important feature of the data, one should bear in mind that the correlations do not inform about the question as to whether the comovement of the RVs can be exploited in a multi-task out-of-sample forecasting exercise to improve predictive accuracy at various forecast horizons.
5. Concluding Remarks
Modeling and forecasting realized volatilities of financial asset prices, in general, and of commodity price fluctuations, in particular, is of key importance for financial market participants and policymakers. Financial market participants rely on accurate forecasts of realized volatilities when solving portfolio optimization problems and pricing derivative securities. Policymakers, in turn, need accurate forecasts of realized volatilities when designing policies to mitigate the potential adverse effects of a rise in economic and—in case of agricultural commodities—perhaps even political uncertainty associated with sudden increases in the volatility of price fluctuations. A natural and important research question, therefore, is whether forecasts of the realized volatilities of commodity price fluctuations can benefit when a forecaster takes into account spillover effects across the realized volatilities of agricultural commodities. The results we report in this research clearly demonstrate that such spillover effects exist, that they can be strong, that they may vary over time, and that accounting for spillover effects by means of a simple HAR-RV-S model has beneficial effects in an in-sample analysis. However, we do not observe systematic out-of-sample forecasting gains relative to a classic HAR-RV model.
In order to obtain out-of-sample forecasts of the RVs of 15 agricultural commodities (and, in an extended model, three energy commodities and five precious metals), we use various multi-task stacking algorithms, as well as a multivariate shrinkage estimator. The multi-task stacking algorithms, in particular, have the advantage of being straightforward to implement in high-dimensional multi-task forecasting problems. Modeling and forecasting the realized volatilities of the various agricultural commodities that we studied in this research can be interpreted as belonging to this class of problems. While the multivariate shrinkage estimator retains a simple linear structure of the forecasting model, the multi-task stacking algorithm opens up the possibility of combining different base and meta learners, where for the latter, we also have use regression trees so as to explore potential nonlinear structures in the data. Irrespective of the algorithm or combination of base and meta learners that we studied, we obtained the same main finding that spillover effects do not leverage out-of-sample forecast accuracy relative to the classic HAR-RV model. Our main finding implies that the research strategy used by some researchers in recent papers (see, for example, refs. [
18,
19,
20]) to forecast the RVs of agricultural commodities in an univariate modeling approach is likely to be a good starting point for further analysis and can be also considered beneficial from the perspective of investors looking for optimal portfolio allocations and policymakers aiming to stabilize food prices.
This does not mean that a multivariate modeling approach cannot yield important additional and novel insights. In fact, in future research, it would be interesting to study whether other algorithms developed in the large and rapidly growing machine learning literature corroborate our main finding or whether the application of other algorithms brings to the forefront features of the data that the algorithms and estimators we applied in our research fail to detect. In technical terms, it is also interesting to explore how the stacking algorithms we studied in this research can be combined with the type of multivariate HAR-RV cum GARCH models discussed in related earlier literature. Such an extension would also render it possible to more directly compare the results we report in this paper with the results that [
8] reported in their recent empirical study of a small set of agricultural commodities (with a shorter sample period and using Chinese data). Furthermore, against the background of the much discussed financialization of commodity markets, it is worthwhile to investigate whether accounting for spillover effects across the realized volatilities of different asset classes (for example, agricultural commodities and stock markets) yields insights that can help to improve the accuracy of out-of-sample forecasts of realized volatilities (as in, for example, ref. [
26]).