
1. Introduction
Recent advancements in IoT applications have pushed the boundaries of what these technologies can achieve, particularly in domains involving drones and satellites. Drones are increasingly used for tasks such as surveillance, delivery, and environmental monitoring, requiring real-time communication and coordination within IoT networks. Satellite-based IoT systems are enhancing connectivity in areas where terrestrial networks are unavailable, such as remote regions, oceans, and deserts. By leveraging Low Earth Orbit (LEO) satellites, IoT devices can maintain consistent communication over vast distances, enabling applications in environmental monitoring, disaster management, and global logistics. These advancements address critical challenges in the IoT, including ensuring reliable communication over long distances, optimizing energy usage, and managing complex network topologies.
The objective is to provide researchers and practitioners with a comprehensive analysis of the tools and methodologies used in studying network diffusion in IoT environments. By highlighting the strengths and limitations of various algorithms and simulators, this review aims to guide the selection of appropriate tools for simulating and evaluating IoT and Space IoT systems.
This paper makes several significant contributions. It presents a comprehensive systematic literature review of network diffusion algorithms, simulators, and topologies within IoT and Space IoT, encompassing research from 2013 to 2024. Unlike previous surveys, this study is the first to integrate all three aspects—diffusion algorithms, network simulators, and network topologies—into a single, cohesive framework. By adhering to the PRISMA methodology, it ensures a rigorous and transparent selection process, addressing gaps left by earlier reviews. The study categorizes and examines key diffusion models, including epidemic, cascading, and threshold-based approaches, assessing their effectiveness across diverse IoT and Space IoT environments. Additionally, it evaluates widely used network simulators, such as NS-3, Cooja, and OMNeT++, analyzing their capabilities, scalability, and suitability for different network scenarios. Beyond this, the review identifies essential performance metrics—including scalability, energy efficiency, latency, and packet delivery ratio—providing valuable insights into the strengths and limitations of various diffusion models and simulators. Finally, the study outlines open challenges and future research directions, underscoring the need for more adaptable and resource-efficient models to meet the evolving demands of IoT and Space IoT systems.
2. Methodology
2.1. Research Question Formulation
A crucial step in conducting an SLR is to formulate clear and focused research questions that guide the entire review process. The following research questions were defined to address specific aspects of diffusion algorithms, network simulators, and their performance in IoT and Space IoT configurations:
Research Question 1: General What are the key diffusion algorithms and network simulators utilized in the literature to study network diffusion in IoT and Space IoT configurations, and how do these algorithms perform in various scenarios?
Research Question 2: Network Simulators Which network simulators are commonly employed in the literature to simulate and study network diffusion in IoT and Space IoT configurations, and what are their features and limitations?
Research Question 3: Network Diffusion Algorithms What are the key characteristics, strengths, and weaknesses of network diffusion algorithms used in studies focusing on network diffusion in IoT and Space IoT configurations?
Research Question 4: Network Architecture How does the choice of network architecture impact the performance of network diffusion algorithms in IoT and Space IoT configurations?
Research Question 5: Network Diffusion Performance Evaluation What performance metrics are commonly used to evaluate the effectiveness of network diffusion algorithms in IoT and Space IoT configurations, and how do these algorithms perform under various scenarios?
Research Question 6: Performance evaluation of the network simulator How do existing network simulators perform when simulating network diffusion in IoT and Space IoT configurations, and what are the key metrics used to evaluate their performance?
These research questions are designed to guide this literature search and review, ensuring that the existing literature relevant to the study’s objectives is comprehensively analyzed.
2.2. Search Strategy
2.2.1. Identification of Databases
For this SLR, Google Scholar and Scopus were selected as primary databases due to their extensive coverage and relevance to the research topics of network diffusion, the IoT, and Space IoT.
2.2.2. Keywords and Phrases
After careful consideration and filtering, the research narrowed down its focus to key terms and concepts essential for the investigation. The following keywords and phrases formed the foundation of the search strategy:
Network Diffusion;
IoT;
Diffusion Algorithms;
Propagation Models;
Simulation;
Network Simulators.
2.2.3. Combinations Using Boolean Operators
Search strings combining relevant keywords and Boolean operators were developed to ensure a comprehensive coverage of the relevant literature:
Combination 1: ("network diffusion" OR "information propagation") AND ("IoT" OR "Internet of Things") AND ("diffusion algorithms" OR "propagation models") AND ("simulation" OR "network simulators");
Combination 2: (("Network" AND "Diffusion") OR ("Network" AND "Propagation") OR ("Network" AND "Spreading") OR ("Network" AND "Simulator") OR ("IoT" AND "Diffusion") OR ("IoT" AND "Propagation") OR ("IoT" AND "Spreading") OR ("IoT" AND "Simulation")) AND NOT Deep learning NOT Neural network.
2.2.4. Pilot Searches
Pilot searches were conducted to assess the relevance and specificity of the search strings. The search strategy was refined on the basis of the initial results to ensure optimal retrieval of the relevant literature.
2.2.5. Papers Using API
2.3. Inclusion and Exclusion Criteria
Inclusion and exclusion criteria are essential to ensure the selection of studies that align with research objectives while maintaining precision and relevance.
2.3.1. Objective
The objective of establishing inclusion and exclusion criteria is to create a clear framework for selecting studies that meet defined standards, thereby enhancing the quality and focus of the systematic literature review.
2.3.2. Inclusion Criteria
Academic Sources: These included academic sources from reputable journals, conference proceedings, and academic publishers to ensure the reliability of the information. While peer-reviewed papers were prioritized, some preprints from ArXiv were also considered. These were included based on their relevance, contribution from established researchers, and citation impact.
Publication Date: This included studies published within the last 12 years (from 2013 to 2024) to capture recent advancements in the field.
Top-Ranked Papers: These included the first papers ranked from 1 to 50 on the Publish or Perish software (8.17.4863) using the specified combination.
Language: This included studies published in English to align with the research team’s language proficiency.
2.3.3. Exclusion Criteria
Non-Academic Sources: We excluded non-academic sources, such as blogs or commercial publications, to maintain the reliability of the information.
Outdated Studies: We excluded studies published before 2013 to focus on recent developments and trends in network diffusion algorithms.
Non-Top-Ranked Papers: We excluded papers ranked after the top 50 on the Publish or Perish software (8.17.4863) using the specified combination.
Language: We excluded studies published in languages other than English, as the research team is proficient in English.
These criteria were established to ensure the selection of studies that meet defined standards and contribute to the objectives of the systematic literature review.
2.4. Study Selection
2.4.1. Step 1: Finding and Initial Check
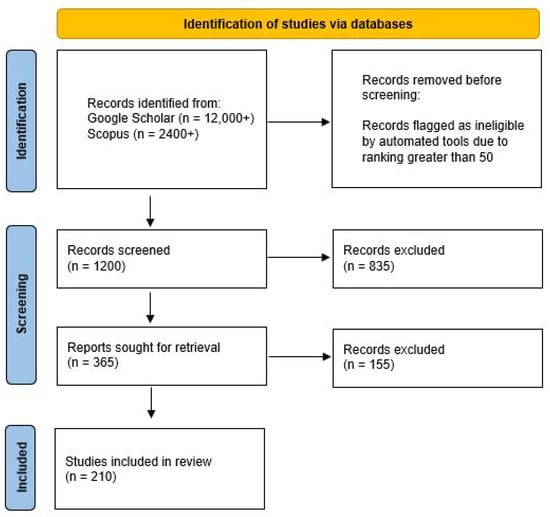
Using Harzing’s Publish or Perish tool, more than 12,000 papers were gathered based on keyword searches. This step facilitated the identification of a broad selection of papers as an initial dataset for this review.
2.4.2. Step 2: Applying Criteria and Checking Titles/Abstracts
To ensure a focus on the most relevant and high-quality papers, specific selection criteria were established. These included the publication date, language, and the paper’s relevance to the research questions. A thorough screening of the titles and abstracts was conducted to assess their alignment with the study’s objectives.
This manual selection process was carried out without automated tools, relying on careful reading and judgment to ensure accuracy. By applying this approach, the list of papers was refined into a more targeted selection for in-depth review.
2.4.3. Details of Criteria and Screening
2.4.4. Step 3: Reading Full Papers and Checking Quality
In the final step, the full papers from the selected studies were reviewed to determine their relevance and reliability for the study.
2.4.5. Final Set of Papers for Analysis
This approach ensured the selection of the most relevant papers that contribute effectively to this research.
3. Survey Comparison
Q1: Does this survey include network simulators?
Q2: Does this survey include diffusion algorithms?
Q3: Does this survey include categories of diffusion algorithms?
Q4: Does this survey include network topologies?
Q5: Are the algorithms, simulators, and topologies covered until 2024?
Q6: Does this survey evaluate the performance of algorithms, simulators, or topologies using specific metrics?
Table 1.
Comparison of surveys on diffusion algorithms and simulators.
4. Analysis
4.1. Analysis of Research Question 2 and Research Question 6: Network Simulators in IoT and Space IoT Configurations and Their Performance Evaluation
Through a comprehensive review of the selected literature from 2013 to 2024, several network simulators were identified as prevalent tools for simulating and studying network diffusion in IoT and Space IoT environments. These simulators vary in terms of capabilities, scalability, extensibility, and suitability for different IoT scenarios. Additionally, their performance was evaluated based on key metrics such as scalability, energy consumption, latency, and packet delivery ratio (PDR).
The year of publication—Identifying trends in network simulation research.
Simulator or extension name—Listing either the standalone simulator or a new module/extension built upon an existing tool.
Base simulation platform—Showing whether a simulator is standalone or built as an extension of existing tools such as NS-3, OMNeT++, or Cooja.
The inclusion of these tables provides insight into the evolution of IoT network simulation, helping researchers select the most suitable simulation tools based on their specific research requirements. The wide range of simulators listed demonstrates the growing need for customizable, scalable, and domain-specific network modeling solutions in both traditional IoT and Space IoT configurations.
The most commonly employed network simulators include the following:
NS-3;
Cooja (with Contiki OS);
OMNeT++.
Table 2.
Simulators, emulators, and extensions used in IoT and Space IoT (Part 1).
Table 2.
Simulators, emulators, and extensions used in IoT and Space IoT (Part 1).
| N | Year | New: Emulator, Simulator, or Module | Base Simulator |
|---|---|---|---|
| [21] | 2013 | High-level sensor simulator | |
| [22] | 2013 | IoT-LAB | |
| [23] | 2013 | SMSim | |
| [24] | 2013 | New RFID module | NS-2 |
| [25] | 2013 | EstiNet | |
| [26] | 2013 | Nano-Sim | NS-3 |
| [27] | 2013 | NS-3 | |
| [28] | 2014 | Extension | DEUS, NS-3, Cooja |
| [29] | 2014 | Extension | Cooja, Contiki |
| [30] | 2014 | Extension | NS-3 |
| [31] | 2014 | Extension | Qualnet simulation platform |
| [32] | 2014 | SimuLTE | OMNeT++ |
| [9] | 2014 | Multi | |
| [33] | 2015 | Semantic Sensor Simulator | |
| [34] | 2015 | NetSim | |
| [6] | 2015 | Cooja, Contiki | |
| [35] | 2015 | MmWave Module | NS-3 |
| [36] | 2015 | SenseSim | |
| [37] | 2016 | CupCarbon | |
| [38] | 2016 | MobIoTSim | |
| [4] | 2016 | Extension | NS-3 |
| [39] | 2016 | ASSIST | |
| [40] | 2017 | iFogSim | |
| [41] | 2017 | Simulation Engine | |
| [42] | 2017 | Algo Extension | Cytoscape |
| [14] | 2017 | Multi | |
| [43] | 2017 | IOTSim | Cloudsim |
| [44] | 2017 | LoRaSIM | |
| [45] | 2017 | ECMO simulation system | |
| [46] | 2017 | COOJA, Contiki | |
| [47] | 2017 | NoS simulator | OMNet++ |
| [48] | 2018 | Extension | NS-3 |
| [49] | 2018 | Extension | LoRaSim |
| [50] | 2018 | Extension | OMNet++ // Matlab |
| [51] | 2018 | Extension | NS-3 |
| [52] | 2018 | IoT smart grid testbed simulator | |
| [53] | 2018 | OPNET | |
| [54] | 2018 | Extension | Cooja, Contiki |
| [55] | 2018 | QualNet 6.1 | |
| [56] | 2018 | CloudSim // Cooja Contiki | |
| [57] | 2018 | CupCarbon | |
| [5] | 2018 | OMNET++ | |
| [58] | 2018 | NS-2 | |
| [59] | 2018 | FlyNetSim | NS-3 // ArduPilot |
| [60] | 2019 | YAFS | |
| [61] | 2019 | Extension | NS-3 |
| [62] | 2019 | LoRa-MAB | |
| [63] | 2019 | VLE | |
| [64] | 2019 | IoTNetSim | |
| [16] | 2019 | Multi |
Table 3.
Simulators, emulators, and extensions used in IoT and Space IoT (Part 2).
Table 3.
Simulators, emulators, and extensions used in IoT and Space IoT (Part 2).
| N | Year | New: Emulator, Simulator, or Module | Base Simulator |
|---|---|---|---|
| [65] | 2019 | NS-3 | |
| [66] | 2019 | CyprIoT framework | |
| [67] | 2020 | CupCarbon | |
| [17] | 2020 | Multi | |
| [68] | 2020 | RelIoT | NS-3 |
| [69] | 2020 | Cooja, Contiki | |
| [70] | 2020 | Cooja, Contiki | |
| [71] | 2020 | Extension | NS-3 |
| [72] | 2020 | STEP-ONE | ONE simulator |
| [73] | 2020 | DTMSim | |
| [74] | 2020 | ||
| [75] | 2020 | Extension | OMNet++ // FogNetSim++ |
| [76] | 2020 | Dockemu | NS-3 |
| [77] | 2020 | xFogSim | |
| [78] | 2021 | LoRaWANSim | |
| [79] | 2021 | ROS-NetSim | NS-3 // Gazebo |
| [80] | 2021 | Extension | Cooja, Contiki |
| [81] | 2021 | IoTSim-Osmosis | |
| [82] | 2022 | NS-3SAAS | NS-3 |
| [83] | 2022 | ||
| [84] | 2022 | Cooja, Contiki | |
| [85] | 2022 | Large-scale NB-IoT | |
| [18] | 2022 | Simulator for blockchain with IoT | |
| [86] | 2022 | Faulty IoT network simulator | |
| [87] | 2022 | ADIperf framework | |
| [88] | 2022 | FLORASAT | OMNeT++ |
| [89] | 2023 | Cooja, Contiki | |
| [90] | 2023 | Extension | NS-3 |
| [91] | 2023 | FLoRa | OMNeT++ |
| [92] | 2023 | StackNet | NS-3 |
| [93] | 2023 | Kaala 2.0 | |
| [94] | 2023 | PIot | |
| [95] | 2023 | NS-3 Docker Emulator | NS-3 |
| [96] | 2023 | NS-2.35 | |
| [97] | 2024 | Lr-WPAN, 6LoWPAN | NS-3 |
| [98] | 2024 | NDT | NS-3 |
| [99] | 2024 | GothX | Gotham |
| [100] | 2024 | Extension | ZigBee network simulator |
| [101] | 2024 | GI-ITM | |
| [102] | 2024 | Custom simulator (Python-based) | |
| [103] | 2024 | MAPE | AFTER |
| [104] | 2024 | SWI-FEED | NS-3 |
| [1] | 2024 | UDP module extension | Cooja, Contiki |
| [105] | 2024 | NetSim |
4.1.1. NS-3
Overview
Features
Extensibility: NS-3 supports a modular architecture, allowing easy integration and extension of new protocols and models.
Realism: Provides realistic simulation models for various network protocols and technologies.
Support for IoT Protocols: Includes modules and extensions for simulating IoT-specific protocols such as LoRaWAN and NB-IoT.
- Visualization Tools: Supports integration with external visualization tools, including NetAnim [107] for 2D simulation and NetSimulizer [108] for 3D simulation. These tools enhance the analysis and representation of simulation results, providing detailed insights into network behavior and performance.
Scalability: Capable of simulating large-scale network scenarios, typically involving thousands to tens of thousands of nodes and plus, high traffic loads, and diverse communication protocols. The simulation complexity increases based on node interactions, mobility models, and protocol layers, making NS-3 suitable for evaluating extensive IoT and Space IoT deployments.
Support for Multiple Programming Languages: Primarily supports C++ and provides Python bindings for ease of use.
Support for Wireless Technologies: NS-3 provides built-in support for wireless communication models, including Wi-Fi, LTE, and 5G, with ongoing research into 6G integration. It allows for the testing of routing algorithms, noise models, fault tolerance mechanisms, and packet drop rates, making it ideal for large-scale IoT simulations.
Limitations
Steep Learning Curve: Requires substantial understanding of network protocols and programming proficiency, which may be challenging for beginners.
- Resource-Intensive: Large-scale simulations in NS-3 can be computationally demanding, especially when modeling networks with over 10,000 nodes, high event densities, and complex protocol stacks. These simulations typically require processing times ranging from a few minutes to several hours, depending on the scenario’s complexity. For example, simulating a 6144-host network can take 11 to 27 h to advance just five seconds of simulated time [109]. Similarly, a 5G network simulation with 5700 nodes and 19 towers required 10.4 h to simulate 1.5 s of real-time activity [110]. Memory usage is also significant, with simulations demanding at least 8 GB RAM for moderate scenarios and exceeding 32 GB RAM for larger-scale simulations [111]. High-performance computing clusters with 128 GB to 1 TB RAM per node are often used to handle such large-scale models efficiently.
Limited Built-in Support for Some IoT Scenarios: May require additional customization and module development to accurately simulate certain IoT-specific scenarios.
Complex Configuration: Setting up simulations can be complex due to detailed configuration requirements.
Notable Studies Using NS-3
- Ref. [30]: Simulated and compared different architectures’ performance in terms of delay, throughput, and control overhead.
- Ref. [4]: Extended NS-3 with modules to simulate LoRa systems, enabling performance analysis in various scenarios.
- Ref. [68]: Developed a reliability simulation framework using NS-3 to evaluate power, performance, temperature, and reliability aspects.
- Ref. [95]: Integrated Docker with NS-3 to simulate realistic IoT botnet scenarios.
Performance Metrics
Scalability: NS-3 is widely recognized for its scalability, making it suitable for large-scale IoT applications like LoRa networks and UAV simulations.
Latency and Propagation Delay: It is often used to evaluate latency in large-scale networks, including fog and edge computing environments.
Packet Delivery Ratio (PDR): NS-3 is frequently used to evaluate the PDR in various IoT environments, especially when testing different communication protocols.
4.1.2. Cooja (With Contiki OS)
Overview
Features
Hardware Emulation: Allows for the emulation of real hardware platforms, enabling accurate and realistic simulations.
Multi-level Simulation: Supports simulation at different abstraction levels, ranging from high-level network simulations, where entire communication stacks and protocol behaviors are modeled without detailed hardware interactions, to low-level hardware interactions, where individual sensor nodes, CPU instructions, and radio transceivers are emulated for precise performance analysis.
Energy Consumption Analysis: Provides tools to monitor and analyze energy consumption, which are crucial for IoT applications focused on energy efficiency.
Support for Various Radio Models: Includes multiple radio propagation models to simulate diverse environmental conditions.
Easy Integration of New Protocols: Facilitates the addition and testing of new network protocols within the simulation environment.
Graphical User Interface: Offers a user-friendly GUI for setting up and monitoring simulations, making it accessible to users with varying levels of expertise.
Wireless Communication and Fault Tolerance: Cooja is primarily designed for wireless sensor networks (WSNs) and low-power IoT applications. While it does not natively support LTE and 5G, extensions can be added. It includes configurable noise models, routing algorithms, and fault tolerance mechanisms for evaluating network reliability.
Requirements Addressed
NS-3 is equipped to handle diverse network simulation requirements, making it suitable for IoT and Space IoT applications. It supports wireless communication models, including Wi-Fi, LTE, and 5G, and ongoing research explores 6G integration. NS-3 also provides modules for evaluating routing algorithms, noise models, fault tolerance mechanisms, and packet drop rates. Its detailed physical (PHY) and medium access control (MAC) layer models allow for precise performance evaluation under various network conditions.
Limitations
Scalability Issues: May struggle with simulating very large-scale networks due to performance constraints.
Limited Support for High-Level Network Protocols: Focuses primarily on low-power networks and may require extensions to support heterogeneous IoT environments with diverse communication protocols (e.g., 5G, LPWAN, and edge computing), large-scale deployments exceeding 10,000 nodes, and highly dynamic network conditions such as mobile and space IoT scenarios.
Dependency on Contiki OS: Tight integration with Contiki OS may limit flexibility when experimenting with other operating systems or platforms.
- Performance Overheads: Cooja’s performance degrades significantly when simulating large-scale networks, particularly as the number of nodes increases beyond several thousand, due to memory constraints and CPU-intensive real-time debugging. While small-scale simulations (under 500 nodes) generally run efficiently, studies indicate that execution time and memory consumption grow exponentially with network size [113]. Simulations exceeding several thousand nodes often require optimized memory management techniques, such as reducing log verbosity and adjusting simulation granularity, to mitigate excessive delays [114]. The execution time is further impacted by complex radio propagation models, as Cooja’s event-driven simulation approach tracks each node’s state changes at high granularity. Additionally, being Java-based, Cooja may introduce performance overheads related to Java Virtual Machine (JVM) memory management and garbage collection, potentially leading to unpredictable execution slowdowns. Researchers have reported that simulations with 10,000+ nodes experience severe slowdowns and may require modifications or high-performance computing environments for stability [115]. This highlights the need for scalability enhancements when using Cooja for large-scale IoT deployments.
Notable Studies Using Cooja
- Ref. [6]: WSN-Maintain enhances Cooja by optimizing sensor coverage, extending network lifetime via redundant node management.
- Ref. [54]: Simulated security attacks and defense mechanisms in IoT networks.
- Ref. [70]: Evaluated the performance of IoT protocols under various network densities.
- Ref. [84]: Analyzed DDoS attack scenarios and potential mitigation strategies in IoT networks.
Performance Metrics
Energy Consumption: Cooja focuses heavily on energy efficiency, making it a go-to tool for simulating low-power IoT networks.
Latency: The simulator is often evaluated based on latency in real-time applications, although it struggles with scalability when simulating larger networks.
Packet Delivery Ratio (PDR): The PDR is another critical performance metric used in Cooja, especially in resource-constrained IoT environments.
4.1.3. OMNeT++
Overview
Features
Modular Architecture: Facilitates easy extension and customization through reusable modules.
Comprehensive Frameworks: Supports various frameworks like INET and Castalia for simulating different network protocols and environments.
Graphical Simulation Environment: Provides a robust GUI for designing, executing, and visualizing simulations.
Support for Complex Network Scenarios: Capable of simulating large and complex networks with diverse protocols and configurations.
Integration with Other Tools: Allows integration with external tools and libraries for enhanced simulation capabilities.
Active Community Support: Backed by a strong community providing support, tutorials, and extensions.
Wireless and Routing Algorithm Support: OMNeT++ supports multiple networking standards, including Wi-Fi, LTE, and 5G, via extensions such as INET. It enables detailed routing algorithm simulations, fault tolerance analysis, and network behavior modeling under various noise conditions.
Limitations
Complexity: The extensive features and configurations can be overwhelming for new users.
Performance Concerns: Simulating networks exceeding 10,000 nodes may lead to performance bottlenecks due to high memory consumption, increased event scheduling overhead, and computational complexity of detailed protocol modeling.
Steep Learning Curve: Requires a good understanding of C++ and network simulation concepts.
Notable Studies Using OMNeT++
Performance Metrics
Scalability and Flexibility: OMNeT++ is highly flexible, capable of modeling complex networks, and is often used for multi-layered simulations.
Latency and Packet Loss: OMNeT++ simulations often focus on measuring latency and packet loss, particularly in complex, large-scale network environments.
Energy Consumption: While OMNeT++ is not specialized for energy monitoring, it can be used to evaluate energy-related metrics in extended simulations.
4.1.4. Comparative Summary
4.1.5. Conclusions
NS-3 is recommended for detailed protocol analysis and large-scale network scenarios.
Cooja is ideal for low-power IoT applications and hardware emulation.
OMNeT++ is suitable for complex simulations involving diverse network protocols and configurations.
Distribution of network simulators: This chart represents the number of publications that utilized each simulator based on the included references in this paper. Ns-3 appears as the most widely used simulator, followed by Cooja (Contiki) and OMNeT++.
Figure 2.
Distribution of network simulators: This chart represents the number of publications that utilized each simulator based on the included references in this paper. Ns-3 appears as the most widely used simulator, followed by Cooja (Contiki) and OMNeT++.
4.2. Analysis of Research Question 3 and 5: Network Diffusion Algorithms and Performance Evaluation
4.2.1. Introduction
Diffusion Algorithm Type—Categorizes studies using Epidemic (EM), Cascade (CM), Threshold (TM), or Other (Oth) models.
Application Domain—Highlights where these models are applied, such as epidemic modeling, social networks, and wireless sensor networks.
- Network Considerations—The impact of network topology, heterogeneity, dynamicity, and multi-layered structures on diffusion performance. These aspects are discussed in detail in Section 4.3.
Survey of network topologies, algorithm categories, and related features (Part 1); full names corresponding to abbreviations available in Table 8 and Table 9.
| n | Year | Top | Het | App | Wgt | Dep | Dyn | Lay | L | Dir | Algo | Cat |
|---|---|---|---|---|---|---|---|---|---|---|---|---|
| [120] | 2013 | RT | Hm | BC | Dyn | SL | NL | MHBC | CM | |||
| [10] | 2013 | SN | Both | Both | Both | Many | ||||||
| [121] | 2013 | RW | Het | SN | Both | Int | Dyn | Both | SIR-SIS-LTM | EM-TM | ||
| [122] | 2013 | SF-RT | Inhm | SN | Int | Dyn | Undir | SIHR | EM | |||
| [123] | 2013 | RT | Het | SN | ML | SIR | EM | |||||
| [124] | 2013 | Het-Inhet | SN | Int | Undir | SIR | EM | |||||
| [125] | 2013 | LS | SN | Both | LR | Oth | ||||||
| [126] | 2013 | LS | SN | Wgt | Dyn | L | Dir | LRT | Oth | |||
| [127] | 2013 | SI1I2S | EM | |||||||||
| [128] | 2014 | Int | Dyn | ML | SIS-UAU | EM | ||||||
| [129] | 2014 | SW | Gbl | Int | Undir | LTM | TM | |||||
| [130] | 2014 | Wgt | Int | Dyn | Both | Oth | ||||||
| [131] | 2014 | RT-SF | Both | PHE | Int | Dyn | ML | SIRV-SIR | EM | |||
| [132] | 2014 | NM | Both | Dyn | Dir | RW | Oth | |||||
| [133] | 2014 | RT-SF | Het | Virus | ML | Undir | SI1SI2S-SIS | EM | ||||
| [134] | 2014 | SF-SW | Hm-Inhm | SN | Int | S | Undir | SIRaRu | EM | |||
| [135] | 2014 | RT-SF-SW | SCM | Int | Dyn | L | MTG-SIR | EM | ||||
| [136] | 2014 | Reg-RT-SF | Het | SN | S | Undir | SIR | EM | ||||
| [137] | 2014 | SW | Hm | SN | Int | SICR | EM | |||||
| [138] | 2014 | SN | Ind | Dyn | Many | CM-EM-Oth | ||||||
| [139] | 2014 | SF | Het | Health | Int | Dyn | SL | Undir | SIQRS | EM | ||
| [140] | 2014 | Hm | Rum | 2SI2R | EM | |||||||
| [141] | 2015 | Het | WSN | Wgt | Dyn | ML | LMS | Oth | ||||
| [142] | 2015 | RT-SF-SW | Het | SN | Int | Dyn | ML | Undir | Many | EM-CM-TM | ||
| [143] | 2015 | Art-Real | Both | SN | Int | Dyn | SEIR | EM | ||||
| [144] | 2015 | SN | Dir | ICM-LTM | CM-TM | |||||||
| [145] | 2015 | Het | SN | Int | ML | |||||||
| [146] | 2015 | Het | Health | Both | Int | Dyn | ML | Undir | LACS | EM | ||
| [147] | 2015 | Both | SN | Int | ||||||||
| [148] | 2015 | SN | Int | Dyn | Dir | COE | Oth | |||||
| [149] | 2015 | Het | SN | Dyn | SIR | EM | ||||||
| [150] | 2015 | L-S Net | ML | 2l | EM | |||||||
| [151] | 2015 | Lat | WSN | Dyn | SL | Bsd SIR | EM | |||||
| [152] | 2015 | RT-SW | Het | Agt Sim | Int | Dyn | Undir | Agt M | Oth | |||
| [153] | 2015 | SF | Het | SN | ISIR | EM | ||||||
| [154] | 2015 | SN | Dyn |
Survey of network topologies, algorithm categories, and related features (Part 2); full names corresponding to abbreviations available in Table 8 and Table 9.
| n | Year | Top | Het | App | Wgt | Dep | Dyn | Lay | L | Dir | Algo | Cat |
|---|---|---|---|---|---|---|---|---|---|---|---|---|
| [13] | 2016 | Lat-Star-SW | Both | Gbl | Int | Both | Both | Both | Both | SIS-SIR | EM | |
| [119] | 2016 | Het | Gbl | Int | Both | Many | ||||||
| [155] | 2016 | RT | Int | Undir | HCM-HCM * | EM | ||||||
| [156] | 2016 | Mesh | WSN | Dyn | ||||||||
| [157] | 2016 | RW | SN | Dir | IC-LT | CM-TM | ||||||
| [158] | 2016 | RT | Het | Ep | Dyn | SL | Dir | Mv | Oth | |||
| [159] | 2016 | WSN | ||||||||||
| [160] | 2016 | SN | Dir | TTV | Oth | |||||||
| [161] | 2016 | SF | Both | Mobile Net | Int | S | WSIS | EM | ||||
| [162] | 2016 | Het | SN | Dyn | Dir | Oth | ||||||
| [163] | 2016 | SN | Wgt | Dyn | SL | Dir | Oth | |||||
| [164] | 2016 | Petro Eng | Int | MDDM | Oth | |||||||
| [165] | 2016 | RT | Sens Net | Dyn | Undir | LMS | Oth | |||||
| [166] | 2017 | Lat | Both | Ranking | Int | Both | ML | Both | RW | Oth | ||
| [167] | 2017 | Health | Wgt | Int | Dyn | Both | RWR-RW | Oth | ||||
| [168] | 2017 | SN | Wgt | Int | Dir | Oth | ||||||
| [15] | 2017 | Both | SN | Wgt | Both | Dyn | Both | Both | Many | Many | ||
| [169] | 2017 | Tree-SW | Het | Forensic | Wgt | Both | Dir | SIS | EM | |||
| [170] | 2017 | SF | Het | SN | S | Dir | SEIR | EM | ||||
| [171] | 2017 | Hm | SN | Dyn | I2SR | EM | ||||||
| [172] | 2017 | Het | WSN | Dyn | MM | Oth | ||||||
| [173] | 2017 | Hm | Bio | Undir | SIVRS | EM | ||||||
| [174] | 2018 | SF-SW | Both | Ep | Int | Dyn | ML | SIS | EM | |||
| [175] | 2018 | Het | Rum | Wgt | Int | Dyn | Both | L | Both | Many | Many | |
| [176] | 2018 | Het | Ep | Int | ML | SIR | EM | |||||
| [177] | 2018 | R-D-SW-SF | Het | R-D | Wgt | Oth | ||||||
| [178] | 2018 | SF-SW | Hm | SN | Int | ML | Undir | DSIR-C-DSIR | EM | |||
| [179] | 2018 | Het | Ep | Wgt | Int | Dyn | SL | SIR-SIS | EM | |||
| [180] | 2018 | IoT | GRA-AHP | Oth | ||||||||
| [181] | 2018 | Het | Bio | Wgt | Dyn | ML | Dir | rSIS | EM | |||
| [182] | 2018 | Tree | Het | WSN | Dyn | GIN | Oth | |||||
| [183] | 2018 | Het | Ep | Both | Dyn | Undir | SIR-SIS | EM | ||||
| [184] | 2018 | WSN | SEIRV | EM | ||||||||
| [185] | 2018 | SN | Wgt | SL | Dir | DLATrust | Oth | |||||
| [186] | 2018 | Het | SN | I2S2R | EM | |||||||
| [187] | 2018 | Het | Bio | ML | Dir | SI1SI2S | EM | |||||
| [188] | 2018 | RW | SN | Wgt | LP-LPA | Oth | ||||||
| [189] | 2019 | SW-SF | SN | Wgt | Dyn | Dir | Oth | |||||
| [190] | 2019 | Ep | Unwgt | Int | ML | Undir | SIR | EM | ||||
| [191] | 2019 | WSN | APSA | Oth |
Survey of network topologies, algorithm categories, and related features (Part 3); full names corresponding to abbreviations available in Table 8 and Table 9.
| n | Year | Top | Het | App | Wgt | Dep | Dyn | Lay | L | Dir | Algo | Cat |
|---|---|---|---|---|---|---|---|---|---|---|---|---|
| [192] | 2019 | Large | Int | LPANNI | Oth | |||||||
| [193] | 2019 | FC | SN | S | ||||||||
| [194] | 2019 | Hm | SN | AB | EM | |||||||
| [195] | 2019 | SW-SF | Het | SN | Dyn | Undir | ILSR | EM | ||||
| [196] | 2019 | SN | Int | Oth | ||||||||
| [197] | 2020 | SF-SW-RT | Hm | SC | Int | Dyn | Undir | Oth | ||||
| [198] | 2020 | SN | Dyn | Dir | Oth | |||||||
| [199] | 2020 | SN | MOEA/D-ADACO | Oth | ||||||||
| [200] | 2020 | SN | SAIR | EM | ||||||||
| [201] | 2020 | Ep | Dyn | ML | Dir | Co-Evo Model | EM | |||||
| [202] | 2020 | WSN | Dyn | Attack Game | Oth | |||||||
| [203] | 2020 | Het | SN | Ind | Dir | ICM-LTM | CM-TM | |||||
| [204] | 2020 | Dif | Wgt | Dyn | Undir | DLMS | Oth | |||||
| [205] | 2021 | RT-SF | Het | Ep | Dyn | ML | L | Undir | S-SIS | EM | ||
| [206] | 2021 | SF | Het | SN | CSRT-SIR-SEIR | EM | ||||||
| [207] | 2021 | Het | SN | Dyn | Dir | P2V | Oth | |||||
| [208] | 2021 | Rum | SIS | EM | ||||||||
| [209] | 2021 | SN | Wgt | Dir | Oth | |||||||
| [210] | 2021 | Het | SN | Wgt | Int | ML | Dir | MF-Model | Oth | |||
| [211] | 2021 | Unwgt | L | Undir | I M | Oth | ||||||
| [212] | 2022 | SN | Wgt | Dir | Oth | |||||||
| [213] | 2022 | Het | RP | Wgt | Int | Dyn | ML | Dir | Oth | |||
| [214] | 2022 | WSN | Oth | |||||||||
| [215] | 2022 | RT | BC | ER | Oth | |||||||
| [216] | 2022 | SW-SF-2D Mesh | SN | Sznajd-SIR-SICR | EM | |||||||
| [217] | 2022 | SN | Wgt | Dyn | Dir | Oth | ||||||
| [218] | 2022 | WSN | Many | Many | ||||||||
| [219] | 2022 | RT | Het | SN | Wgt | Dyn | SL | Undir | SAR | EM | ||
| [220] | 2022 | RT | Het | Ep | Int | Dyn | Both | SIR | EM | |||
| [221] | 2023 | SN | Dir | Oth | ||||||||
| [222] | 2023 | SN | Wgt | Int | Dyn | SL | ICM-LTM | CM-TM | ||||
| [223] | 2023 | Het | Ep | Int | Dyn | ML | Undir | SIS-SIR | EM | |||
| [224] | 2023 | Hm | Gbl | Wgt | Int | Both | ML | Dir | Oth | |||
| [225] | 2023 | Het | Ep | Int | Dyn | ML | Undir | UAU-SIS | EM | |||
| [226] | 2023 | SF-SW | Het | Ep | Int | Dyn | ML | Undir | UAU | EM | ||
| [97] | 2024 | Mesh | Het | WSN | Dyn | ML | ||||||
| [98] | 2024 | Mesh | Het | WSN | Int | Dyn | ML | |||||
| [102] | 2024 | Mesh | Het | WSN | Wgt | Int | Dyn | ML | Undir | |||
| [1] | 2024 | Tree | Het | WSN | Wgt | Int | Dyn | SL | Dir | |||
| [105] | 2024 | Tree | Hm | WSN | Wgt | Int | Dyn | SL | NL | Dir |
Table 8.
Abbreviation mapping table (part 1).
Table 8.
Abbreviation mapping table (part 1).
| Category | Abbreviation | Full Name | Category | Abbreviation | Full Name |
|---|---|---|---|---|---|
| Top | RT | Random Topology | Algo | MHBC | Multi-Hop Broadcast |
| Top | RW | Random Walk | Algo | SIR | Susceptible-Infected-Recovered |
| Top | SF | Scale-Free | Algo | SIS | Susceptible-Infected-Susceptible |
| Top | SW | Small World | Algo | LTM | Linear Threshold Model |
| Top | Lat | Lattice | Algo | SIHR | Susceptible-Infected-Hospitalized-Recovered |
| Top | Mesh | Mesh Network | Algo | LR | Logistic Regression |
| Top | Not Applicable | Algo | LRT | Likelihood Ratio Test | |
| Het | Hm | Homogeneous | Algo | SI1I2S | Susceptible-Infected 1-Infected 2-Susceptible |
| Het | Inhm | Inhomogeneous | Algo | UAU | Urban Area Understanding |
| Het | Het | Heterogeneous | Algo | MTG | Maximum Traffic Generation |
| Het | Both | Both Homogeneous and Heterogeneous | Algo | SEIR | Susceptible-Exposed-Infected-Recovered |
| Het | Not Applicable | Algo | SIRaRu | SIR with Rumor Spreading | |
| App | SN | Social Networks | Algo | LMS | Least Mean Squares |
| App | BTC | Bitcoin Network | Algo | ICM | Independent Cascade Model |
| App | PHE | Public Health Emergency | Algo | LACS | Local Adaptive Clustering Service |
| App | Gbl | Global | Algo | COE | Co-Evolution Model |
| App | Virus | Virus Spread | Algo | HCM | Hierarchical Clustering Model |
| App | Health | Health-Related Applications | Algo | TTV | Time-Travel Visualization |
| App | Rum | Rumor Spreading | Algo | WSIS | Weighted SIS |
| App | Ep | Epidemic | Algo | MDDM | Multi-Domain Decision Making |
| App | Bio | Biological Network | Algo | AB | Agent-Based Model |
| App | WSN | Wireless Sensor Network | Algo | GIN | Graph Isomorphism Network |
| App | IoT | Internet of Things | Algo | rSIS | Revised SIS |
| App | SC | Supply Chain | Algo | 2SI2R | Two-Susceptible-Infected-Recovered Model |
| App | Ranking | Network Ranking | Algo | DLATrust | Deep Learning Algorithm for Trust |
| App | Petro Eng | Petroleum Engineering | Algo | P2V | Propagation2Vec |
| App | Dif | Diffusion | Algo | MF-Model | Mean Field Model |
| Wgt | Wgt | Weighted | Algo | SAR | State Augmented Regularization |
| Wgt | Unwgt | Unweighted | Algo | Sznajd | Sznajd Model |
| Dep | Int | Interdependent | Algo | DLMS | Deep Learning Model for SIR |
| Dep | Ind | Independent | Algo | Co-Evo Model | Co-Evolution Model |
| Dep | Not Applicable | Algo | UAU | Urban Area Understanding | |
| Dyn | Dyn | Dynamic | Algo | Many | Multiple Algorithms |
| Dyn | S | Static | Algo | Not Applicable | |
| Dyn | Both | Both Dynamic and Static | Cat | CM | Cascade Model |
By analyzing these tables, researchers can determine which diffusion models are most effective for different IoT and Space IoT applications. For instance, epidemic models (such as SIR and SIS) dominate large-scale networks due to their rapid spread, while threshold models (LTM) are widely used in structured and community-based IoT environments such as smart cities.
Table 9.
Abbreviation mapping table (part 2).
Table 9.
Abbreviation mapping table (part 2).
| Category | Abbreviation | Full Name | Category | Abbreviation | Full Name |
|---|---|---|---|---|---|
| Dyn | Not Applicable | Cat | EM | Epidemic Model | |
| Lay | SL | Single-Layer | Cat | TM | Threshold Model |
| Lay | ML | Multi-Layer | Cat | Oth | Other |
| Lay | Both | Both Single- and Multi-Layer | Cat | Many | Multiple Categories |
| Lay | Not Applicable | ||||
| L | L | Loopy | |||
| Dir | Dir | Directed | |||
| Dir | Undir | Undirected | |||
| Dir | Both | Both Directed and Undirected |
4.2.2. Epidemic Models
Strengths:
Flexibility: These models can adapt to various network topologies like scale-free and small-world networks, which are common in IoT configurations.
Scalability: Epidemic models are effective in large-scale IoT environments, making them ideal for scenarios with many interconnected devices.
Weaknesses:
Simplification: These models often assume uniform infection and recovery rates, which may not accurately reflect the diversity of device states in the IoT.
Homogeneity: The assumption of homogeneous networks may not adequately capture the complexity and dynamic behavior of real-world IoT environments.
Performance Metrics:
Propagation Delay: Epidemic models generally introduce delays as they spread information across larger networks, especially if the network topology is complex.
Resource Utilization: Epidemic models tend to use more resources (e.g., CPU, memory, etc.) as nodes continuously reinfect each other, which can lead to higher energy consumption in resource-constrained IoT devices.
Example: The SIHR model demonstrated that in scale-free IoT networks, information spreads rapidly but can be difficult to control due to the absence of a clear spreading threshold.
4.2.3. Cascading Models
Cascading models, like the Independent Cascade (IC) model, describe the spread of information in a step-by-step process where activated nodes attempt to influence their neighbors. This method is particularly relevant to IoT networks that require hierarchical or multi-hop communication between devices.
Strengths:
Detailed Propagation: The IC model captures the sequential nature of diffusion and can track the influence of individual nodes, like routers or gateways.
Real-world Applicability: These models can represent the critical role of certain devices, such as smart hubs or gateways, that control the spread of data in IoT systems.
Weaknesses:
Computational Complexity: In large IoT configurations, the IC model becomes computationally intensive, particularly as the network scales.
Fixed Activation Probability: The assumption of a constant activation probability can oversimplify dynamic IoT networks, where conditions vary in real time.
Performance Metrics:
Network Load: Cascading models tend to generate moderate traffic by selectively activating nodes, which helps reduce network load.
Reachability: Cascading models often cover less ground compared to epidemic models but can efficiently propagate data in smaller IoT systems.
Example: The IC model has been successfully applied in data diffusion studies where central nodes (e.g., routers) play a critical role. However, the fixed activation probabilities limit its performance in dynamic IoT environments.
4.2.4. Threshold Models
Threshold models, such as the Linear Threshold Model (LTM), operate on the principle that a node becomes active when the influence from its neighbors exceeds a pre-set threshold. These models are suitable for IoT configurations that require coordinated behavior from clusters of devices, such as in smart homes or industrial IoT applications.
Strengths:
Community Dynamics: The LTM is effective at modeling diffusion in clustered networks, where devices in a particular area act together.
Efficient Activation: Once a small number of key nodes are activated, the diffusion process spreads quickly across the network.
Weaknesses:
Binary Activation: The model simplifies device states by assuming nodes are either active or inactive, which may not capture the varying states of IoT devices.
Constant Thresholds: The assumption that thresholds remain fixed over time does not account for the dynamic nature of IoT environments.
Performance Metrics:
Diffusion Reachability: The LTM can be limited in its reachability if the initial active nodes are not sufficient to trigger widespread activation.
Robustness: The LTM performs well in networks with resilient community structures but may struggle in highly dynamic environments.
Example: In IoT networks, the LTM has been used to simulate the spread of firmware updates across device clusters, showing quick diffusion once critical nodes receive updates. However, its binary nature limits flexibility in dynamic networks.
4.2.5. Other Models
In addition to epidemic, cascading, and threshold models, there are other approaches to studying network diffusion in IoT configurations, but they are less commonly applied in IoT contexts.
4.2.6. Conclusions
In IoT and Space IoT configurations, the choice of diffusion algorithm—whether it be epidemic, cascading, or threshold—impacts the performance of the network in different ways. Each model has its strengths and weaknesses depending on the network topology, size, and dynamicity. Evaluating these algorithms against key performance metrics such as propagation delay, network load, diffusion reachability, resource utilization, and robustness allows researchers to select the most suitable model for their specific IoT environment.
Epidemic models offer high reachability but at the cost of increased resource utilization. Cascading models provide more efficient propagation but face challenges in computational complexity. Threshold models are ideal for coordinated diffusion in clustered networks but may be limited by their binary activation approach.
By understanding the characteristics and performance of these algorithms, researchers can optimize network diffusion for specific IoT applications, ensuring efficient and scalable diffusion processes in diverse network configurations.
4.3. Analysis of Research Question 4: Network Architecture
4.3.1. Introduction
Network architecture plays a crucial role in shaping the performance of network diffusion algorithms, particularly in IoT and Space IoT configurations. Key factors such as the network’s structure, topology, device heterogeneity, and the dynamic nature of these environments heavily influence how information spreads throughout the network. This section explores the effects of various network topologies, heterogeneity, dynamicity, and layered network structures on the diffusion processes.
4.3.2. Network Topologies and Their Impact on Diffusion
Understanding these interactions helps in designing efficient diffusion strategies tailored to IoT and Space IoT environments, where network dynamics and communication constraints must be considered.
4.3.3. Network Heterogeneity
Heterogeneity refers to the diversity in devices’ capabilities, such as differences in processing power, storage, and communication range, which directly impacts network diffusion algorithms.
Strengths:
Weaknesses:
4.3.4. Dynamicity of Networks
Dynamicity refers to the changes in node connectivity over time, which is common in mobile IoT devices or networks where nodes frequently join, leave, or change status.
Static Networks: Topologies remain unchanged, making it simpler to implement diffusion algorithms, though they do not accurately represent most real-world IoT networks.
Dynamic Networks: Devices frequently change positions or status. Diffusion algorithms must be flexible and adaptive to handle these changes, which increases complexity but improves realism.
Example: In dynamic sensor networks, where nodes are mobile, algorithms need to adapt to topology updates, improving efficiency but complicating the diffusion process if changes occur too frequently.
4.3.5. Layered and Multi-Layered Networks
Layered networks represent different communication levels (e.g., physical and application layers), while multi-layered networks capture interactions between different layers, allowing for more complex modeling of IoT systems.
Single Layer
Diffusion occurs within a single type of connection (e.g., device-to-device communication), which simplifies modeling but may not fully represent real-world IoT networks.
Multi-Layer Networks
Consider interactions between multiple types of connections (e.g., physical and virtual communications). These networks offer more realistic simulations but require more complex algorithms and higher computational resources.
4.3.6. Other Network Characteristics
Weighted Networks
Edges between nodes have weights representing the strength or capacity of connections, making them relevant in the IoT where certain connections (e.g., high-bandwidth links) are more reliable.
Directed Networks
Communication is unidirectional, which is common in IoT systems where sensors collect data and transmit them to a central server.
5. Conclusions
This paper presents a comprehensive review of network diffusion algorithms and simulators, with a focus on their application in IoT and Space IoT systems. The study explored the performance of widely used diffusion models, including epidemic, cascading, and threshold-based algorithms, which are central to the dissemination of information, data, and even malware within these networks. Understanding their strengths and limitations is critical for designing robust, scalable, and secure communication frameworks, particularly in the demanding context of Space IoT.
Additionally, a range of network simulators, such as NS-3, Cooja, and OMNeT++, is employed to simulate and evaluate the behavior of diffusion algorithms in IoT networks. These simulators are instrumental in helping researchers understand and address the complexities of IoT networks, particularly with regard to large-scale deployments, device heterogeneity, and dynamic network topologies. This review focused on identifying key metrics for evaluating diffusion algorithms and simulators, including scalability, energy consumption, latency, and packet delivery ratio, which are essential for maintaining efficient and reliable communication across diverse IoT systems.
The findings highlight that while existing diffusion models and simulators have demonstrated effectiveness in traditional IoT scenarios, the unique characteristics of Space IoT demand more adaptable and resource-efficient solutions. Space IoT systems, with their complex topologies, constrained resources, and real-time communication needs, present distinct challenges. Future research should prioritize the development of advanced diffusion algorithms and simulation tools tailored to address these challenges, paving the way for more resilient and efficient Space IoT networks.
While this paper primarily addressed diffusion algorithms and simulators in IoT systems, future research should expand to their applications in emerging domains such as Space IoT and modular robots. Space IoT systems, comprising satellites, drones, and other extraterrestrial IoT devices, present unique challenges due to extreme topologies, constrained resources, and high latency. Similarly, modular robots, which can autonomously reconfigure for diverse tasks, introduce a dynamic and adaptive network environment that requires efficient and robust communication protocols.
Future work should include a comprehensive benchmarking study of diffusion algorithms tailored for both modular robots and drones. These systems require efficient communication protocols to ensure coordinated operations, real-time decision making, and seamless interaction in unpredictable environments. Testing these algorithms using the network simulators discussed in this paper like Ns-3 will provide valuable insights into modeling the communication behaviors of both modular robots and drones.
In addition to benchmarking, a key area of interest is the ability of these systems to adapt based on changes in the environment or potential security threats, such as hacks. In highly dynamic settings, where the topology or external conditions shift frequently, modular robots and drones must be capable of adjusting their communication and coordination strategies to maintain optimal performance. Research into how diffusion algorithms can evolve in real-time to handle these challenges will be crucial to ensuring the robustness of future IoT applications.
Collaboration between Space IoT and terrestrial IoT systems, including modular robots, offers another promising research direction. For instance, studying the interaction between satellites, drones, and modular robotic units in integrated networks could provide insights into scalability, interoperability, and resilience. Comparative analysis of diffusion algorithm performance across these domains will help identify common challenges and specialized solutions.
By pursuing these directions, future research can contribute to significant advancements in areas such as satellite-based communication, interplanetary exploration, disaster management, and autonomous industrial operations. This work will not only enhance the understanding of diffusion algorithms but also pave the way for innovative solutions in the rapidly evolving IoT landscape.
Source link
Charbel Mattar www.mdpi.com