3.1. Differentially Expressed Pathways in NOB Treatment Compared with the Control
First, we performed a heatmap plot analysis of DEGs between the control and NOB-treated groups (
Figure S1). Differences between the two groups were observed using a heatmap plot analysis.
The gene profiles of BEECs in the control and NOB groups were analyzed, and 138 upregulated genes and 83 downregulated genes differentially expressed functionally known genes were identified for the control and NOB groups, respectively (log2 fold-change ≥ 1.0 as upregulated genes or ≤−1.0 as downregulated genes,
p < 0.05). We present the upregulated and downregulated functionally known genes in the NOB-treated group compared to the control group in
Tables S1 and S2.
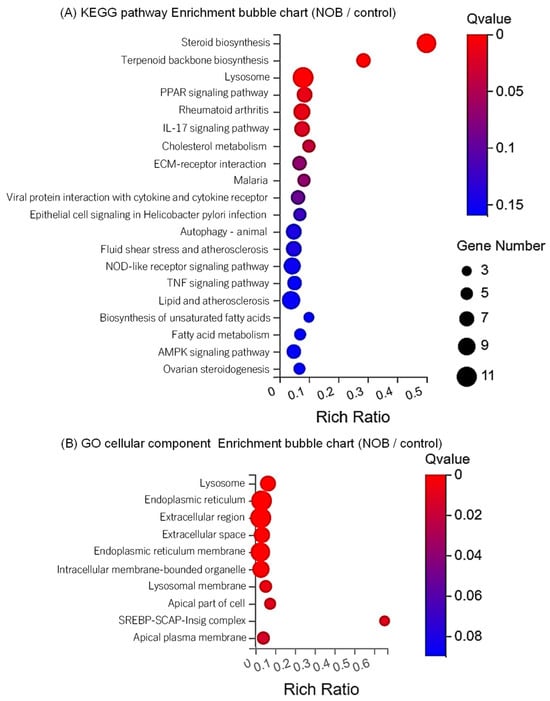
KEGG enrichment analysis was performed to appraise the pathways in BEECs that were differentially regulated between the control and NOB-treated groups. As shown in
Figure 1A, 20 pathways showed significant variations (
p < 0.05). In addition, we show the top five pathways and their related genes that differed in BEECs treated with NOB compared to the control in
Tables S3–S7.
Steroid biosynthesis (
Table S3) was the most affected pathway, which included 10 upregulated genes (squalene epoxidase [
SQLE], lanosterol synthase [
LSS], farnesyl-diphosphate farnesyltransferase 1 [
FDFT1], transmembrane 7 superfamily member 2 [
TM7SF2], methylsterol monooxygenase 1 [
MSMO1], cytochrome P450 family 51 subfamily A member 1 [
CYP51A1], NAD(P)-dependent steroid dehydrogenase-like [
NSDHL], 7-dehydrocholesterol reductase [
DHCR7], 24-dehydrocholesterol reductase [
DHCR24], and sterol-C5-desaturase [
SC5D]). We confirmed the upregulation of
SQLE mRNA expression in BEECs following NOB treatment using qPCR (
Figure S2A).
Terpenoid backbone biosynthesis (
Table S4) was the second most affected pathway, which included six upregulated genes (3-hydroxy-3-methylglutaryl-CoA synthase 1 [
HMGCS1], isopentenyl-diphosphate delta isomerase 1 [
IDI1], farnesyl diphosphate synthase [
FDPS], 3-hydroxy-3-methylglutaryl-CoA reductase [
HMGCR], mevalonate diphosphate decarboxylase [
MVD], and phosphomevalonate kinase [
PMVK]).
Lysosome (
Table S5) was the third-ranked pathway, which included 11 upregulated genes (ATPase H+ transporting V0 subunit A4 [
ATP6V0A4], cathepsin K [
CTSK], cathepsin B [
CTSB], N-sulfoglucosamine sulfohydrolase [
SGSH], neuraminidase 1 [
NEU1], cathepsin L [
CTSL], mucolipin TRP cation channel 1 [
MCOLN1], cystinosin [
CTNS], cathepsin V [
CTSV], tripeptidyl peptidase 1 [
TPP1], and alpha-N-acetylgalactosaminidase [
NAGA]). We confirmed the upregulation of
CTSB mRNA expression following NOB treatment in BEECs using qPCR (
Figure S2B).
The peroxisome proliferator-activated receptor (PPAR) signaling pathway (
Table S6) was the fourth-ranked pathway, which included six upregulated genes (stearoyl-CoA desaturase [
SCD],
HMGCS1, fatty acid desaturase 2 [
FADS2], fatty acid-binding protein 4 [
FABP4], acyl-CoA synthetase long-chain family member 6 [
ACSL6], and [
FABP3]).
Rheumatoid arthritis (
Table S7) was the fifth-ranked pathway, which included four upregulated genes (
ATP6V0A4,
CTSK,
CTSL, and
CTSV) and four downregulated genes (C-X-C motif chemokine 1 [
CXCL1],
CXCL3,
CXCL5, and
CXCL8 [
IL-8]). We confirmed the downregulation of
IL-8 mRNA expression following NOB treatment in BEECs using qPCR (
Figure S2C).
GO cellular component enrichment analysis was performed to identify the pathways in BEECs that were differentially regulated between the control and NOB-treated groups. As shown in
Figure 1B, the top 10 pathways showed significant variations (15 pathways were significant, Q value < 0.05 and
p value < 0.005). Additionally, we show the most affected pathway and their related genes that changed in NOB-treated BEECs compared to the control in
Table S8.
Lysosome was the top-ranked pathway, which included 18 upregulated genes (Ras-related GTP binding D [RRAGD], CTSK, low-density lipoprotein receptor [LDLR], sequestosome 1 [SQSTM1], CTSB, folliculin interacting protein 2 [FNIP2], SGSH, NEU1, CTSL, MCOLN1, CTNS, CTSV, tubulointerstitial nephritis antigen like 1 [TINAGL1], Ras-related GTP binding C [RRAGC], TPP1, chloride voltage-gated channel 7 [CLCN7], NAGA, and glycosylated lysosomal membrane protein [GLMP]) and 2 downregulated genes (lysosomal associated membrane protein family member 5 [LAMP5] and cubilin [CUBN]).
These data suggest that there are differences in the gene expression and regulation of pathways in BEECs treated with NOB compared to those in the control.
3.4. Effects of NOB on Lysosomal Function in BEECs
Bacteria invade the epithelial cells and proliferate, causing the infection to spread. As a defense mechanism against such bacteria, the uptake of foreign material
via the endocytosis–lysosomal pathway and its subsequent elimination within the cell is important [
29]. Because NOB may increase the endocytosis–lysosome system, we investigated whether NOB regulates lysosomal function in BEECs. Therefore, we performed phagocytosis assays using fluorescence-conjugated LPS (a major component of bacteria) and observed the lysosomes in BEECs after NOB treatment. After treatment with fluorescence-conjugated LPS, a green fluorescent area was observed in BEECs, indicating the phagocytosis of LPS in BEECs (
Figure 4A, left panel). Additionally, red fluorescence (lysosomes) and yellow fluorescence areas (co-localization of green and red colors) were observed, indicating that some phagocytosed LPS were co-localized with lysosomes. In the NOB-treated groups with fluorescence-conjugated LPS, almost all phagocytosed LPS were co-localized with lysosomes (
Figure 4A, right panel). We confirmed an increased number of co-localization areas of fluorescence-conjugated LPS and lysosomes (
Figure 4B, left), and their size was significantly higher in BEECs treated with NOB (
Figure 4B, right). These findings suggest that NOB activates phagocytosis of the bacterial component LPS and that NOB-induced lysosomes may take up this LPS in BEECs.

