1. Introduction
Despite the existence of some sustainable solutions focused on developing products with low greenhouse gas (GHG) emissions [
1,
2], there is still much to be done across various sectors.
In an increasingly urbanized society, wastewater treatment systems play a fundamental role in protecting the environment and preserving public health. However, Wastewater Treatment Plants (WWTPs) are considered intensive consumers of electrical energy. According to the International Energy Agency (IEA) [
3], wastewater treatment consumed approximately 4% of global electricity in 2014, equivalent to 952.54 TWh. It is estimated that by 2040, due to population growth in major urban centers and the consequent expansion of treatment infrastructure, energy consumption will increase by 60% [
4]. Nevertheless, despite the expected growth, a potential reduction in electricity consumption of approximately 15% is projected by 2040 [
5].
Based on these projections, policymakers, water service managers, and researchers recognize the importance of studying the energy efficiency of these treatment systems to reverse the trend of increasing energy intensity, reduce operational costs, and ensure resource sustainability [
6,
7,
8].
For the year 2030, the European Union (EU), through the new Energy Efficiency Directive (EU) 2023/1791 [
9], a revision of Directive 2012/27/EU [
10], set more ambitious targets for the entire European zone compared to the projections made in 2020. This new directive requires EU Member States to establish indicative national energy efficiency targets, aiming for a final energy consumption of 763 Mtoe for the EU. According to the Governance Regulation (EU) 2018/1999 [
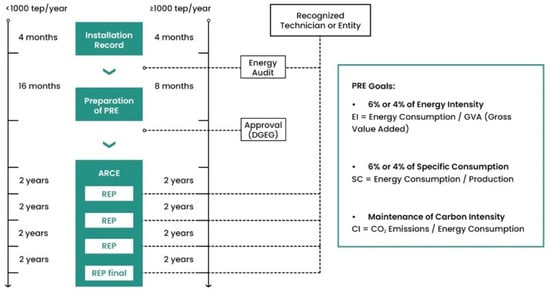
11], Eurozone countries must develop National Energy and Climate Plans (NECPs) for the period 2021–2030 and submit interim reports every two years. In Portugal, an EU Member State, Decree-Law No. 71/2008 [
12] was published as a part of the National Energy Strategy, which regulates the Intensive Energy Consumption Management System (SGCIE) [
13]. This decree was later amended by Law No. 7/2013 [
14] and Decree-Law No. 68-A/2015 [
15]. The SGCIE [
13], the ISO 50001:2018 standard [
16], and the Plan-Do-Check-Act (PDCA) methodology play an important role in improving an organization’s energy performance. The SGCIE [
13], regulated by Decree-Law No. 71/2008 [
14], requires that the managing entities of industrial units with intensive energy consumption develop Energy Rationalization Plans (PREs) and submit Execution and Progress Plans (REPs) to regulatory authorities. The ISO 50001:2018 [
16] provides a structured framework for implementing an Energy Management System (EnMS), enabling managers to meet legal requirements and improve energy consumption in production units using the systematic PDCA methodology.
According to the literature [
5,
8,
17,
18,
19,
20,
21,
22], there are several gaps that warrant study and reflection. However, the scarcity of quantitative studies on the impact of the PDCA methodology, according to ISO 50001:2018 [
16], in wastewater treatment systems hinders the understanding of the challenges related to data access, the limited number of Key Performance Indicators (KPIs), and the origins and consequences of energy inefficiency phenomena. Therefore, there is a need to assess the impact of energy audits based on this standard and methodology, thereby contributing to new insights on the topic in this sector.
Thus, this study aims to assess the impact of an energy audit in a WWTP located in northern Portugal, according to ISO 50001:2018 [
16] and the PDCA methodology, to identify and quantify both persistent and transient energy inefficiencies. Throughout this assessment, the same PDCA methodology was followed, maintaining a structured and systematic approach aligned with the audit team, ensuring scientific validity and compliance with technical and legal requirements.
This research was based on the hypothesis that a structured and systematic approach, when properly implemented, should enable the identification and quantification of both persistent and transient energy inefficiencies. From a scientific perspective, this analysis aims to provide a rigorous quantitative assessment of an energy audit conducted at a WWTP in northern Portugal, within the context of legal obligations. Additionally, this paper sought to contribute to the decision-making processes of managers and policymakers.
In
Section 2, the legal framework and the PDCA methodology used is presented. The description of the WWTP is covered in
Section 3.
Section 4 presents the data collection process. The discussion of the audit results are presented in
Section 5.
Section 6 outlines the measures to be implemented, and finally, the conclusions and future work are presented in
Section 7.
3. Wastewater Treatment Plant Description
The management of this wastewater treatment system, located in northern Portugal, which includes the audited WWTP, has been the responsibility of a concessionaire entity since 1998. Under a concession contract with five Portuguese municipalities the facility serves a population of 388,273 domestic inhabitants.
Initially, the original WWTP, designated as Phase I, was equipped with a tertiary treatment system. It had the capacity to serve a Population Equivalent (PE) of 100,800 inhabitants with an average flow rate of 15,120 m3/day and a Biochemical Oxygen Demand over 5 days (BOD5) of 5009 kg/day. Later, its treatment capacity was increased by the construction of a new line, referred to as Phase II, located northwest of the original. Phase II, covering approximately 5 hectares, is also capable of tertiary treatment. The new line has the capacity to treat the influent from a total population of approximately 170,513 PE, with an average flow rate of 25,577 m3/day and a BOD5 load of 10,017 kg/day. Currently, the two lines occupy a total area of 7 hectares. By 2033, the managing entity expects to serve an equivalent population of 361,096 inhabitants.
According to
Figure 3, the raw influent to be treated in the WWTP is directed by gravity to the input chamber. The total elevation of the influent is achieved using Archimedes screws, which operate at variable speeds in two stages. After elevation, the influent is conveyed through channels equipped with manually cleaned screens with 40 mm thickness and a rotary drum screen with a mesh of 5 mm. The grease and grit removal unit consists of two lines of bottom diffusers for air injection, facilitating the flotation of grease and the washing of grit. It is equipped with movable bridges and surface scrapers for grease removal as well as bottom scrapers for grit removal. In the same unit, the dewatering of the removed residues is carried out in the grit classifier and grease concentrator. After the previous stages, the flows are directed by gravity to Phase I and Phase II. At this stage, the flow rate sent to each line is measured using an electromagnetic flowmeter.
3.1. Phase I
3.1.1. Description of the Liquid Phase Treatment
As illustrated in
Figure 3, the effluent is directed to two homogenization basins. These units are designed to equalize hydraulic loads and pollutants as well as to buffer peak flows. This is achieved using aerators and submersible agitators. The flow is then directed by gravity to the intermediate lift station, where five submersible pump groups are employed to ensure a constant flow rate during the subsequent treatment stages. CO
2 is added for pH correction. In the neutralization basin, equipped with an electrical agitator, the pH is monitored, and a coagulant is added to remove the color.
After leaving the neutralization basin, the flow is distributed among four aeration basins, each equipped with six turbines to ensure proper oxygen injection. In these units, an aerobic biological treatment of the influent is performed. For each treatment line, there is a cylindrical–conical vertical flow clarifier, equipped with a scraper bridge, where secondary sedimentation occurs and separation between the treated effluent and biomass is carried out.
The biomass is then returned to the corresponding aeration basin via the recirculation system. For the physicochemical treatment, there are two coagulation/flocculation units, consisting of one rapid mixing chamber, two slow mixing chambers, a flotation unit, and a device for scraping the floated surface sludge. The effluent filtering is performed by gravity through three sand filters. Finally, the effluent is discharged into the receiving medium, the river.
3.1.2. Description of the Solid Phase Treatment
In the solid phase treatment, shown in
Figure 3, the secondary sludge is directed to the flotation/thickening unit for thickening and then transferred to the mixed sludge basin. In this unit, sludges from different sources (secondary and chemical sludge) are mixed with the aid of an electrical agitator. The sludge is then directed to the dewatering stage of Phase II.
3.2. Phase II
3.2.1. Description of the Liquid Phase Treatment
As shown in
Figure 3, the neutralization basin is equipped with two electrical agitators that ensure the stirring and mixing of the influent with the chemical sludges generated in the tertiary treatment. At the bottom of the basin, automatic injections of CO
2 are performed through diffuser grids to adjust the pH. Subsequently, the influent is directed to biological treatment, and it may occasionally be diverted to the emergency basin. At the outlet of the neutralization basin, a distribution chamber splits the flow between two biological reactors, which then convey the influent to the contact basins. In these basins, a fraction of the recirculated sludge is mixed with the influent. This unit facilitates biological treatment under aerobic and anoxic conditions. Each ditch is equipped with a compressed air injection system that uses fine bubble diffusers, which ensure the necessary introduction of oxygen, as well as frequency inverters. Aeration in only two areas of the ditches creates aerated and anoxic zones, promoting the respective biological processes. The unit also includes four submersible agitators in the non-aerated areas which keep the biomass in suspension, improve contact with the pollutant load, and ensure effluent flow. A coagulant is added for the removal of the color. Each treatment line features two cylindrical conical vertical flow clarifiers, equipped with bottom and surface scraper bridges, a scum collection box, and a deflector upstream of the discharge line. In these treatment units, the treated effluent and biomass are separated, and the biomass is subsequently recirculated to the respective biological reactor. The scum is directed to the drainage line and returned to the inlet box. The physicochemical treatment consists of two coagulation/flocculation units, each comprising one rapid mixing chamber and two slow mixing chambers, followed by lamellar settling. After lamellar settling, the effluent passes through the reused treated water well and is gravity fed to the water line.
3.2.2. Description of the Solid Phase Treatment
As shown in
Figure 3, the secondary sludge is sent to the thickening tables, where a polyelectrolyte is injected into the liquid stream. At this stage, the water contained in the sludge is eliminated as much as possible by centrifuge dehydration, with the aid of the polyelectrolyte, and then sent for storage in silos. The chemical stabilization of the sludge is achieved by adding quicklime.
5. Audit Results and Discussion
This section presents the results and discussion of the opportunities and challenges identified within the scope of the WWTP’s energy audit, according to the PDCA methodology of ISO 50001:2018 [
16].
Section 5.1 addresses the quality of the electrical energy consumed.
Section 5.2 and
Section 5.3 present the evaluation of the initial pumping station and the intermediate pumping station integrated into Phase I.
Section 5.4 and
Section 5.5 present and discuss the results related to the biological treatment aeration systems in Phases I and II, respectively. The results for the evaluation of the sludge recirculation pumping station for Phase I, the excess sludge pumping station for Phase II, and the sludge recirculation pumping station for Phase II, are presented and discussed in
Section 5.6,
Section 5.7, and
Section 5.8, respectively. Finally, in
Section 5.9, a proposal for a study on the integration of alternative energies is presented.
5.1. Power Quality
The quality of the electrical power supply is essential for the proper operation of WWTPs. Issues such as voltage fluctuations, harmonic distortions, and, in extreme cases, supply interruptions can lead to equipment failures, increased energy consumption, high operational costs, and a compromise in the system’s production goals. Based on the audit records and using measurements taken on two distinct days, three weeks apart, a load curve was identified with an average power consumption of 1176 kW and a maximum of 1485 kW (
Figure 7) [
25].
The power factor was 0.974, with a current Total Harmonic Distortion Factor (THD
I) of 16% and a voltage Total Harmonic Distortion Factor (THD
V) of 3% [
25]. Based on the values presented, the installation showed an adequate compensation for the power factor as well as THD
V and THD
I rates within the normal limits. According to the audit team, no improvement opportunities were identified, though they recommended proper load management during peak hours.
The practice of energy auditing, regardless of its methodology, must consider the analysis and evaluation of electrical parameters such as voltage, current, power consumption, reactive power, power factor, and harmonics, among others, due to their impact on the stability and efficiency of the electrical installation and the preservation of energy-consuming equipment. Furthermore, an analysis of the results over extended reference periods (preferably from the last three years), based on a multidisciplinary perspective of the sector’s inherent expertise, is essential for correlating technical, operational, and economic data, enabling more accurate diagnostics and integrated energy performance solutions tailored to the specific reality of the installations.
5.2. Initial Pumping Station
The elevation of the influent to the WWTP is done through a pumping station, equipped with six Archimedes screws distributed in two lift stages in equal numbers. The rotation speed of the screws is managed by frequency converters, which are activated by level sensors in the input chamber. Given the monitoring carried out over a 24 h period, the auditors recommended monitoring the specific energy consumption of these lifting groups as a means of identifying mechanical anomalies that affect electrical energy consumption as well as other phenomena of inefficiency [
25].
5.3. Intermediate Pumping Station Phase I
After the preliminary treatment, the influent flows by gravity to the neutralization basin of Phase II and the rest is directed to the homogenization basin of Phase I. From there, it is pumped by the intermediate pumping station of Phase I to the neutralization basin of the same treatment line. During the reference period, this last stage consumed approximately 250 MWh, equivalent to 3.1% of the energy consumption of the facility [
25]. Therefore, considering the geometric elevation difference of approximately 3 m between the intermediate pumping station located between the homogenization basin and the neutralization basin of Phase I, the auditors suggested discharging the influent directly from the pretreatment stage to the neutralization basin of Phase I by implementing a gravity bypass around the homogenization stage and the pumping station under analysis. However, given the need to homogenize the influent, especially during peak periods or higher loads, it was considered feasible to use this bypass only for 50% of the influent flow [
25].
Based on the technical guide from the Regulatory Entity for Water and Waste Services (ERSAR), the auditors estimated the investment required for the implementation of the homogenization bypass along with the estimated reduction in energy costs. With an investment of 53,728.00 €, recoverable in four years, it would be possible to achieve a reduction in energy consumption of around 50%, with a decrease in associated costs of 13,310.00 € [
25].
5.4. Biological Treatment Phase I
According to the literature [
5,
27,
29], and also this case study, the aeration system represents the stage with the highest electricity consumption and therefore it expected that the implementation of energy efficiency measures would achieve a reduction in consumption between 15% and 38%. The biological treatment of Phase I is ensured by vertical-shaft surface aerators. Before the audit period, half of the aerators were replaced with higher-performance models due to their degraded condition and consequently low-efficiency levels (0.9 kgO
2/kWh).
As aerator 01 is in an area with a higher concentration of pollutant load, as shown in
Table 4, the amount of oxygen transferred to the liquid medium is greater, ensuring a more effective biological decomposition of organic matter by bacteria. In relation to aerator 02, located downstream of 01, the pollutant load is lower, which is why the dissolved oxygen values are higher. According to the auditors and based on the values calculated by the operator and referenced by the manufacturer, aerator 01 had an average performance within the expected range. Regarding aerator 02, the value was slightly above the value calculated in previous studies (
Figure 8).
Currently, using a management platform dedicated to this treatment stage, the aeration system maximizes its performance by preferentially using the most efficient aerators during lower electricity tariff periods and by controlling the pollutant load to be treated. However, despite the good results achieved, the auditors identified opportunities to improve the energy performance of this treatment stage [
25]. In the pollutant load removal process, through oxygen transfer, the control system does not consider the best efficiency point (BEP). Given the importance of the topic, the audit team conducted an analysis of the theoretical oxygen requirements and the optimization of the transfer point based on the pollutant load [
25].
The relationship between factors such as pollutant load, dissolved oxygen levels, hydraulic retention time (HRT), and the aeration capacity of the turbines is critical to ensure oxygen transfer at the most efficient moment. The best efficiency point has direct impacts on the operational and energy performance of the WWTP. Thus, the higher the pollutant load, the lower the amount of dissolved oxygen in the basins. This makes it essential to ensure proper oxygen transfer, a process intensified by the aeration turbines. The HRT influences the time available for the removal of organic matter during the biological process. However, if it is too high or too low, it can lead to oxygen saturation or limit the time required for proper degradation. The auditors estimated the maximum theoretical oxygen requirements for biological treatment based on the reference operational values, together with the aeration capacity of the surface aerators in three lines (assuming an average turbine efficiency of 2.2 and an oxygen consumption rate of 1 kgO
2/kWh) and the average monthly hydraulic retention time, with the possibility of stopping the fourth line (
Table 5 and
Table 6).
From the analysis of the results (
Table 5 and
Table 6) two important aspects should be highlighted. First, in aeration, the turbine capacity, corresponding to 12,123 kgO
2/day, exceeds the oxygen requirements, particularly in June when the consumption is highest [
25]. The second aspect concerns the relationship between the volume of the three basins and the flow rate, which contributes to defining more appropriate retention times.
Given the solution presented by the audit team [
25], we understand that it could be optimized by analyzing the levels of ammonia and nitrate in the biological reactor in addition to the levels of oxygen. This measure would enable a reduction in energy consumption without compromising the quality of the treated effluent [
34,
35].
According to the results presented and the opinion of the auditors [
25], it was expected that with the shutdown of one biological treatment line, the load and consequently the oxygen consumption of the biomass would increase in the remaining three lines, the average oxygen concentration in the aeration would decrease, and the oxygen transfer point would be optimized. However, according to the auditors [
25], with the adjustment of the oxygen set point, an estimated 7.5% reduction in energy consumption was achieved in this treatment stage. The proposed optimization measure, associated with bypassing the homogenization basin, can be facilitated by upgrading the servo-motorized gate at the aeration basin feed, with negligible implementation costs that can be amortized within the fiscal year. However, the optimization of the oxygen transfer set-point does not require any investment.
5.5. Biological Treatment Phase II
With the aim of assessing the energy efficiency of the aeration system in the Phase II line, the oxygen consumption of the biomass was calculated using the mixed liquid suspended solids (MLSS) metric, and the oxygen supply in the basins was monitored, as shown in
Figure 9.
As shown in
Table 7, the oxygen consumed was divided by the compressor energy consumption, resulting in an average efficiency of 1.69 and 0.65 kg O
2/kWh in basin 1 and basin 2, respectively.
In treatment systems with these characteristics, it is common to find efficiency values exceeding 2 kgO
2/kWh. However, as shown in
Table 7, the efficiency value in basin 2 was significantly lower than that of basin 1, which corresponded to approximately 25% of the aerated zone in general.
Following an on-site inspection, the audit team identified an air leak in the fine bubble diffusion system in basin 2 [
25]. A fine bubble diffusion system, when operating properly, allows for an increase in the total surface area of the bubbles, and consequently, an increase in contact time, which translates into a greater oxygen transfer. In other words, the reduction in the amount of air injected by the compressors and the optimization of the aerators’ operating times leads to a decrease in electricity consumption. According to the authors, the use of fine bubble diffusion systems can result in energy savings between 10% and 20% [
36].
The recovery of a fine bubble diffusion system is justifiable, considering that the investment of 32,759.00 € would promote a reduction in energy costs of 58,810.00 € (corresponding to a reduction of 551,678 kWh). The investment is justifiable and, according to the auditors, can be recovered in 0.56 years [
25].
Considering the importance of dissolved oxygen levels in aeration tanks, one study [
37] demonstrated how replacing air with pure oxygen could increase oxygen transfer rates, allowing for the treatment of higher loads without compromising the effluent quality. Although oxygen production has an associated energy cost, the increased efficiency resulting from pure oxygen transfer can reduce the electrical energy consumption of compressors, especially in well-designed systems. Due to the energy advantages of using a fine bubble aeration system, there is the potential to optimize this treatment process with this technology. Nanobubbles increase the contact area with the water, allowing for superior gas transfer. In addition to the advantage mentioned above, there is also the characteristic of neutral buoyancy, which allows them to remain submerged and increase the contact time with water [
38,
39].
5.6. Sludge Recirculation Pumping Station Phase I
Given the energy consumption of the sludge recirculation pumping systems and their advanced state of degradation, the audit team measured the flow rate, power consumption, efficiency, and specific consumption of the pumps, and they compared the results with the technical specifications of more efficient equipment [
25].
From the analysis of the audit results, it was concluded that there were significant differences with respect to four parameters. By replacing equipment, it would be possible to increase the efficiency of the machine by 130 to 135% through an increase in the flow rate (by 6% to 36%) while reducing the power consumption (by 53% to 65%) and, consequently, the specific energy consumption by approximately 130% to 135%. Therefore, the auditors proposed an investment of 10,237.00 € for the acquisition of new equipment. This proposal was based on an annual reduction in electricity costs of 4475.00 €, which, according to this study, would allow the investment to be recouped in approximately two and a half years [
25].
5.7. Excess Sludge Pumping Station Phase II
After identifying the technical characteristics of the sludge extraction pumping unit, the flow rate, the power, and the specific consumption values of the electric energy were monitored, and the efficiency of each associated pump was evaluated.
During this treatment phase, opportunities for improvement through the acquisition of new equipment were also identified. With a reduction in average global power of approximately 70%, a reduction in specific energy consumption between 80% and 85%, and a projected increase in flow rate of 60%, the expected improvement in energy efficiency, compared to the measured values of existing equipment, was estimated to be between 400% and 550% [
25].
Given these findings and considering the wear of the machines, as well as the obstruction of the pipelines, the causes of pressure losses, and the excessive energy consumption identified, the team decided to propose replacing the equipment. The investment proposal, amounting to 10,205.00 €, was justified by a projected cost reduction of approximately 3308.00 € per year, allowing for a return on investment in approximately three years. In addition to the investment proposal, the audit team did not overlook the possibility of repairing damaged equipment or implementing an appropriate maintenance action plan [
25].
5.8. Sludge Recirculation Pumping Station Phase II
As was done with the Phase I sludge recirculation pumping station, specific flow rate, power, and consumption measurements were taken to assess the energy efficiency of the installed pumps, and a comparative performance analysis was performed with the proposed equipment. Based on the measurements taken, the auditors identified some efficiency loss, which may be associated with wear and losses between the impeller and the volute. However, considering the investment cost of 58,722.00 € and a payback period of over 8 years, which is above the recommended duration, as well as the low-cost reduction amount of 7137.00 €, the audit team recommended regular monitoring of the recirculation pumps by the operator. In the event of an anomaly, the operator could consider restoring the impeller and reducing the pump speed to minimize head losses and improve efficiency [
25].
5.9. Alternative Energies
The production of biogas, resulting from microbial activity under anaerobic conditions, typically represents an alternative energy source. However, in this case, the type of biological treatment of activated sludge with prolonged aeration produces sludge with a high level of digestion and consequently with a reduced biogas production potential, making it unsuitable for use. As an alternative energy source, the auditors proposed studying the potential use of the available gravitational energy at the WWTP discharge point into the watercourse, based on a geometric head of 14 m, an average flow rate of 0.3716 m
3/s, and an estimated useful power output of 36 kW, by constructing a minihydropower plant (cross-flow type) for self-consumption [
25].
6. Measures to Be Implemented
With the execution of the energy audit, energy inefficiencies were identified in the WWTP, which, once corrected, could result in a reduction of approximately 10.8% in energy consumption (
Table 8). The audit team provided several recommendations: monitor the performance loss of the motors installed at the initial pumping station; in case of failure, replace the existing electric motors with high-efficiency models; and utilize the hydroelectric potential in the discharge area and the available space for the installation of photovoltaic panels for self-consumption.
Beyond the audit team’s suggestions, it is our understanding that additional measures should be considered based on the presented audit report. As the lamellar decantation treatment is a physical and effective process, it should be implemented in Phase I, similar to what is present in Phase II. This would allow the elimination of the equipment associated with the flotation process and consequently reduce energy, operational, and maintenance costs.
7. Conclusions and Future Work
This paper evaluated the impact of energy auditing based on the PDCA methodology and ISO 50001:2018 standard, which was framed within the context of a legal obligation imposed on the management entity of the WWTP integrated into the SGCIE. In addition, this paper illustrated that the PDCA methodology is structured and systematic and could only identify and correct persistent inefficiency phenomena by approximately 10.8%. The challenges encountered included difficulty accessing data, infrastructure and equipment wear, a limited number of parameters and KPIs, and a restricted inspection period. Therefore, the implementation of systematic and real-time methodologies for data collection, storage, and analysis, according to a multidisciplinary approach, is essential for supporting decision-making (ISO 50001:2018 and the systematic PDCA methodology).
In future work, the development of dedicated and dynamic key performance indicators (KPIs-2d) will be proposed and correlated through intelligent tools to identify and quantify inefficiency phenomena. This approach will be based on real-time data collection, storage, and analysis.