1. Introduction
Our work is the first to use EfficientNet to perform optimal real-time decision-making and object detection in DT-VANET under real-world conditions. In addition, we focus on the optimized architecture that can be used for real-time decision-making. We also discussed the related work and application of EfficientNet in twin-based vehicular networks. Therefore, the following is a summary of our contributions:
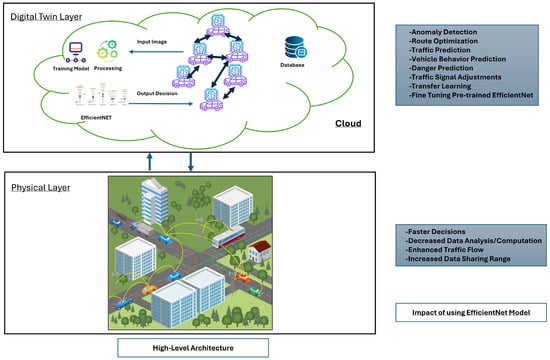
We build a thorough, general architecture for vehicular networks based on digital twins using EfficientNet. A scenario for a digital twin-based vehicular network is shown. In addition, we offer diagrams for twin-based vehicle networks.
We outline the application of EfficientNet in digital twin-based vehicular networks.
Lastly, we conducted experiments/simulations on real-time datasets to evaluate the performance metrics. Our experimental results show an improvement in the reliability and performance of DT-VANET.
3. The Proposed EfficientNet Model for DT-VANET
This section will discuss the proposed CNN-based EfficientNet model, its components, system architecture, and novel lightweight EfficientNet-based DT-VANET algorithms. The model has the following essential parts.
3.1. Digital Twin
Digital twins provide a virtual illustration of the physical vehicular environment. They constantly reflect sensor data, vehicle positions, communication patterns, and speeds. Predictive modeling features are also integrated with the digital twin, allowing it to estimate future network states using historical and present data.
3.1.1. Data Synchronization and Acquisition
Data (traffic patterns, weather conditions, road infrastructure information) from various sensors installed on the vehicle are transmitted through communication devices to the digital twin layer. The acquisition and organization of these data ensure an accurate and current virtual model. Our primary sensor is a camera for real-time images, for example, traffic recognition and object detection, and our supporting sensors are IoT sensors, for example, GPS, accelerometers, and environmental sensors to provide additional vehicle state data and V2X (Vehicle-to-Everything) communication to share critical information across the VANET network. There is also an option to use LiDAR and radar sensors, but LiDAR is expensive and generates large amounts of data, increasing processing time and cost. That is why our architecture does not recommend LiDAR and radar sensors.
3.1.2. Predictive Modeling
The digital twin constructs a detailed model of the selected environment, road infrastructure, surrounding vehicles, and traffic direction. After that, DT produces predictive models that simulate possible incidents such as traffic jams, collisions, or network interruptions using current and historical data. These models are necessary to make proactive decisions.
3.2. Convolutional Neural Network
A specially designed type of deep learning algorithm called Convolutional Neural Networks (CNNs) is used to interpret structured grid data, e.g., images, and classify objects in an image by applying weight and bias to different parts. CNNs are necessary to manage and understand the enormous amount of visual and sensor data produced by the vehicles and their surroundings from the perspective of VANET and DTs. CNN’s architecture minimizes an image to make it easier to interpret while maintaining the essential and noticeable elements needed for a precise prediction. CNNs are the best choice for making real-time and dynamic vehicular decisions because of their ability to learn partial hierarchies of features adaptively and automatically. The following are the three essential features of CNN:
A convolutional layer, which extracts the high- and low-level properties. As we continue to add convolutional layers, the initial convolutional layers currently serve as a manager for extracting low-level attributes. Additional layers are also capable of extracting high-level attributes.
A pooling layer is created using dimensionality reduction to decrease the processing power required to process the data through the extracted feature’s spatial size.
Following the application of the pooling and convolutional layers, the model is effectively trained to know the characteristics. The completed output is flattened and supplied to a fully connected (FC) layer for image classification in several groups.
3.2.1. CNN’s Function in VANET
Vehicles in VANET are equipped with a collection of cameras and sensors that consistently generate data. These effectively managed data can support several advanced applications, including autonomous driving, traffic management, and collision avoidance. Relevant features are extracted from raw sensor data by CNN, such as object detection (e.g., other vehicles, pedestrians, road signs), environmental knowledge, and more. CNNs are skilled in image and video analysis. Then, higher-level decision-making processes are essential to assure the effectiveness and safety of VANET, which uses these features as input.
3.2.2. CNN Application in DT-VANET
Every vehicle in DT-VANET has an equivalent virtual replication of its physical actions and state in real time to handle the spatial and visual data collected from the vehicles. CNN can be added to these digital twin layers. Real-time vehicle environment analysis can be performed using CNNs within the digital twin framework, allowing optimal decision-making.
3.2.3. EfficientNet Integration in DT-VANET
The suggested system’s most essential element is integrating EfficientNet into DT-VANET. The enormous amount of data the digital twin produces is processed using EfficientNet’s design, which helps the system predict in a precise and timely manner.
For our research, we used EfficientNet, an advanced CNN architecture recognized for its precision and computation efficiency. With EfficientNet, efficiency is greatly improved while computational cost is kept to a minimum by maintaining fairness in network width, depth, and resolution scaling by compound scaling. This feature benefits VANETs, where real-time processing speed and accuracy are equally essential.
Data Preprocessing: To ensure feasible input into the EfficientNet model, the raw data from the digital twin are pre-processed and organized. This step requires feature extraction, dimensionality reduction, and normalization to prepare the data for neural network processing.
EfficientNet Architecture: Known for its effective network scalability. EfficientNet is used to manage complicated data streams. The architecture uses fine-tuning to ensure the model can function in real-time with the least latency to maintain fairness in the compromise between computational efficiency and accuracy. An EfficientNet-based model capable of particular VANET activities like anomaly detection, route optimization, or traffic prediction should be designed and implemented.
Model Training: To maximize the performance of the EfficientNet model, train it on historical data before real-time data.
Prediction and Decision Making: After managing the input data, EfficientNet predicts possible dangers, vehicle behaviors, and traffic circumstances. The outcomes that might result in vehicle rerouting, traffic signal adjustments, or driver notifications are based on these estimates.
3.3. Transfer Learning
When there is a large dataset, it is generally evident that CNN performs better than when a small dataset is used. Since training a model with extensive data is not always feasible, transfer learning is used in these cases. Later, we explain how a model is trained on a large standard dataset in transfer learning and may be used to extract attributes for relatively small datasets. This increases productivity and offers a general strategy for solving novel problems. The benefits of using transfer learning are reduced training time, improved performance, and better generalization. We may fine-tune models already trained on big datasets, like object recognition or image classification tasks for VANET-specific jobs, by applying transfer learning, for instance, traffic prediction in real-time, identifying and preventing accidents and road hazards.
3.4. System Architecture
3.5. Vehicle Digital Twin Communication
| Algorithm 1 Vehicle digital twin communication model update |
|
3.5.1. Initialization
Every vehicle carries confidential and private data. Base stations, networks, and wireless communications (5G, Wi-Fi) at the physical layer help transfer data to the digital twin layer.
First, vehicle v in DT-VANET wants to transmit its data to the digital twin layer so that we can optimize decision-making for this vehicle. The neighboring vehicle and the closest to vehicle v is n, which is used for data sharing and communication. The information from the adjacent vehicle is required to validate the data/events and help us make better decisions. The time variable begins from one. The primary purpose of the time variable is to collect real-time data and make predictions accordingly.
3.5.2. Selection of Vehicles
The first loop will traverse each vehicle v in the DT-VANET individually. The loop will guarantee iteration over each vehicle in the network if the condition is met, which means all vehicles are considered once, one at a time. The total number of vehicles on a network is denoted by . Until every vehicle’s decision has been made, the loop continues to be executed.
The second loop iterates through all the neighboring vehicles for each vehicle v. N indicates the number of neighboring vehicles within the communication range. The goal is to communicate with and collect data from neighboring vehicles to help in the decision-making process later for vehicle v. Moving through N neighbors, n is incremented for each neighboring vehicle.
The third loop iterates over time intervals. The total time intervals are represented as T. Digital twins are updated, and real-time data from vehicle sensors are gathered each time. This loop constantly collects and updates data to ensure decision-making in real-time.
3.5.3. Updates to the Digital Twin
Normalization makes the data suitable for neural network input and helps avoid problems like outliers that affect decision-making. This keeps updating until all the vehicles and their neighbors are processing.
In Step 3, after EfficientNet presents the optimum decision recommendation , it is communicated to the vehicle through the base station.
After deciding on the last step, 4, we communicated the feedback from the vehicle to the digital twin layer for improvement in the future decisions of the EfficientNet.
3.6. Server-Side Decision Making Using EfficientNet
| Algorithm 2 Cloud server-side weighted decision making using EfficientNet update |
|
3.6.1. Training Dataset
The Image Training Dataset DS, which consists of previous pre-recorded images from the vehicle’s camera and related decisions, is used to train the EfficientNet model. The primary purpose is to find patterns in the image data that can assist in making real-time decisions. By training EfficientNet, we can ensure that it can be used afterward to make real-time predictions.
3.6.2. Predicted Optimal Decision
After training the model, real-time pre-processed image data from the digital twin are used as input for a feed-forward pass. The predicted decision for the vehicle at time t is produced as an output. The EfficientNet model predicts the vehicle’s decision based on the features learned during the training phase.
3.6.3. Local and Neighbor Vehicle Decision Prediction
The above equation represents the local decision’s confidence factor by . The weight is assigned to the neighboring vehicle decision . By combining these two sources of information, vehicle may make better-informed decisions by considering their prediction and the neighboring vehicle’s predictions.
After integrating decisions, the final decision is forwarded to the concerned vehicle for execution. This could include communicating with neighboring vehicles, rerouting, or changing speed. The algorithm, which depends on local and neighboring information, confirms that every vehicle makes optimal real-time decisions.
3.6.4. Feedback Comparison
A comparison is made between the actual (accurate) decision and the predicted decision . An anomaly is identified if the difference exceeds the threshold determined by the rule (three standard deviations).
The rule helps determine whether the decision deviates abnormally from predicted behavior, suggesting potential anomalies in image data or the decision-making process.
4. Performance Evaluation
This section thoroughly evaluates our suggested framework using EfficientNet through different performance evaluations.
4.1. Dataset
DT constantly receives real-time traffic images from vehicle-mounted cameras and roadside sensors. The trained EfficientNet model, fine-tuned on GTSRB, is deployed to recognize and classify traffic signs effectively. The DT uses the classified traffic signs to dynamically update the virtual environment, allowing real-time decisions about lane shifts, speed adjustments, and traffic light control. The classified traffic signs are crucial input for the DT simulation engine that predicts the vehicle’s paths and actions in real-world scenarios. This optimizes vehicle control strategies by giving early warnings of traffic rules, stop signs, or speed limits.
Performance metrics like accuracy prevent incorrect decisions in DT-VANET. Latency determines how rapidly the DT can detect and respond to real-world traffic. Low resource consumption ensures the smooth functioning of DT-VANET.
4.2. Classification Type
The GTSRB dataset is a dataset of traffic signs categorized into multiple classes, and EfficientNet is used to classify images into one of those predefined categories.
The GTSRB dataset is a collection of images of 43 different classes of traffic signs. These classes are the different categories of signs used on the roads, including speed limits, warnings, prohibitions, and mandatory signs. Some of the major categories include:
speed limit signs (e.g., 30 km/h, 50 km/h, 70 km/h, etc.);
no entry/no passing signs (e.g., no entry, no passing for vehicles over 3.5 t);
priority signs (e.g., right-of-way, give way, stop);
danger warning signs (e.g., dangerous curve, slippery road, pedestrian crossing);
mandatory signs (e.g., turn left, turn right, go straight, roundabout);
prohibitory signs (e.g., no entry, no overtaking);
warning signs (e.g., pedestrian crossing, road work, bumpy road);
priority and yield signs (e.g., stop sign, yield sign).
4.3. Classification Process
4.3.1. Image Pre-Processing
It is crucial to perform preprocessing to bring the GTSRB images from their raw form into a suitable shape that can be fed into the EfficientNet model. The GTSRB dataset contains original images of various sizes. EfficientNet expects images to be in a specific form. E.g., EfficientNet-B0 works best with images of 224 × 224 pixels. Resizing is carried out so that all the input images are the same size during training and inference. The GTSRB images are also noisy and poorly illuminated. The GTSRB dataset has unclear traffic sign images. These images also have a specific amount of uncertainty. Thus, before further processing, traffic sign images have to be normalized. The proposed method first enhances the low-pixel-value images by data normalization for stable training and utilizing the min-max normalization function along with Gaussian and Laplacian filters. Road sign images in their raw form have pixel values between 0 and 255. Min-max normalization scales these values between 0 and 1 by dividing by 255. We applied Gaussian blur to the original images. Then, we attempted to remove the blur by subtracting the blurred image from the original image to reduce noise and smooth the image. Then, we added a weighted portion of the mask. Then, we used a Laplacian filter with a kernel size of 3 × 3 for edge enhancement. This facilitates the training of the neural network by stabilizing the weight updates and also enhances convergence.
4.3.2. Data Division and Augmentation
The deep neural network requires large datasets for better results. Our dataset is large. We have over 50,000 traffic sign images in our dataset, divided into a 70% training set and a 10% validation set, and the remaining 20% are used for testing purposes. Therefore, data augmentation is needed to improve model generalization since traffic signs can appear in different lighting conditions, angles, and distortions in real-world scenarios. We have applied rotation, flipping, and brightness adjustment techniques. Augmentation ensures that the model learns the patterns from different situations and perspectives.
4.3.3. Model Training
The chosen CNN model is EfficientNet because it is very efficient in extracting features from images while maintaining high accuracy. It consists of convolutional layers that detect the edges, textures, and shapes in traffic signs.
Instead of training from scratch, we employ pre-trained EfficientNet weights from a large dataset (ImageNet). The model is fine-tuned on the GTSRB dataset to focus on traffic sign recognition. This approach also reduces the training time and performs better with the limited data.
The last layer of EfficientNet is modified to classify images into 43 categories of traffic signs. A Softmax function is used in the output layer to compute the probabilities for each class, and the sign with the highest probabilities is selected as the final prediction.
Since GTSRB is a multi-class classification problem (with 43 classes), Categorical Cross-Entropy Loss is employed. It measures how well the predicted probability distribution matches the actual class labels.
We used Adam (Adaptive Moment Estimation), the most commonly used optimizer, which adjusts learning rates automatically and works very effectively for complicated models, such as EfficientNet.
The dataset is split into training and validation sets for the model to learn from labeled images and validated using a separate test set to check performance.
4.3.4. Classification Decision Making
After the model has been trained, it is used for real-time traffic sign recognition. The trained model uses a testing set of traffic sign images of the GTSRB dataset. These images are first preprocessed (i.e., resized and normalized) before being given as input to the model. The model provides a probability score for each of the 43 traffic sign categories. The class with the highest probability is chosen as the prediction.
4.3.5. Evaluation Metrics
Accuracy, Precision, Recall, F1-Score, Specificity, Auc, and kappa are used to measure performance. The confusion matrix is used to assess misclassification patterns. Latency, Convergence Time, and Resource Consumption are compared to other approaches to compare performance.
4.4. Baseline Studies
We will compare VGG16, ResNet50, and EfficientNet CNNs. We have used Resnet50 because it has a modern architecture and is well known for its performance and efficiency, while VGG16 is known for its simplicity and effectiveness. All models are implemented in this work on TensorFlow. All models are trained using TensorFlow. As our research of the vehicular network context is primarily aimed toward real-time decision-making, once we have the images through the sensors and cameras of vehicles, it is independent of considerations of wireless transmission effects (e.g., network delays and bandwidth constraints). Wireless transmission introduces additional variables (latency, packet loss, bandwidth constraints, etc.), making it hard to isolate the impact of the CNN model on the decision-making itself, which is the purpose of this paper.
4.5. Performance Metrics
The confusion matrix is the most crucial metric for assessing a model’s performance since other evaluation metrics can be derived from this metric.
The confusion matrix is evaluated using four performance measures: True Negative (TN), False Positive (FP), False Negative (FN), and True Positive (TP). Thus, TN is when the model accurately ignores irrelevant objects or recognizes that there is no traffic sign. FP is when the model misclassifies a traffic sign into the incorrect category or recognizes a sign when none exists. TP is when the model accurately identifies and classifies the traffic sign in the accurate category. FN is when the model fails to identify an existing traffic sign.
Latency is the time needed for the model to process an input and produce an output. The use of computational resources throughout the training process is called Resource Consumption (Computational).
4.6. Experimental Results and Performance Analysis
4.7. Comparison of EfficientNet with VGG16 and ResNet50
Through Compound Scaling, EfficientNet is found to outperform VGG16 and is better than ResNet50 in terms of accuracy. EfficientNet generally has low validation loss because of its efficient utilization of parameters compared to ResNET50 and VGG16 models, which might experience higher validation loss due to their large size and potential inefficiencies in capturing fine details. VGG16 has the highest latency because of the larger model size, and EfficientNet has less model size and latency, making it a recommended choice for decision-making. VGG16 requires the most memory and computational resources and is the heaviest. The lightest is EfficientNet, which has fewer parameters, is suitable for real-time decision making in DT-VANET, and requires less time for convergence. EfficientNet is the fastest of the three models because it is designed to be efficient regarding latency, computational cost, accuracy, and convergence time. The slowest model is VGG16, attributed to its deep and wide architecture and high parameter count.
Source link
Qasim Zia www.mdpi.com