
1. Introduction
In an effort to address this gap, the present study exclusively compares FDM and SLA by manufacturing the same test geometries via each process and rigorously measuring multiple performance indices. Specifically, surface finish is quantified via profilometry, dimensional accuracy by means of standardized reference cubes, and mechanical properties using ASTM-based tensile testing. In parallel, production costs, energy consumption, and waste output are evaluated. By integrating these findings into a single, data-driven framework, this work aims to provide engineers, practitioners, and educators with a clear basis for selecting the most suitable AM technology for diverse project requirements.
2. State of the Art
2.1. Prior Comparisons of FDM and SLA
2.1.1. Surface Finish and Accuracy
2.1.2. Mechanical Properties
2.1.3. Cost and Throughput
2.1.4. Environmental and Reliability Factors
2.2. Identified Research Gap and Motivation
Despite numerous publications on each individual technology, truly holistic evaluations of FDM and SLA remain limited. In particular:
Many comparative studies focus on one performance metric (e.g., tensile strength or dimensional accuracy) rather than capturing multiple factors (surface quality, mechanical properties, cost, energy use, environmental concerns) for the same geometry and build conditions.
Post-processing steps, which can significantly impact surface finish, dimensional accuracy, and total manufacturing time, are often inconsistently reported or omitted altogether.
Environmental burdens, such as recyclability or hazardous material handling, receive insufficient attention, even though they can be decisive in institutional or industrial settings.
Tribological properties and the role of surface measurement techniques in AM characterization remain underexplored, despite their importance for functional applications requiring high-precision surfaces.
Accordingly, there is a need for an integrated analysis that simultaneously measures and compares FDM vs. SLA under controlled experiments, bridging technical, economic, and environmental perspectives. By conducting a direct, multi-criteria comparison of these two prominent AM processes, we aim to offer a more robust basis for selecting the most appropriate technology in prototyping, functional testing, or low-volume production scenarios.
3. Materials and Methods
This section presents the experimental strategy implemented to compare Fused Deposition Modeling (FDM) and Stereolithography (SLA). Our methodology is designed to ensure a fair and reproducible evaluation by using the same test geometries, carefully controlled printing parameters, and standardized measurement techniques across both processes. The study evaluates surface finish, dimensional accuracy, mechanical properties, production cost, energy consumption, environmental impact, and reliability, providing a holistic comparison of the two technologies.
3.1. Materials Selection
The materials selected for this study were chosen based on their widespread use in additive manufacturing and their relevance to prototyping and low-volume production. Two thermoplastics were used for FDM, and one photopolymer resin was selected for SLA:
FDM (PLA): Polylactic Acid filament, a biodegradable thermoplastic derived from renewable resources such as corn starch or sugarcane. PLA is known for its ease of printing, dimensional stability, and moderate mechanical properties, making it a popular choice for prototyping and educational applications.
FDM (ABS): Acrylonitrile Butadiene Styrene filament, a petroleum-based thermoplastic with higher ductility and temperature resistance compared to PLA. ABS is more challenging to print due to its tendency to warp, but it offers superior mechanical performance for functional parts.
SLA (Resin): A general-purpose photopolymer resin designed for high-resolution printing. This resin provides a balance of mechanical strength, surface finish, and detail resolution, making it suitable for applications requiring fine features and smooth surfaces.
3.2. Equipment and Software
The experimental setup included state-of-the-art equipment and software to ensure consistent and reliable results. The following tools were used for fabrication, post-processing, and testing:
Printers:
- –
FDM: Ultimaker S3 (Ultimaker BV, Geldermalsen, The Netherlands), a dual-extrusion desktop printer known for its reliability and ease of use. The printer features a heated build plate and a semi-enclosed build chamber, which are essential for printing ABS.
- –
SLA: Formlabs Form 3 (Formlabs Inc., Somerville, MA, USA), a high-resolution desktop SLA printer with a low-force stereolithography (LFS) system. This printer uses a flexible tank and a linear laser to achieve precise and consistent prints.
Slicing Software:
- –
Ultimaker Cura (v4.8) for FDM, which provides advanced settings for layer height, infill density, support structures, and print speed.
- –
PreForm (v3.12) for SLA, which automatically optimizes print orientation, support placement, and resin usage.
Measurement Tools:
- –
Instron 3369 universal testing machine (Instron, Norwood, MA, USA) for mechanical testing, capable of measuring tensile strength, elongation, and Young’s modulus with high precision.
- –
Mitutoyo Surftest SJ-210 surface profilometer (Mitutoyo Corp., Kawasaki, Japan) for surface roughness measurements, with a resolution of 0.01 m and a cut-off length of 0.8 mm.
- –
Mitutoyo Absolute Digimatic digital caliper (accuracy mm) for dimensional accuracy measurements.
- –
PCE-PA6000 power analyzer (PCE Instruments, Meschede, Germany) for monitoring energy consumption during printing and post-processing.
All equipment was calibrated according to manufacturer guidelines before and during the experiments to ensure accurate and repeatable measurements.
3.3. Specimen Design
To evaluate the performance of FDM and SLA across multiple metrics, three distinct geometries were designed in SolidWorks® 2020 and exported as STL files for slicing:
Dimensional Accuracy: A simple cube (50 mm per side) was used to assess dimensional deviations along the X, Y, and Z axes. This geometry allows for straightforward measurements and comparison of tolerances.
Surface Quality: A flat plate (100 mm × 100 mm × 5 mm) was designed to facilitate repeatable surface roughness measurements. The large flat surface ensures consistent profilometry scans.
Mechanical Properties: Tensile bars conforming to ASTM D638 Type IV were used to evaluate ultimate tensile strength (UTS), elongation at break, and Young’s modulus. This standardized geometry ensures compatibility with the existing literature and testing protocols.
All parts were oriented so that their largest face was parallel to the build platform, ensuring consistent support strategies and allowing direct dimensional comparisons in X, Y, and Z.
3.4. Printing Parameters and Post-Processing
For FDM, PLA prints were cooled with a fan to minimize warping, while ABS prints were built in a semi-enclosed chamber with the fan off to maintain a stable temperature. SLA prints were immersed in isopropyl alcohol (IPA) for 10 min to remove residual liquid resin, then UV-cured for 15 min, following the resin supplier’s guidelines.
3.5. Testing Procedures
All samples were prepared in sets of five to ten replicates per material to ensure statistical robustness. The following testing procedures were employed:
3.5.1. Surface Roughness
Surface roughness was measured using the Mitutoyo Surftest SJ-210 profilometer. Five evenly spaced scans were taken on each flat plate, and the arithmetic mean roughness () was calculated with a cut-off length of 0.8 mm. This method ensures repeatability and consistency in surface finish evaluation.
3.5.2. Dimensional Accuracy
Dimensional accuracy was assessed by measuring the 50 mm cubes along all three axes using a digital caliper. Dimensional deviation was defined as . Mean and standard deviation values were computed to characterize overall accuracy and variability.
3.5.3. Mechanical Testing
Tensile tests were conducted using the Instron 3369 universal testing machine, following the ASTM D638 Type IV standard. Each specimen was pulled at a crosshead speed of 5 mm/min until fracture. Ultimate Tensile Strength (UTS), elongation at break, and Young’s modulus were derived from the load-displacement data.
3.5.4. Production Cost and Energy Use
Production costs were calculated based on material usage, labor, and energy consumption. Material costs were determined by measuring filament mass (FDM) or resin volume (SLA) and multiplying by the respective unit price. Labor costs included setup, print monitoring, and post-processing time. Energy consumption was measured using the PCE-PA6000 power analyzer and converted into monetary cost using local electricity rates.
3.5.5. Environmental Impact and Reliability
Environmental impact was assessed by weighing support structures and failed prints, then classifying waste streams as biodegradable, recyclable, or hazardous. Print reliability was quantified as the number of successful prints per total attempts, with dominant failure modes (e.g., warping for FDM, incomplete curing for SLA) documented.
3.6. Data Analysis
All test outcomes were tabulated and statistically analyzed using Python v3.13 (NumPy, SciPy) and MATLAB vR2024b. Averages, standard deviations, and 95% confidence intervals were calculated for each metric. Intergroup comparisons were performed using a two-sample t-test with a significance level of . Correlations between parameters (e.g., layer height vs. ) were also explored to identify potential relationships within each technology.
3.7. Methodological Assumptions and Limitations
The methodology aims to reflect typical industry setups, but certain assumptions may limit generalizability:
Printer-Specific Results: Different FDM or SLA models may yield variations due to differences in calibration, nozzle type, or resin formulations.
Material Scope: Only PLA, ABS, and a standard SLA resin were tested. High-performance filaments or specialized resins (e.g., carbon fiber-reinforced, flexible, or high-temperature) might exhibit different behaviors.
Sample Size vs. Practicality: Although five to ten replicates per condition generally suffice for reliable mean estimates, larger sample sizes could further reduce statistical uncertainties.
Despite these limitations, the systematic approach of using identical geometries, consistent build parameters, and standardized testing ensures a fair and meaningful comparison between FDM and SLA, providing valuable insights for practitioners and researchers.
4. Results and Discussion
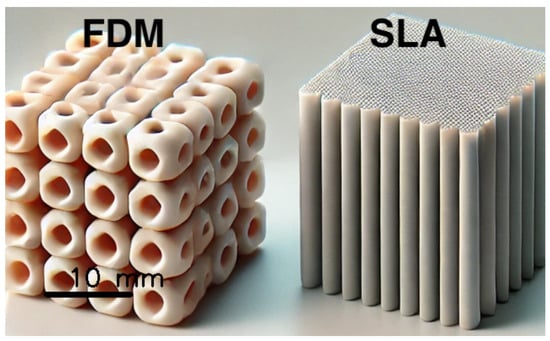
4.1. Overall Appearance and Qualitative Observations
4.2. Surface Finish
4.2.1. Profilometry Measurements
FDM (PLA):
FDM (ABS):
SLA (Resin):
SLA exhibited significantly smoother surfaces than FDM, with values approximately 80% lower. Statistical analysis (t-test, ) confirmed that the difference in between SLA and each FDM group was highly significant (). This result underscores SLA’s advantage in applications requiring fine surface finishes, such as molds, dental models, or aesthetic prototypes.
4.2.2. Post-Processing Influence
Post-processing further improved surface quality for both technologies. Light sanding or acetone vapor smoothing reduced FDM roughness by up to 50%, achieving . SLA parts, after post-curing and a brief surface polish, achieved . While post-processing narrows the gap, SLA retains a clear advantage for applications requiring ultra-smooth surfaces or low friction.
4.3. Dimensional Accuracy
Cubic Specimens
SLA consistently maintained tighter tolerances () compared to FDM (). The higher deviations in FDM are attributed to factors such as nozzle diameter variability, thermal contraction, and warping, particularly in ABS. These results highlight SLA’s precision advantage for applications requiring high dimensional accuracy, such as interlocking parts or assemblies.
4.4. Mechanical Performance
4.4.1. Tensile Test Data
SLA exhibited the highest tensile strength ( MPa), outperforming both PLA and ABS. However, FDM ABS demonstrated superior ductility, with an elongation at break of , compared to SLA’s . PLA’s intermediate elongation and higher stiffness ( GPa) position it between ABS and SLA on the stiffness–ductility spectrum. These findings suggest that SLA is better suited for load-bearing applications, while FDM ABS is preferable for parts requiring impact resistance or flexibility.
These stress–strain curves reinforce the previous numerical findings, confirming that SLA resin offers the highest tensile strength but fractures without significant plastic deformation, limiting its ability to withstand impact forces. In contrast, FDM ABS, despite having a lower UTS, allows for substantial elongation, making it preferable for components subjected to dynamic or shock loads. PLA remains an intermediate option, combining moderate strength and ductility. This analysis suggests that material selection should be guided not only by ultimate strength but also by expected loading conditions and failure tolerance.
4.4.2. Effect of Infill Density on FDM Mechanical Properties
The tensile properties of FDM prints depend significantly on infill density, which was set to 20% in this study as a trade-off between strength, material efficiency, and print speed. Higher infill densities—such as 50% or 100%—would result in improved tensile strength and stiffness, but at the cost of increased print time, material usage, and weight. Previous research suggests that increasing infill to 100% can enhance tensile strength by up to 30–50%, depending on layer adhesion and print quality. However, for many practical applications, such as prototyping and lightweight structural components, lower infill percentages are preferred to maintain reasonable production efficiency.
Additionally, unlike SLA prints, which are inherently solid, FDM prints rely on internal infill structures to balance strength and efficiency. The honeycomb or grid-like structures used in FDM prints influence not only the tensile properties but also the impact resistance and failure mode of the material. A higher infill setting would reduce deformation under load and improve failure tolerance, making FDM a more competitive choice for functional parts requiring mechanical durability. Future studies could explore the optimal infill-density-to-strength ratio in more complex geometries and real-world load conditions.
4.4.3. Fracture Observations
Visual inspection of fractured tensile bars revealed distinct failure modes. SLA samples exhibited brittle failure with clean cracks and minimal plastic deformation. In contrast, FDM ABS showed significant necking and ductile failure, while PLA exhibited limited necking. These observations align with the measured mechanical properties and provide additional insights into material behavior under stress.
4.5. Cost, Energy, and Throughput Analysis
4.5.1. Material and Labor Costs
FDM is significantly more cost-effective, with per-part costs approximately 60% lower than SLA. This cost advantage is driven by lower material prices and faster production times.
4.5.2. Build Times and Production Rate
4.5.3. Energy Consumption
FDM consumed 0.75–0.85 kWh per part, compared to 1.0–1.1 kWh for SLA. This difference, while modest on a per-part basis, becomes significant in high-volume production.
4.6. Environmental and Reliability Evaluation
4.6.1. Waste Generation and Recyclability
FDM generated 15% waste by weight, primarily from support structures and failed prints. SLA produced 10% waste, but its resin is hazardous if uncured. PLA is biodegradable, and ABS is recyclable, whereas SLA resin requires specialized disposal.
4.6.2. Reliability
FDM achieved an 80% success rate, with failures due to nozzle clogs or warping. SLA reached a 90% success rate, but failures were more costly due to resin cleanup. SLA also requires stricter safety protocols for resin handling.
4.7. Discussion and Integrated Assessment
Comparison with Prior Studies
Several studies have explored the comparative performance of FDM and SLA across various parameters, including surface finish, dimensional accuracy, mechanical properties, and cost-effectiveness. Our results are in general agreement with previous research but also introduce novel insights into material behavior under standardized conditions.
Overall, our study builds upon previous research by providing a comprehensive, multi-faceted analysis that integrates mechanical, economic, and environmental factors into a single framework, offering a more holistic perspective on AM technology selection.
4.8. Summary of Key Insights
- 1.
Surface Finish and Precision: SLA achieves ∼2 roughness and mm tolerances, outperforming FDM.
- 2.
Mechanical Properties: SLA exhibits higher tensile strength (68.9 MPa) but lower ductility (4.4% elongation at break). FDM ABS, while weaker in tensile strength (47.5 MPa), offers superior toughness (8.7% elongation at break), making it suitable for impact-resistant applications.
- 3.
Cost and Throughput: FDM is significantly more economical (∼–∼EUR/part) and faster (45–55 min per part) compared to SLA (∼EUR/part and 90–100 min per part). This makes FDM ideal for rapid prototyping and cost-sensitive projects.
- 4.
Environmental and Safety Considerations: FDM waste (PLA/ABS) is biodegradable or recyclable, whereas SLA resin waste is hazardous if uncured. However, SLA generates slightly less waste by mass (10% vs. 15% for FDM).
- 5.
Reliability and Ease of Use: FDM has an 80% success rate, with failures primarily due to nozzle clogs or warping. SLA achieves a 90% success rate but requires stricter handling of resin and post-processing, increasing operational complexity.
5. Conclusions
This study provides an in-depth, head-to-head comparison of Fused Deposition Modeling (FDM) and Stereolithography (SLA), based on identical test geometries and standardized methods. By assessing surface quality, dimensional accuracy, mechanical properties, production cost, energy consumption, and environmental factors, we illustrate how these prominent additive manufacturing (AM) technologies align with different requirements and constraints.
Overall, the results demonstrate that each technology excels under particular conditions. SLA offers precise dimensional tolerances—around —and the smoothest as-printed surfaces (). Its higher tensile strength (up to 69–) can be advantageous for applications needing strong, rigid parts. Yet these benefits come at a higher cost per part, a slower throughput, and a more complex post-processing workflow, where uncured resin demands careful handling and disposal.
In contrast, FDM demonstrates significant advantages for cost-sensitive or rapid prototyping scenarios, with typical build times almost half those of SLA and part costs that can be reduced by more than 50%. While the resultant prints may be limited to – and dimensional deviations closer to –, this slightly coarser finish remains acceptable for many engineering prototypes. FDM further stands out for its simpler waste management, particularly if biodegradable PLA is used, as opposed to SLA’s resin-based waste, which is generally hazardous in its uncured form.
From a mechanical perspective, FDM parts—especially those printed with ABS—offer a somewhat lower tensile strength but better ductility, which translates to greater tolerance for dynamic or impact loading. Meanwhile, SLA excels in load-bearing applications that demand high strength and finer detail, provided the brittleness of the material does not undermine part performance. In terms of reliability, FDM experienced more nozzle-related issues and warping, yet SLA’s occasional print failures often resulted in more time-consuming cleanup.
Looking to the future, research may focus on exploring advanced filaments (e.g., carbon- or glass fiber-reinforced) and high-performance SLA resins (e.g., high-temperature or impact-resistant) to refine the balance between mechanical properties and cost. Additional studies on wear, fatigue, or UV resistance would help quantify long-term performance, bridging the gap from short-term testing to real-world applications. Investigations into hybrid approaches that combine the rapid throughput of FDM with SLA’s superior surface quality are also of interest. Furthermore, comprehensive life-cycle assessments (LCAs), paired with decision-making tools such as AHP or TOPSIS, could offer deeper insights into sustainability across different production scales.
In conclusion, neither FDM nor SLA emerges as outright superior for all applications. Rather, each approach meets particular needs, depending on criteria such as dimensional tolerance, surface smoothness, mechanical strength, production budget, and environmental considerations. By clarifying these trade-offs, the present research can guide practitioners toward a more informed selection of AM processes—maximizing functional performance while balancing cost-effectiveness and sustainability.
Source link
Maryam Abbasi www.mdpi.com