1. Introduction
Diffuse large B-cell lymphoma (DLBCL) is well known to be the most common subtype of non-Hodgkin’s lymphoma (NHL), accounting for about 30% of all cases, and is clinically a very heterogeneous disease. Rituximab plus cyclophosphamide, hydroxydaunomycin, vincristine, and prednisone (R-CHOP) has been the standard first-line treatment for patients with DLBCL for nearly two decades; approximately one third of the patients will not respond to this treatment and have aggressive clinical courses [
1,
2]. Accurate risk stratification of patients can help to predict outcomes and support tailored treatment strategies. The International Prognostic Index (IPI) is used at baseline for risk stratification of patients with DLBCL and takes into account age, Eastern Cooperative Oncology Group (ECOG) performance status, lymphoma stage, serum lactate dehydrogenase (LDH), and number of extranodal sites [
3].
Currently,
18F-fluoro-2-deoxyglucose (FDG) positron emission tomography (PET)/computed tomography (CT) is considered essential at the baseline and the end of first-line therapy in most lymphoma [
4]. In addition, interim FDG PET/CT is a crucial imaging tool for predicting therapeutic outcomes and response-adapted therapy in most patients with Hodgkin’s lymphoma (HL) [
5,
6]. Although current guidelines carefully recommend interim FDG PET/CT in patients with DLBCL due to the possibility of false positives, interim FDG PET/CT is already actively performed in the research setting and clinical practice [
4,
7,
8]. In DLBCL, interim FDG PET/CT is recommended after 2–4 cycles of R-CHOP, and the optimal timing has not been fully investigated. Metabolic decline in lymphoma lesions occurs immediately and rapidly after the initiation of chemotherapy [
9,
10]. This leads to the possibility that very early interim FDG PET/CT after one cycle of R-CHOP can be used to tailor the treatment approaches for patients with DLBCL. In our previous results [
11], a good response in interim FDG PET/CT after one cycle of R-CHOP was correlated with complete metabolic response (CMR) at the end of therapy, but did not predict one-year disease-free status.
Therefore, we performed this study to evaluate whether very early interim FDG PET/CT after a single cycle of R-CHOP chemotherapy has prognostic value independent of IPI score and improves the prediction of long-term survival outcome in patients with DLBCL. We also explored the metabolic kinetics to R-CHOP through FDG PET/CT obtained at four different time points.
2. Materials and Methods
2.1. Study Design and Patients
A cohort prospectively enrolled at a tertiary hospital specializing in hematologic malignancies between March 2012 and December 2017 (ClinicalTrials.gov identifier NCT01357733) was retrospectively reviewed and analyzed for this study. The objective of the prospective study was to evaluate whether very early response assessment by PET/CT after one cycle of R-CHOP is predictive of treatment success in patients with DLBCL, and the results in this study population have been reported in a previous publication [
11]. Consecutive adult patients (>18 years) with confirmed CD20-positive DLBCL and no prior treatment for lymphoma were enrolled in the study. Exclusion criteria were pregnancy and primary central nerve system lymphoma. All patients received R-CHOP chemotherapy as the standard first-line treatment and underwent four FDG PET/CT studies using the same predetermined protocol and system: at baseline (PET0), and after one (PET1), three (PET3), and six cycles of chemotherapy (PET6). PET1 was performed 2 to 48 h before the second cycle of R-CHOP was administered. The PET1 findings were not used to change the course of therapy. After the completion of R-CHOP chemotherapy, regular clinical follow-up included physical examination, performance status, and routine blood lab examination every 3 months, and contrast enhanced CT of the neck, chest, and abdomen every 3 or 6 months.
The study was approved by the institutional review board of our hospital (KC11EISI0293). All patients provided written informed consent in accordance with institutional guidelines.
2.2. FDG PET/CT Acquisition
Fasting for at least 6 h was mandatory before FDG 5.2–7.8 MBq/kg was injected intravenously, and scanning began strictly 60 min later. None had blood glucose levels > 180 mg/dL. Biograph Truepoint (Siemens Medical Solutions, Knoxville, TN, USA) was used for all patients. Non-contrast enhanced CT from the vertex and to the thighs was obtained (120 kVp, 80 mAs, 3-mm slice thickness) and PET followed immediately (1.5–2.5 min per bed position). The CT data were used for attenuation correction, and PET images were reconstructed using standard-ordered-subset expectation maximization (two iterations, eight subsets). The axial spatial intrinsic resolution of the system was 4.2 mm at the center of the field of view.
2.3. FDG PET/CT Image Analysis
Two experienced nuclear medicine physicians unaware of patient information reviewed all FDG PET/CT images using XD3 (Mirada Medical, Oxford, UK). Response was visually assessed using the Deauville 5-point scale: Deauville score (DS) 1, no uptake; score 2, uptake ≤ mediastinum; score 3, mediastinum < uptake < liver; score 4, uptake moderately > liver; and score 5, uptake markedly > liver or any new lesion [
4]. DS 1, 2, and 3 were considered PET-negative and DS 4 and 5 PET-positive. If there was disagreement between the readers, consensus was achieved via review by a third nuclear medicine physician. In the quantitative analysis, peak standardized uptake value corrected for lean body mass (SULpeak) was derived semi-automatically using a spherical volume of interest (VOI) of 1 cm
3 [
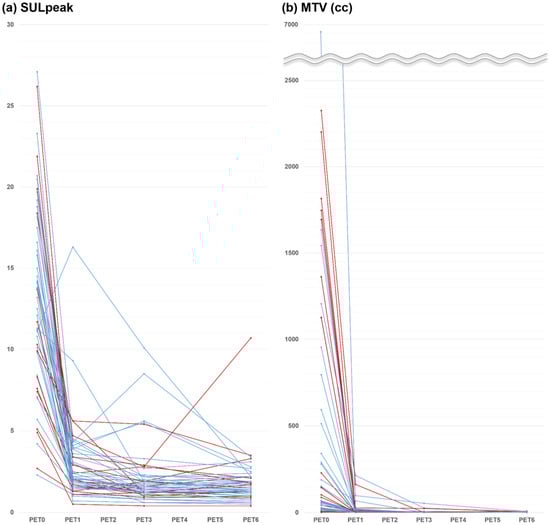
12]. We also measured the metabolic tumor volume (MTV) of all lymphoma lesions, and average of 1.5 × SUL + 2 standard deviation (SD) in the liver was used to define each threshold. The percent changes in SULpeak and MTV at early interim between PET0 and PET1 (%ΔSUL1 and %ΔMTV1), at interim between PET0 and PET3 (%ΔSUL3 and %ΔMTV3), and at end of therapy between PET0 and PET6 (%ΔSUL6 and %ΔMTV6) were calculated. SULpeak and MTV were measured independently, and the measurements were repeated when the numbers were not equal.
2.4. Statistical Analysis
The primary endpoint was overall survival (OS), which was defined as the time from the date of PET0 to the date of death from any cause or last clinical follow-up. Progression-free survival (PFS) was defined as the time from the date of PET0 to the date of detected disease progression/recurrence or death. The Kaplan–Meier method was used to estimate survival times, and the log-rank test was used for assessment of survival differences between groups. Univariate Cox proportional hazards regression was used to identify prognostic factors for PFS and OS. Based on the results of the univariate analysis, different multivariate Cox proportional hazards models were used to evaluate the independent prognostic effect of each PET parameter after adjustment for the effects of significant clinical factors. All statistical analyses were performed using SPSS version 26 (IBM Corp., Armonk, NY, USA). Differences with p value < 0.05 were considered statistically significant.
4. Discussion
The prognostic value of very early interim FDG PET/CT following only a single cycle of first-line R-CHOP chemotherapy was evaluated for long-term outcomes in patients with DLBCL. Our results demonstrated that none of the FDG PET parameters obtained at this early time point were associated with long-term survival outcomes, while FDG PET parameters obtained at the end-of-therapy had significant value in predicting PFS and OS. The rates of decline or growth of tumor illustrated through FDG PET obtained at different time points may represent an aspect of tumor biology that could be missed on single time-point assessment [
13]. Thus, FDG PET/CT images were obtained at four different time points under strictly controlled uniform imaging conditions. On PET1, all but one patient showed decreased FDG uptake intensity, and all patients showed decreased tumor volume.
Interim FDG PET can track metabolic changes during treatment and enable early risk stratification in patients of lymphoma. Early identification of chemo-sensitive patients allows a reduction in dose intensity, which can provide satisfactory tumor control and minimize side effects. On one hand, early identification of late or non-responders may provide an opportunity to improve poor prognosis by dose escalation or modification of the treatment plan [
14,
15]. Many studies have reported predictive and prognostic values of interim PET in DLBCL [
16]. Previous prospective studies showed that interim PET-negative results after two cycles of R-CHOP were significantly associated with treatment success in patients with DLBCL, similar to our previous results [
11,
17,
18]. In this study, neither interim PET/CT after one cycle of R-CHOP nor interim PET/CT after three cycles was associated with long-term outcomes in patients with DLBCL, supporting previous studies that reported the lack of predictive value of interim PET/CT [
19]. However, a few studies reported that interim PET-positive results were significantly associated with worse survival [
17,
18]. In a prospective study with large sample size (
n = 609), interim PET after two cycles of R-CHOP predicted 2-year event-free survival and OS independent of the IPI score, but treatment intensification based on interim PET did not change outcomes [
20]. The prognostic role of interim PET in predicting survival outcome in patients with DLBCL remains debatable.
We added FDG PET/CT after a single cycle of R-CHOP, under the assumption that very early assessment with a higher volume of remaining tumor may better discriminate response rates compared to a later time point when the remaining tumors may be under the detection limits of PET/CT systems. Interim FDG PET/CT is usually recommended after 2–4 cycles of R-CHOP in DLBCL [
7]. A previous study investigating the optimal timing of interim PET in patients with DLBCL showed no difference in prognostic values between PET1 (
n = 30) and PET after two cycles of R-CHOP (
n = 30) using both SUV change and DS [
21]. Other studies have shown that PET1 could predict short-term outcomes [
22,
23,
24]. However, in a more recent comparative study with a large sample size (
n = 1692), including interim PET at various time points after 1–4 cycles, PET1 alone failed to discriminate between good and poor responders [
25]. To our knowledge, no study has investigated the prognostic value of PET1 for long-term survival outcomes. Our median follow-up was 63 months, and the 10-year PFS and OS rates were 48% and 61%, respectively. After the introduction of R-CHOP in patients with DLCBL, the 10-year OS in the real-world setting is thought to be in the range of 51–66%, similar to our results [
26,
27]. Relapse most often is within the first 2–3 years after initial treatment, and relapse rarely occurs after more than 5 years [
28]. However, in our results, 24% of patients (
n = 4/17) with disease progression had progression after more than 5 years.
Several retrospective and prospective studies have also shown that end-of-therapy PET is predictive of survival [
18,
29,
30]. In our results, both visual and quantitative PET6 assessments were associated with even longer-term outcomes at 10 years. Although the current guidelines recommend visual analysis in the response assessment of patients with lymphoma [
7], quantitative analysis may be more informative and objective. In previous studies in patients with DLBCL, SUV-based analysis at interim PET was a better response criterion than visual analysis based on the Deauville 5-point scale [
25,
29,
31].
The relatively small number of patients is a major limitation of this study. However, our study enrolled a homogeneous set of patients, imposed strictly controlled imaging conditions, and obtained long-term outcomes (median follow-up 63 months and maximum 134 months). All patients in this study received first-line R-CHOP chemotherapy and all FDG PET/CT studies were from same time points under predetermined imaging conditions using the same scanner. Therefore, we were able to analyze the absolute SUV and MTV values without the need for standardization to obtain precise quantitative measurements [
32,
33]. Another limitation was that we did not investigate total lesion glycolysis, which is reported to be a promising predictive marker [
30,
34]. Although current guidelines recommend visual analysis for response assessment in patients with lymphoma, standardized volumetric parameters are being promoted as imaging biomarkers in DLBCL and may enter the clinical practice in the near future.