Author Contributions
Conceptualization, H.T.; methodology, H.T.; software, T.Z. and H.T.; validation, T.Z. and Y.L.; formal analysis, T.Z. and Y.L.; investigation, T.Z. and Y.L.; resources, T.Z. and Y.L.; data curation, T.Z. and Y.L.; writing—T.Z.; writing—review and editing, H.T.; visualization, T.Z. and Y.L.; supervision, H.T.; project administration, H.T.; funding acquisition, H.T. All authors have read and agreed to the published version of the manuscript.
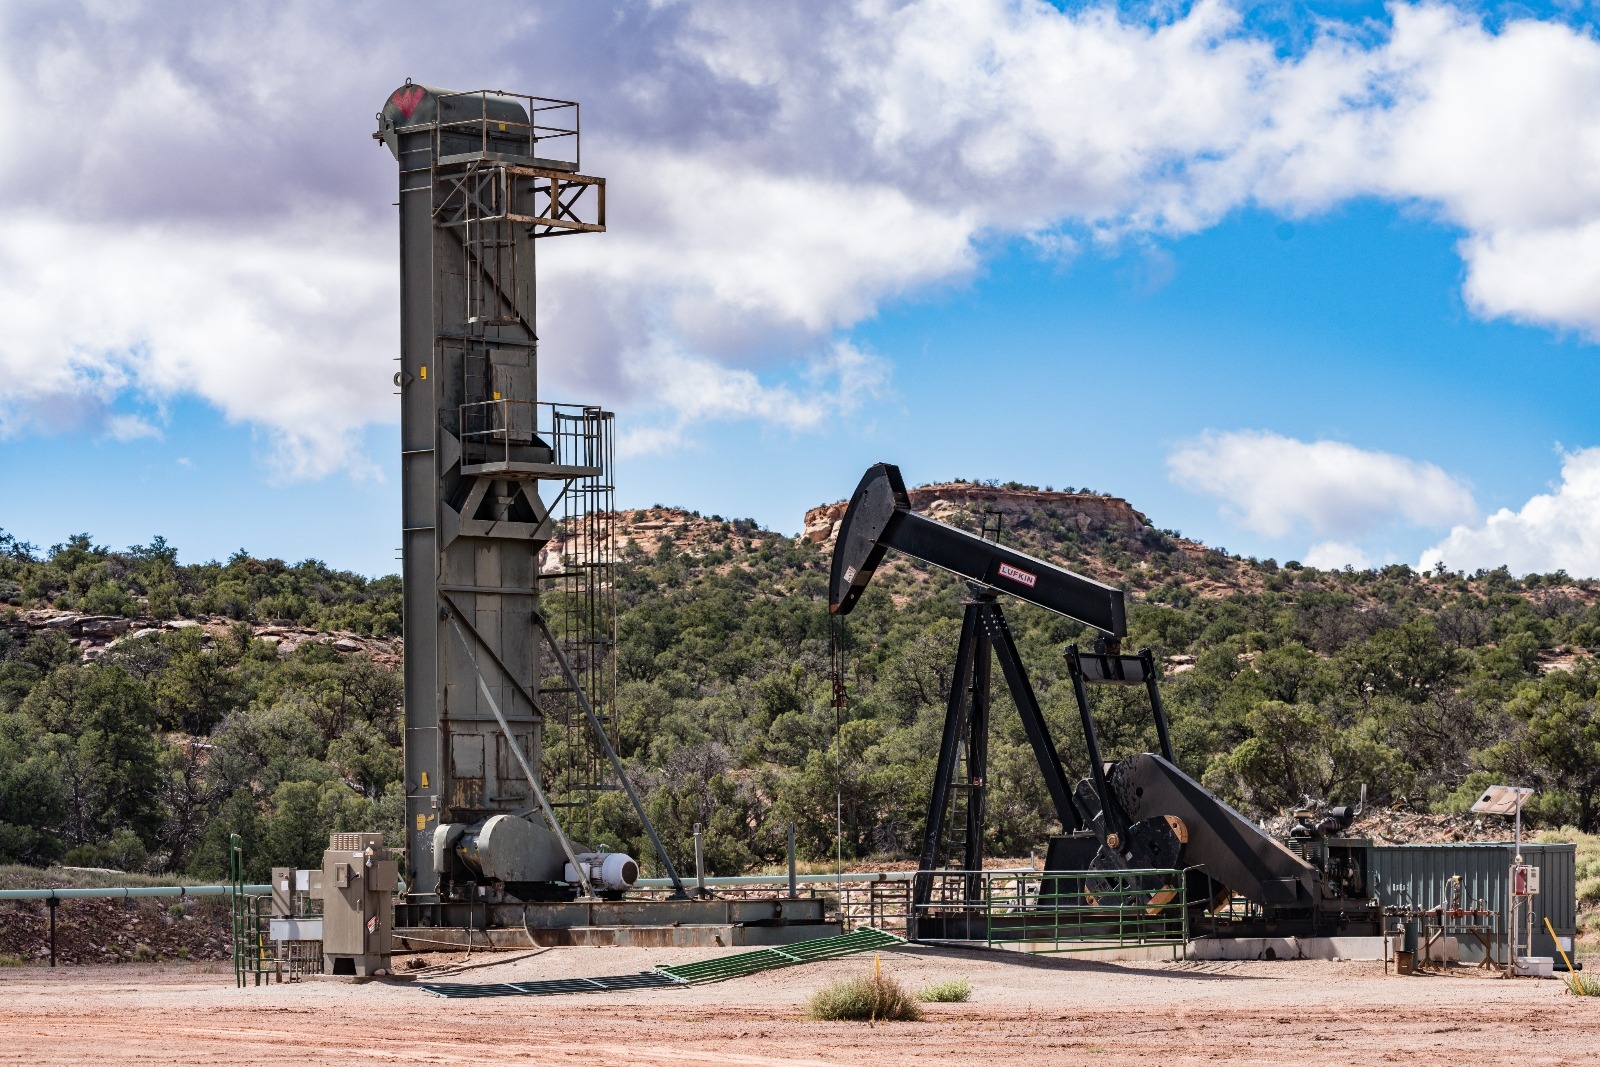
Figure 1.
Image of the obtained biochar.
Figure 2.
Photos of the prepared BCB.
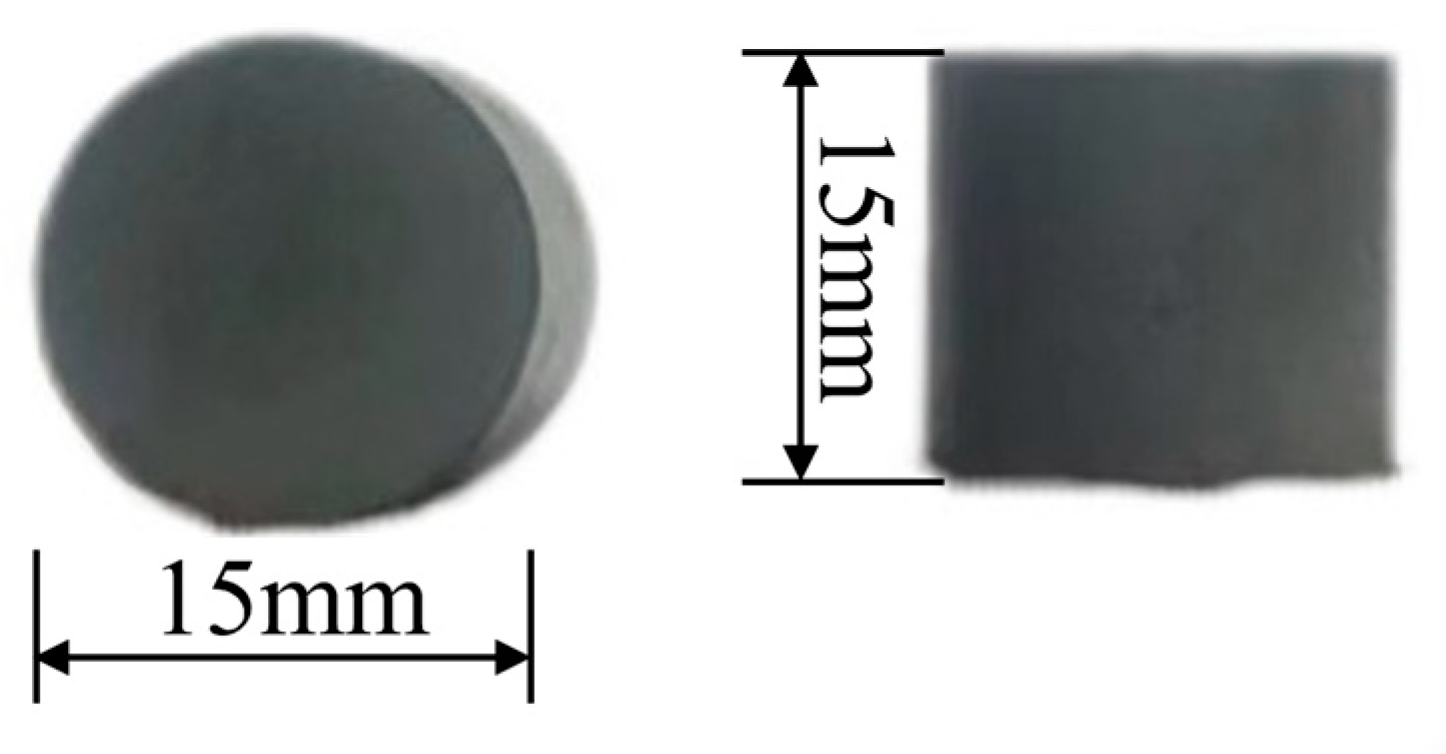
Figure 3.
Experimental device: (1, 2) mass flow controller, (3) mixing chamber, (4) mass-loss sensor, (5) furnace, (6) MoSi2 heating elements, (7) hot temperature zone, (8) sample holder, (9) reaction tube, (10) alumina ball, (11) thermocouple, (12) computer, (13) IR heater, (14) suspending wire, and (15) water sealing.
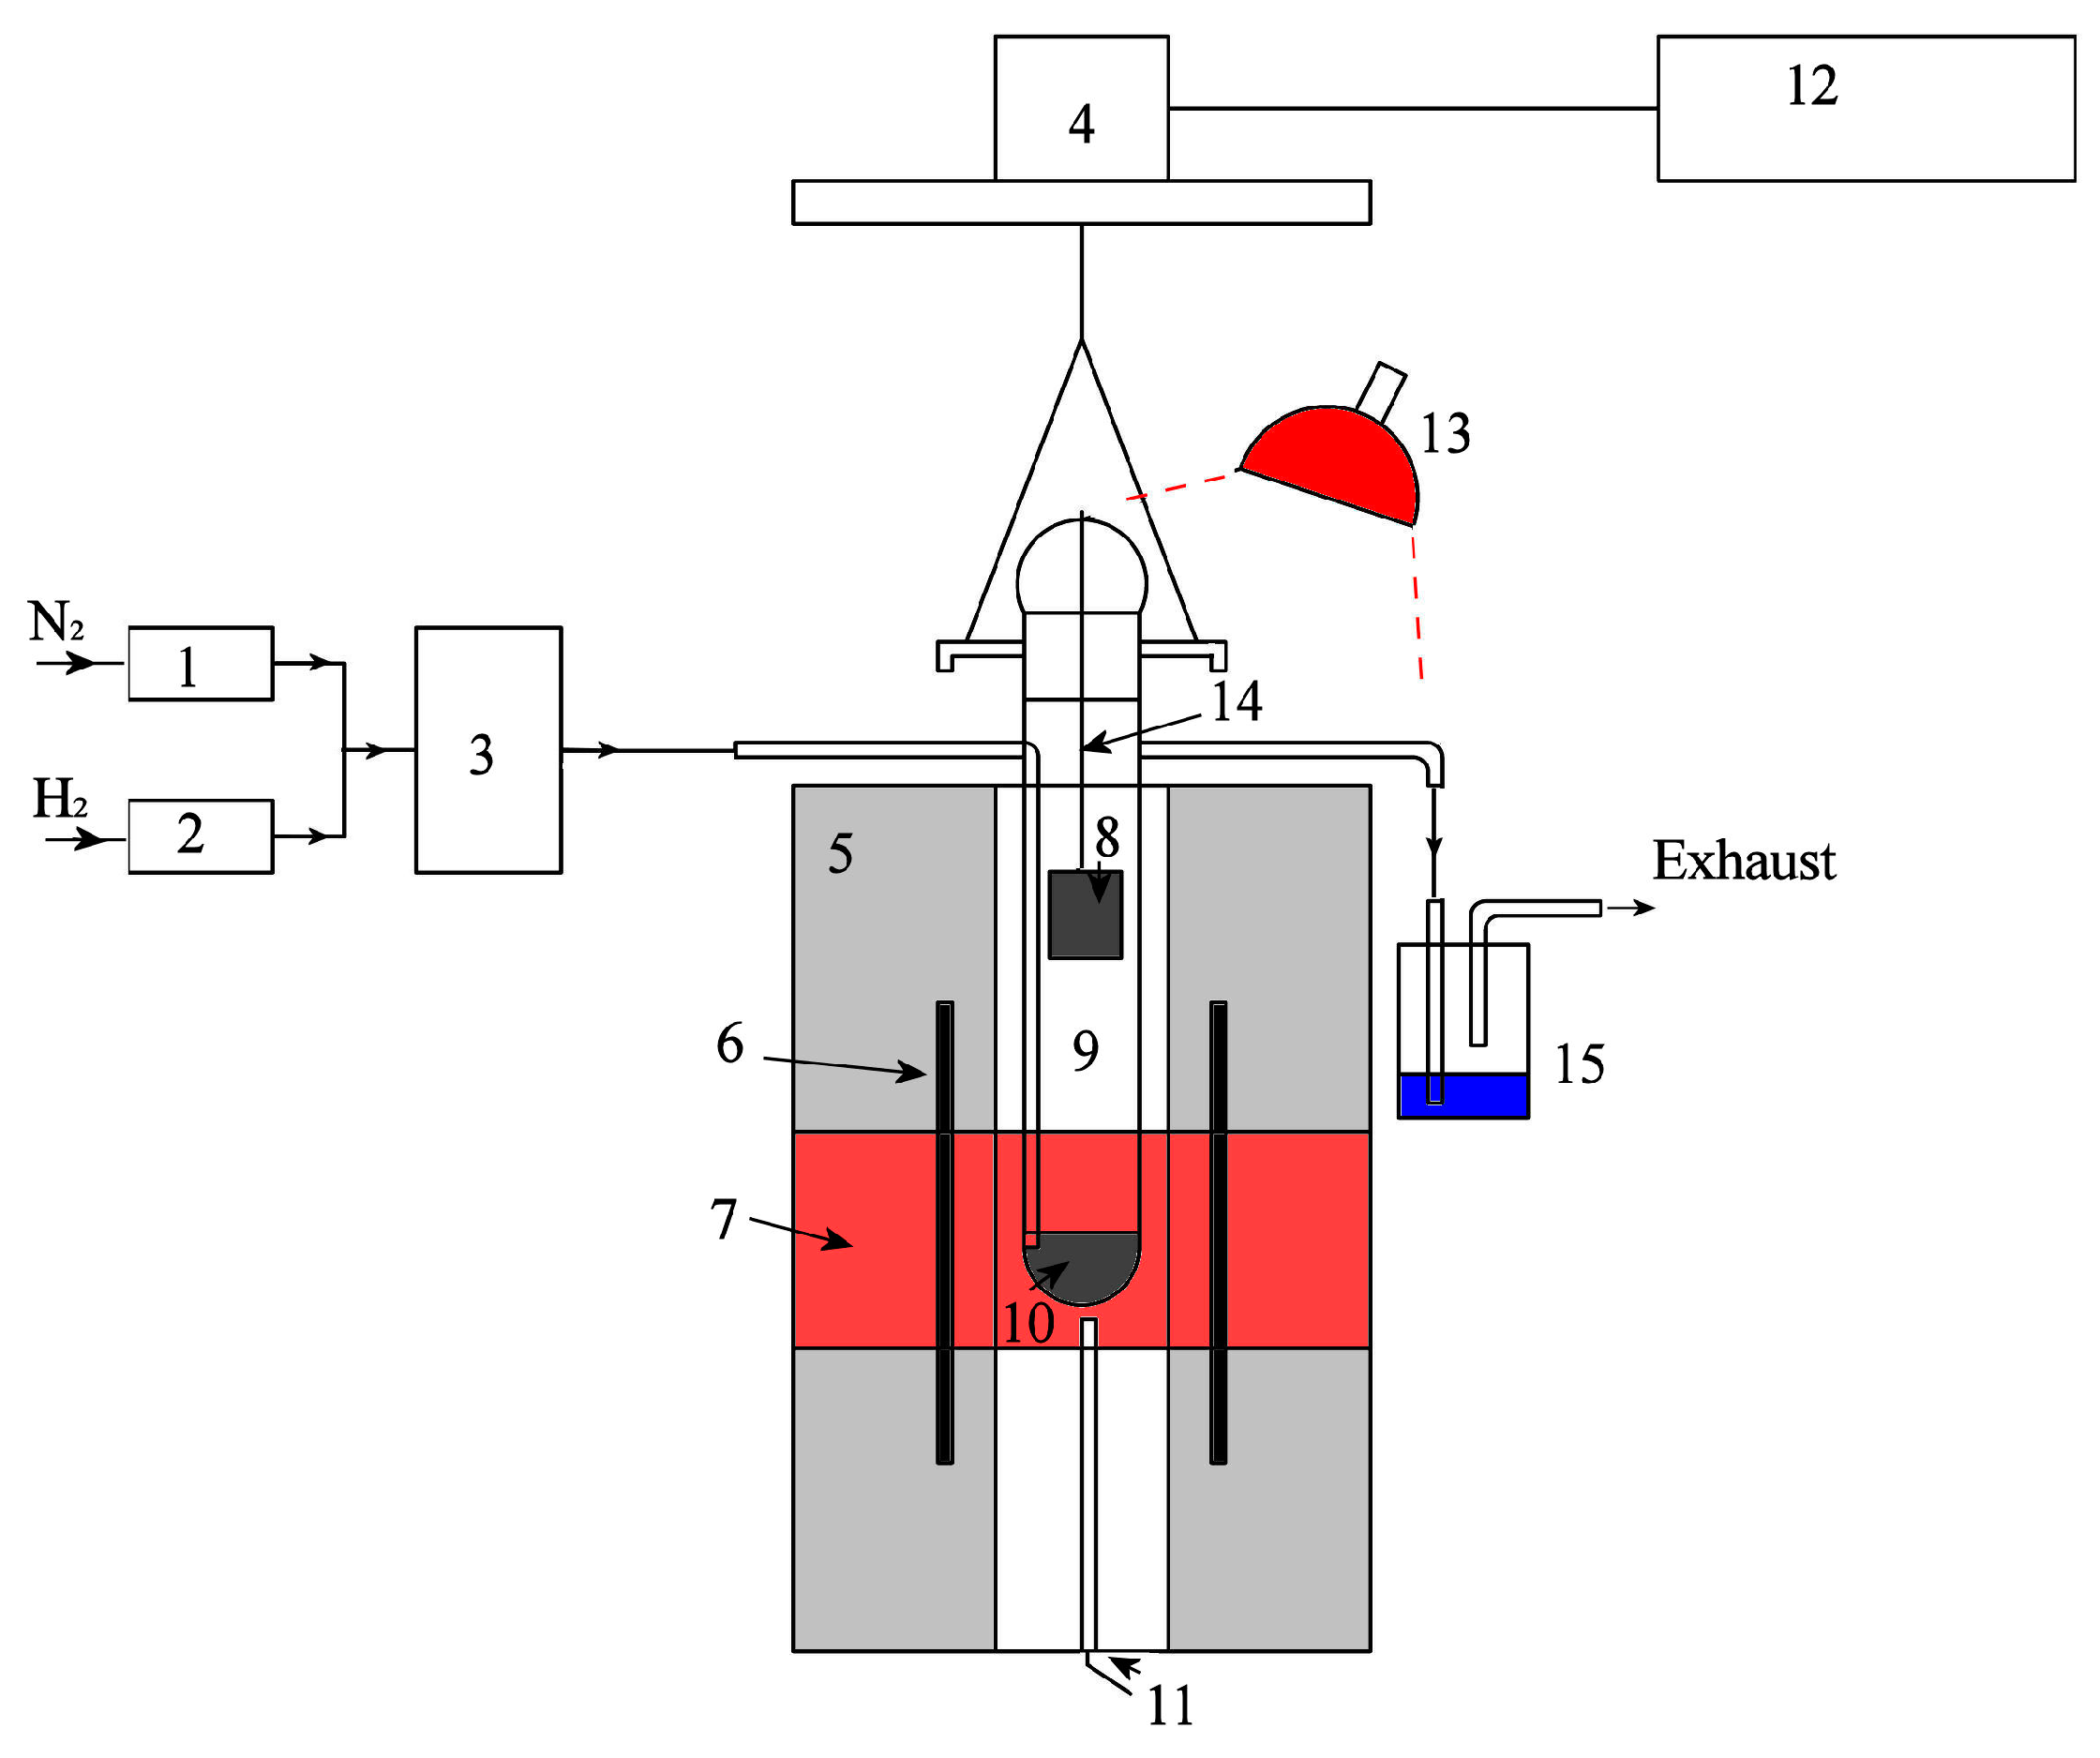
Figure 4.
Comparison between model-predicted and experimental mass-loss curves under different scenarios.
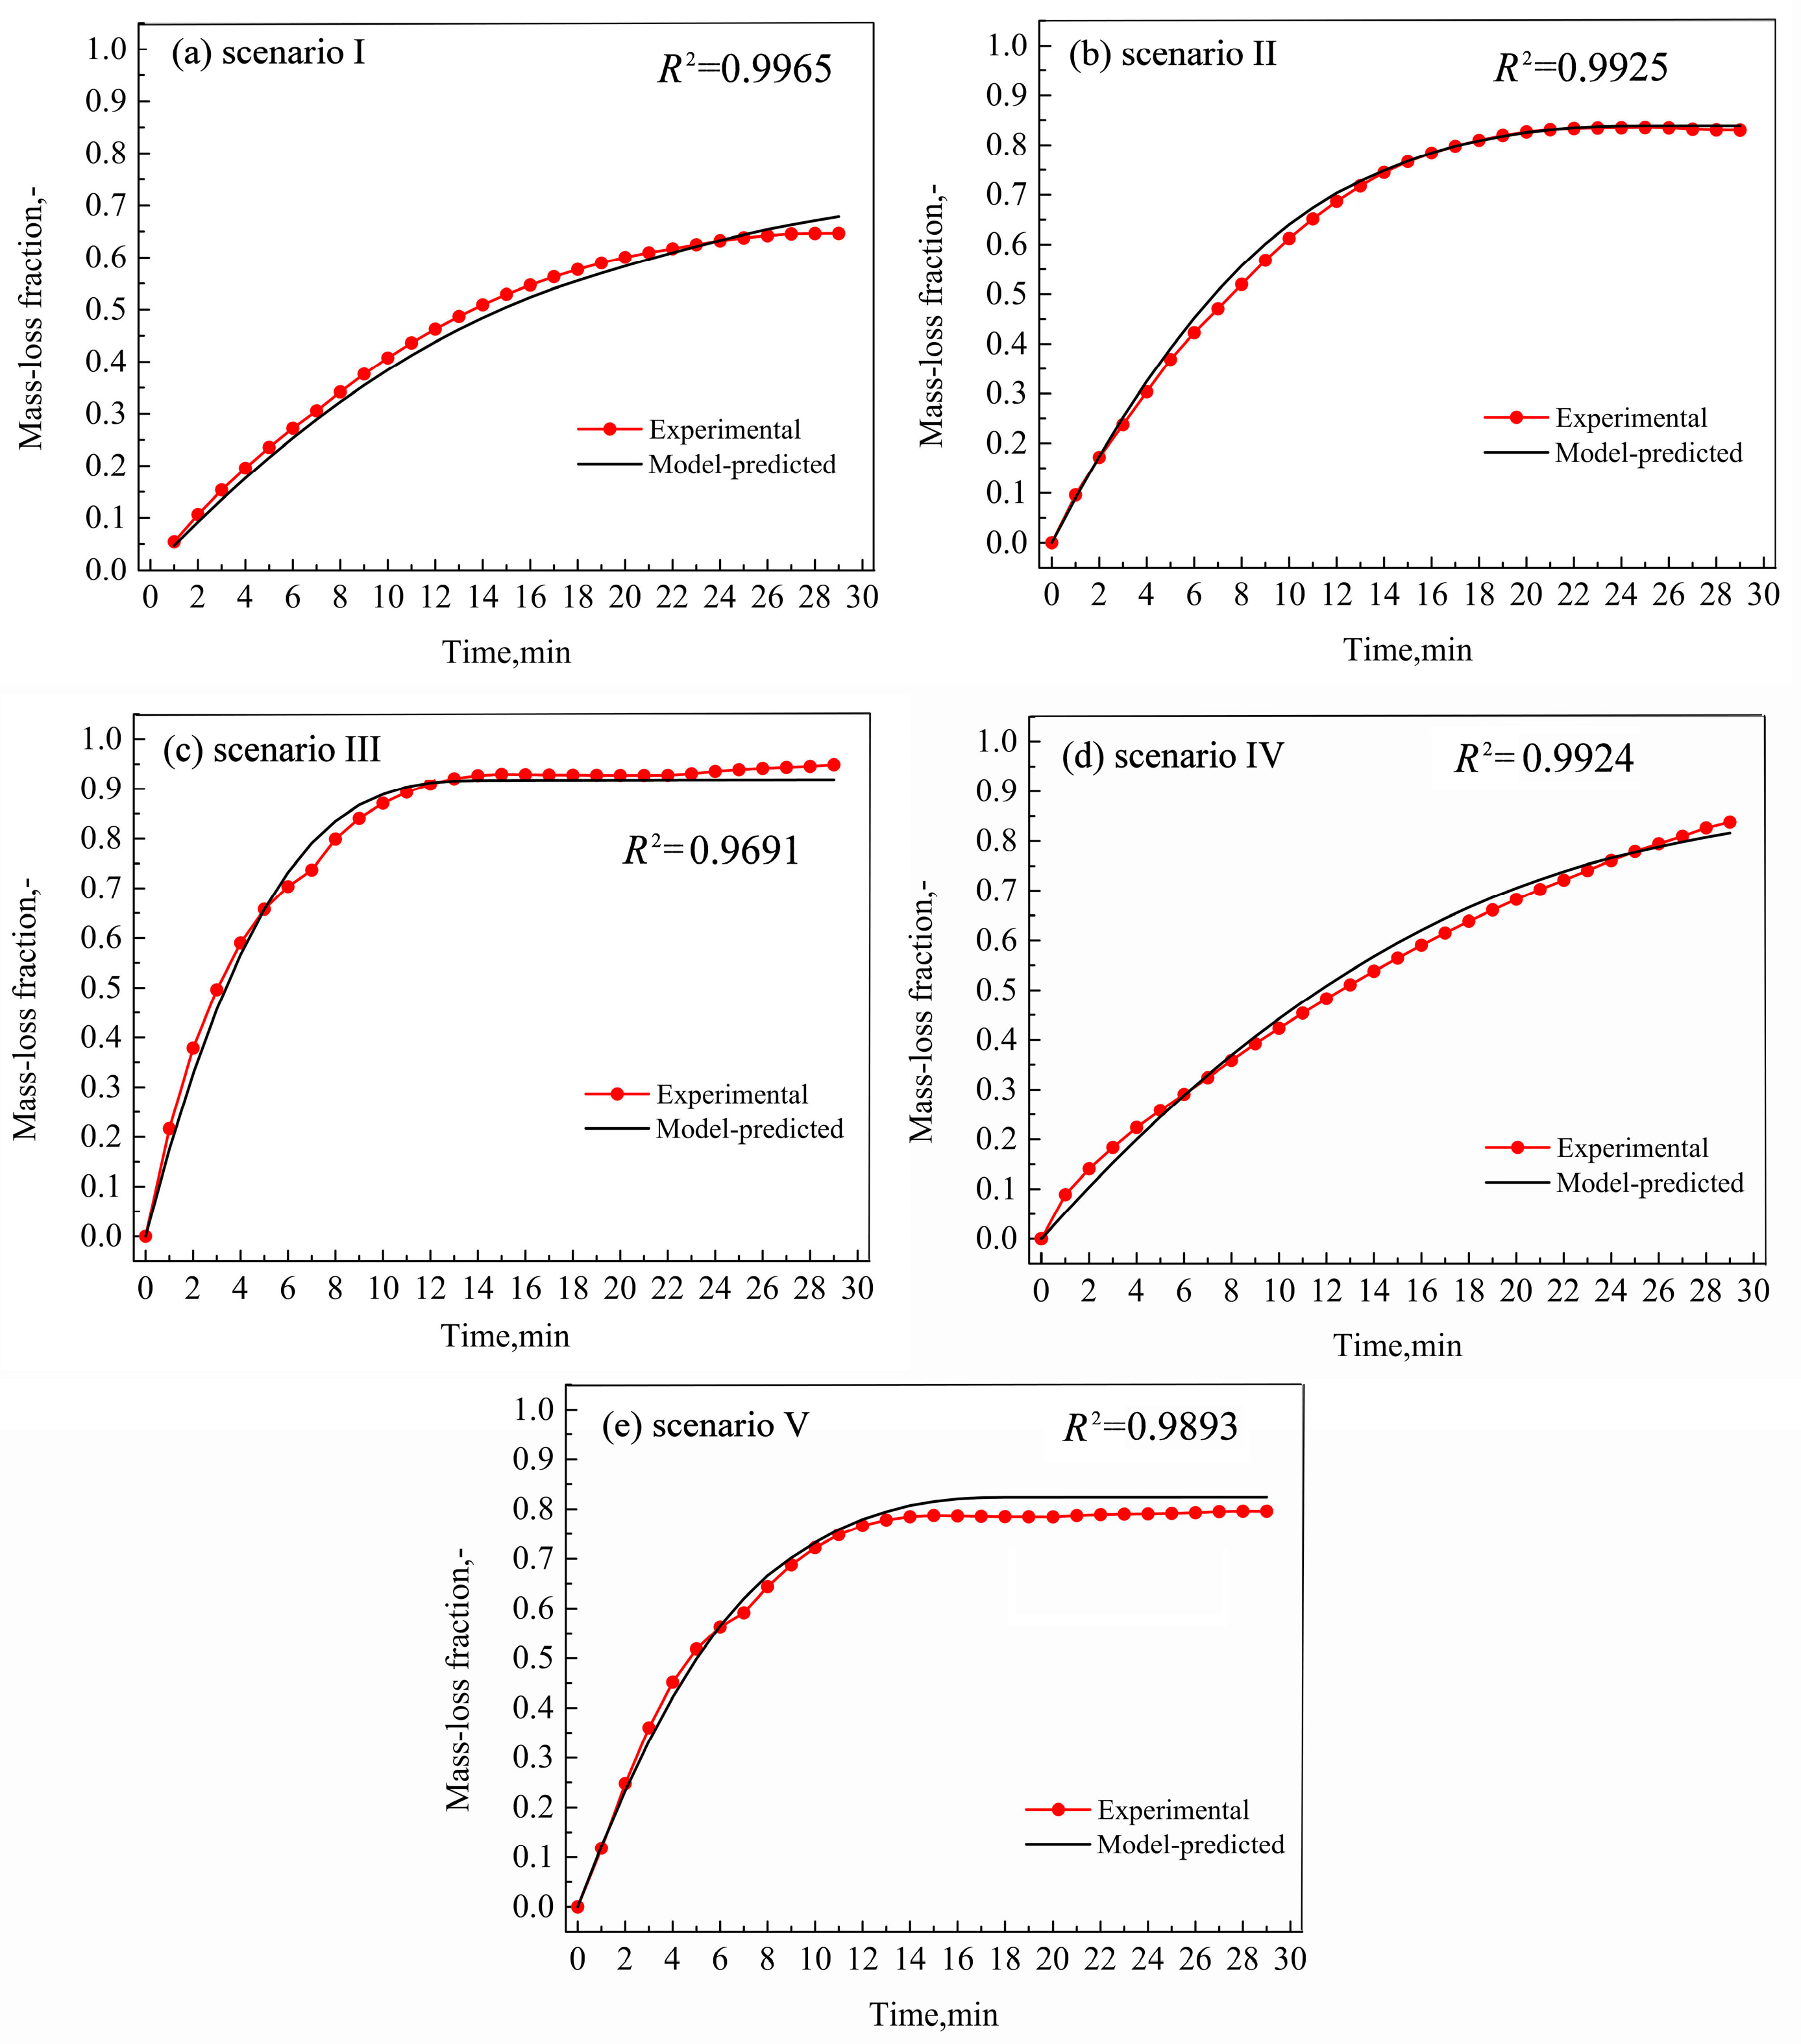
Figure 5.
Comparison between model-predicted and experimental final iron oxide reduction fractions and biochar gasification fractions under different scenarios.
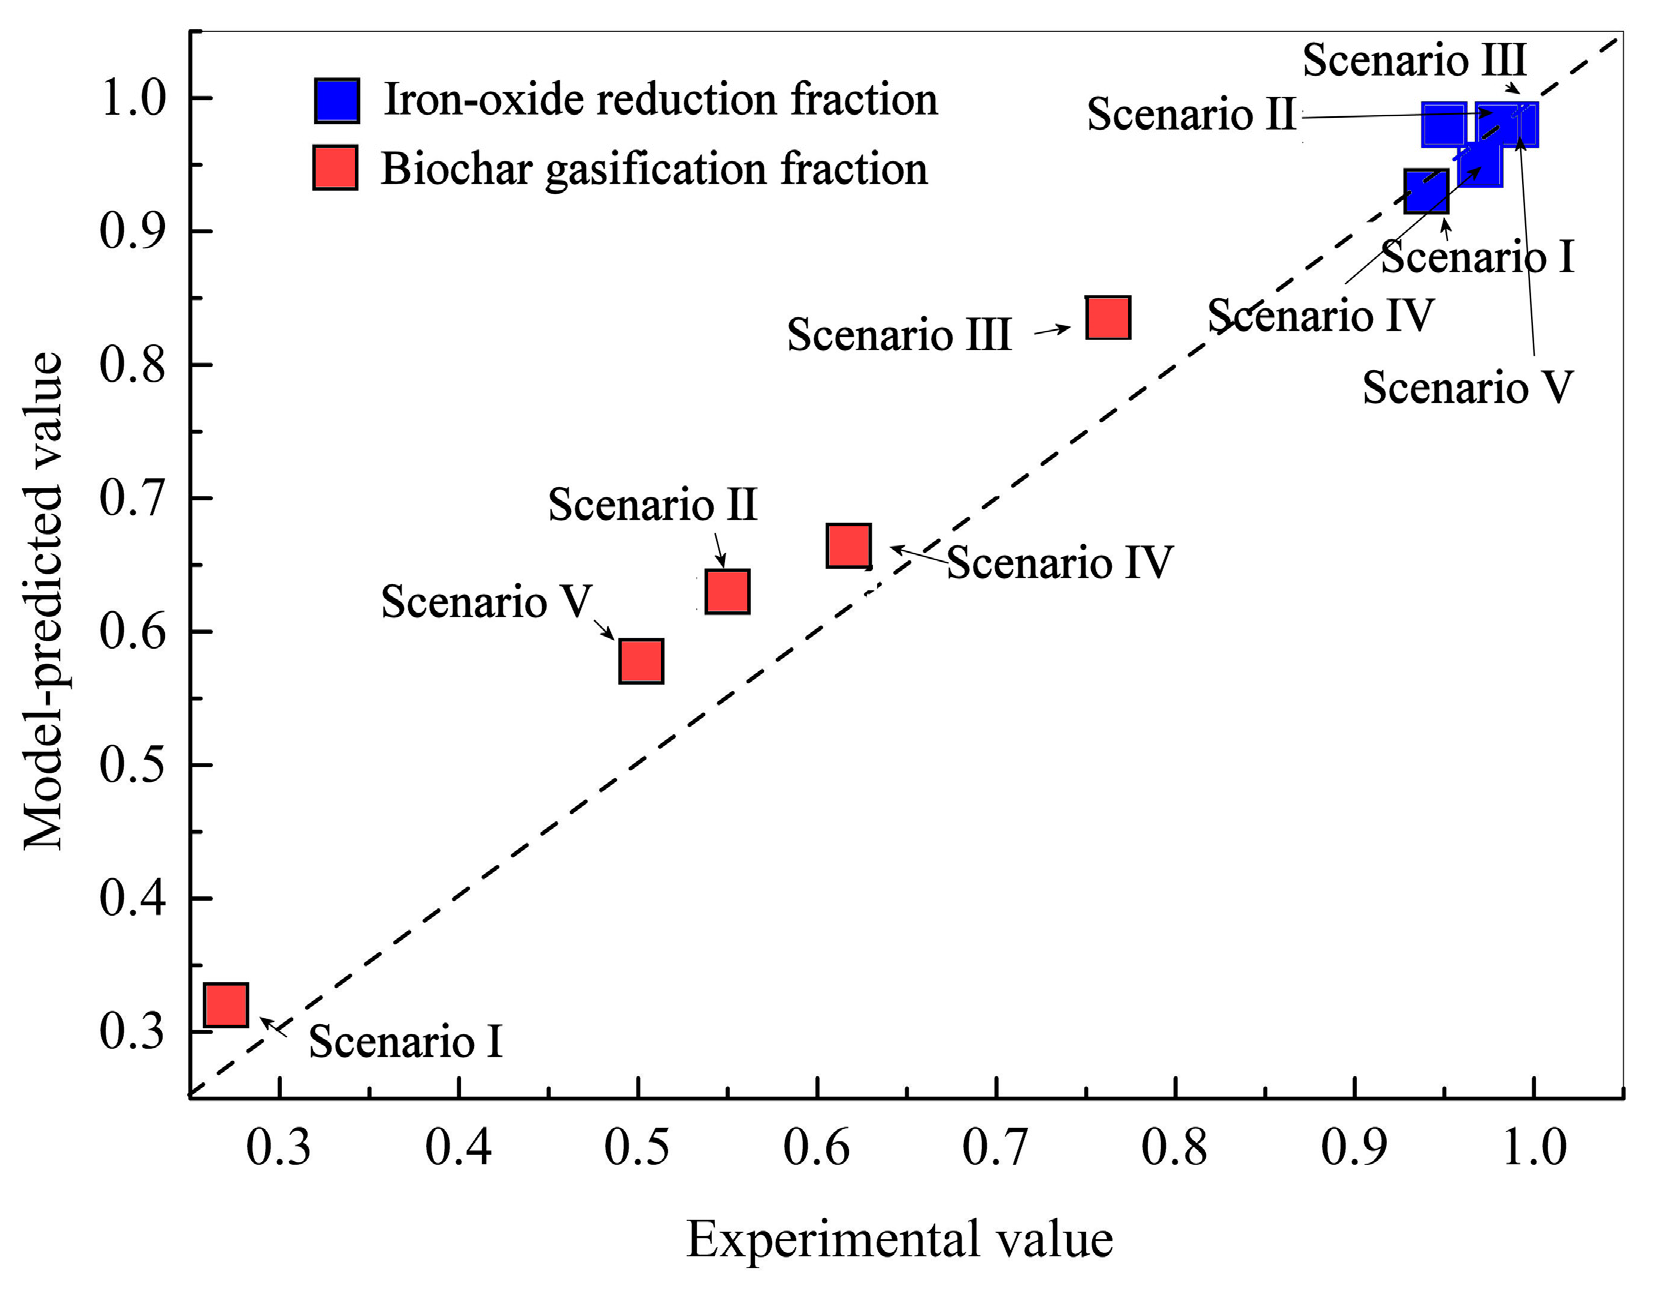
Figure 6.
Influence of temperature on iron oxide reduction (a) and biochar gasification (b) in BCB reaction.
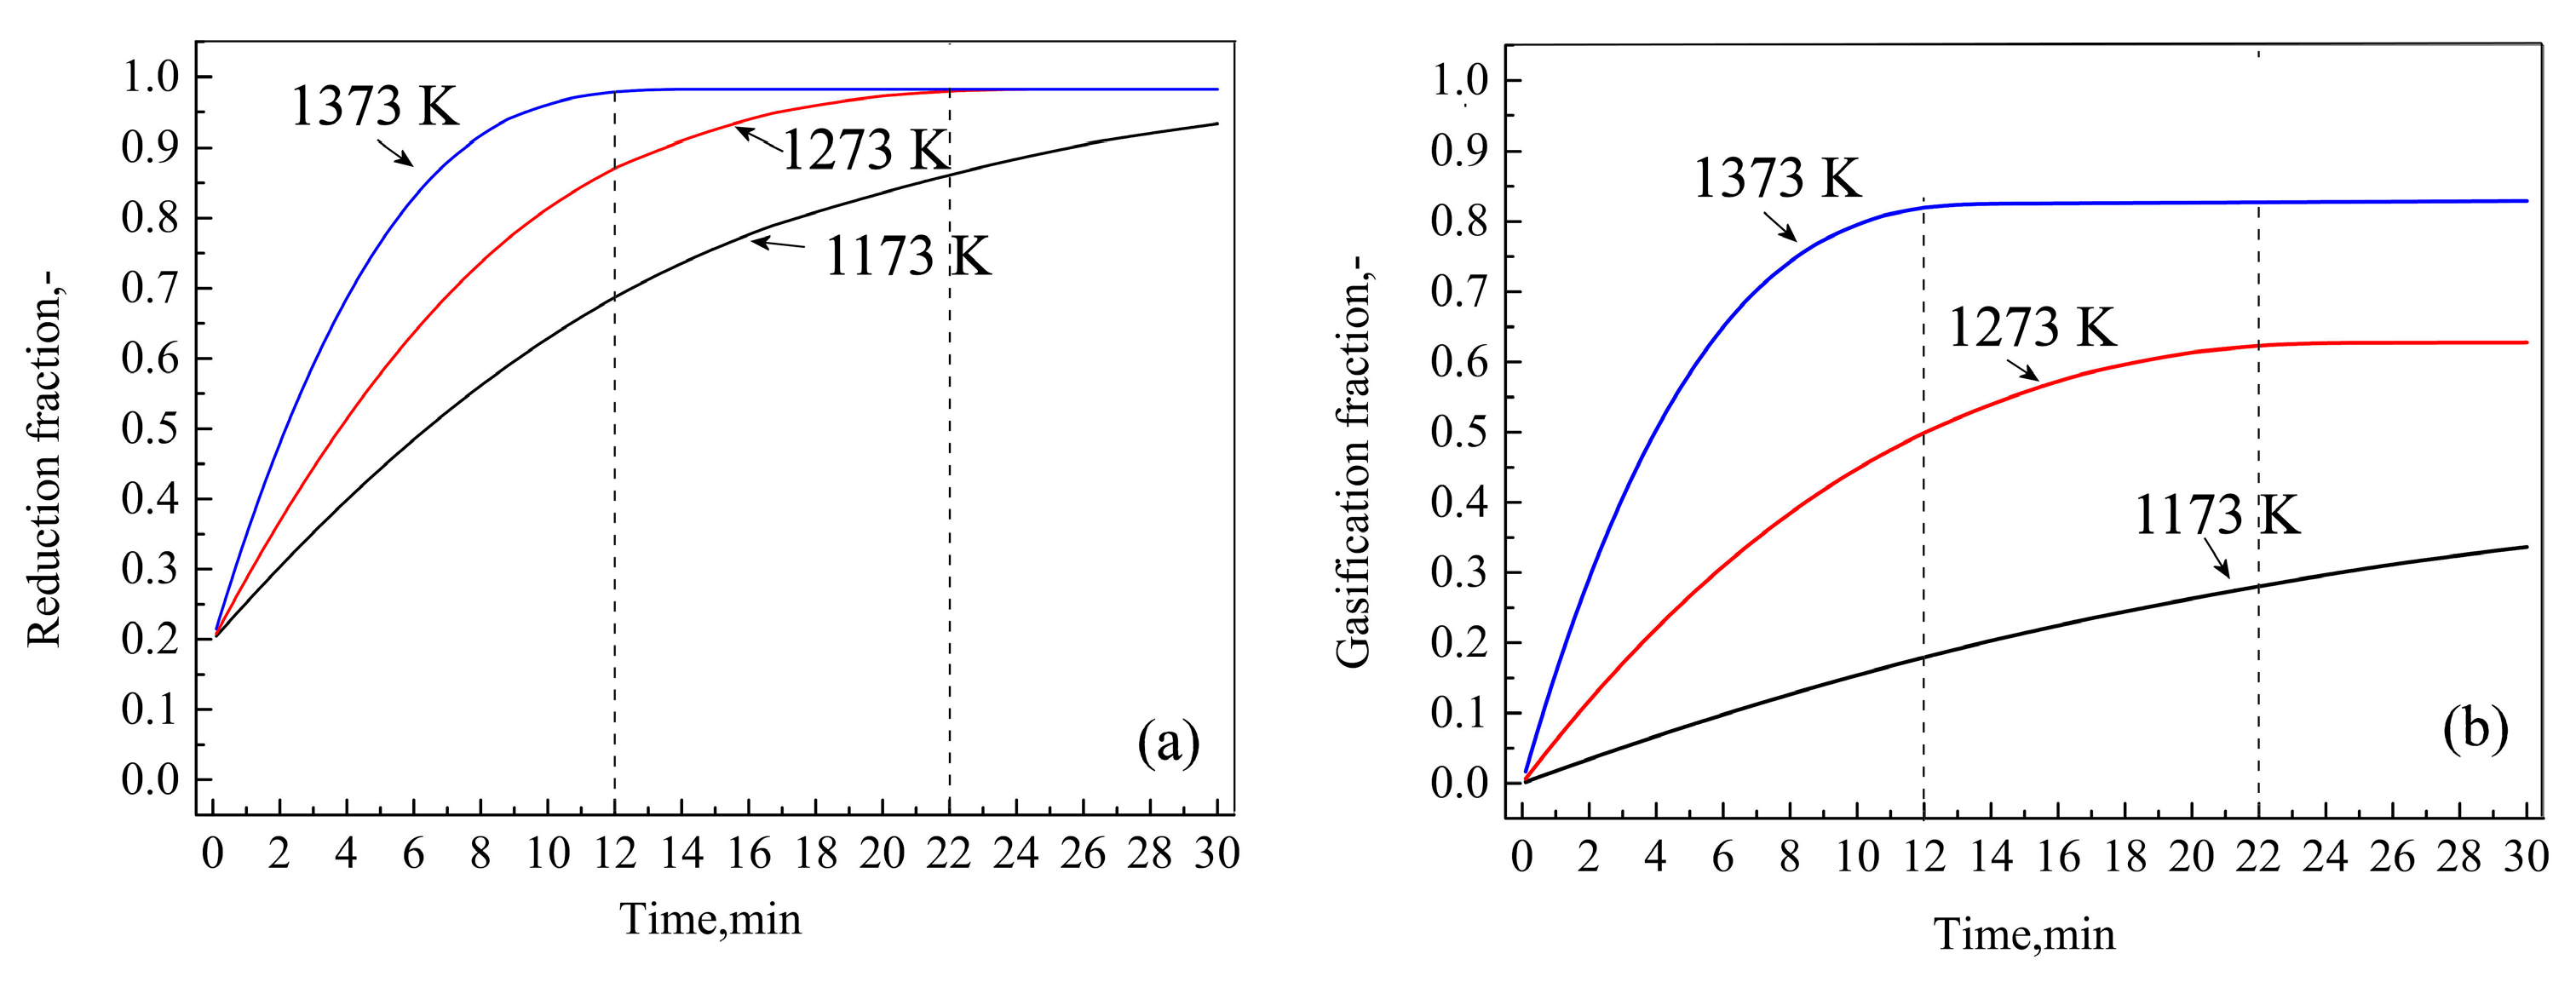
Figure 7.
Changes in gas generating rates of H2, H2O, CO, and CO2 with time under different temperatures.
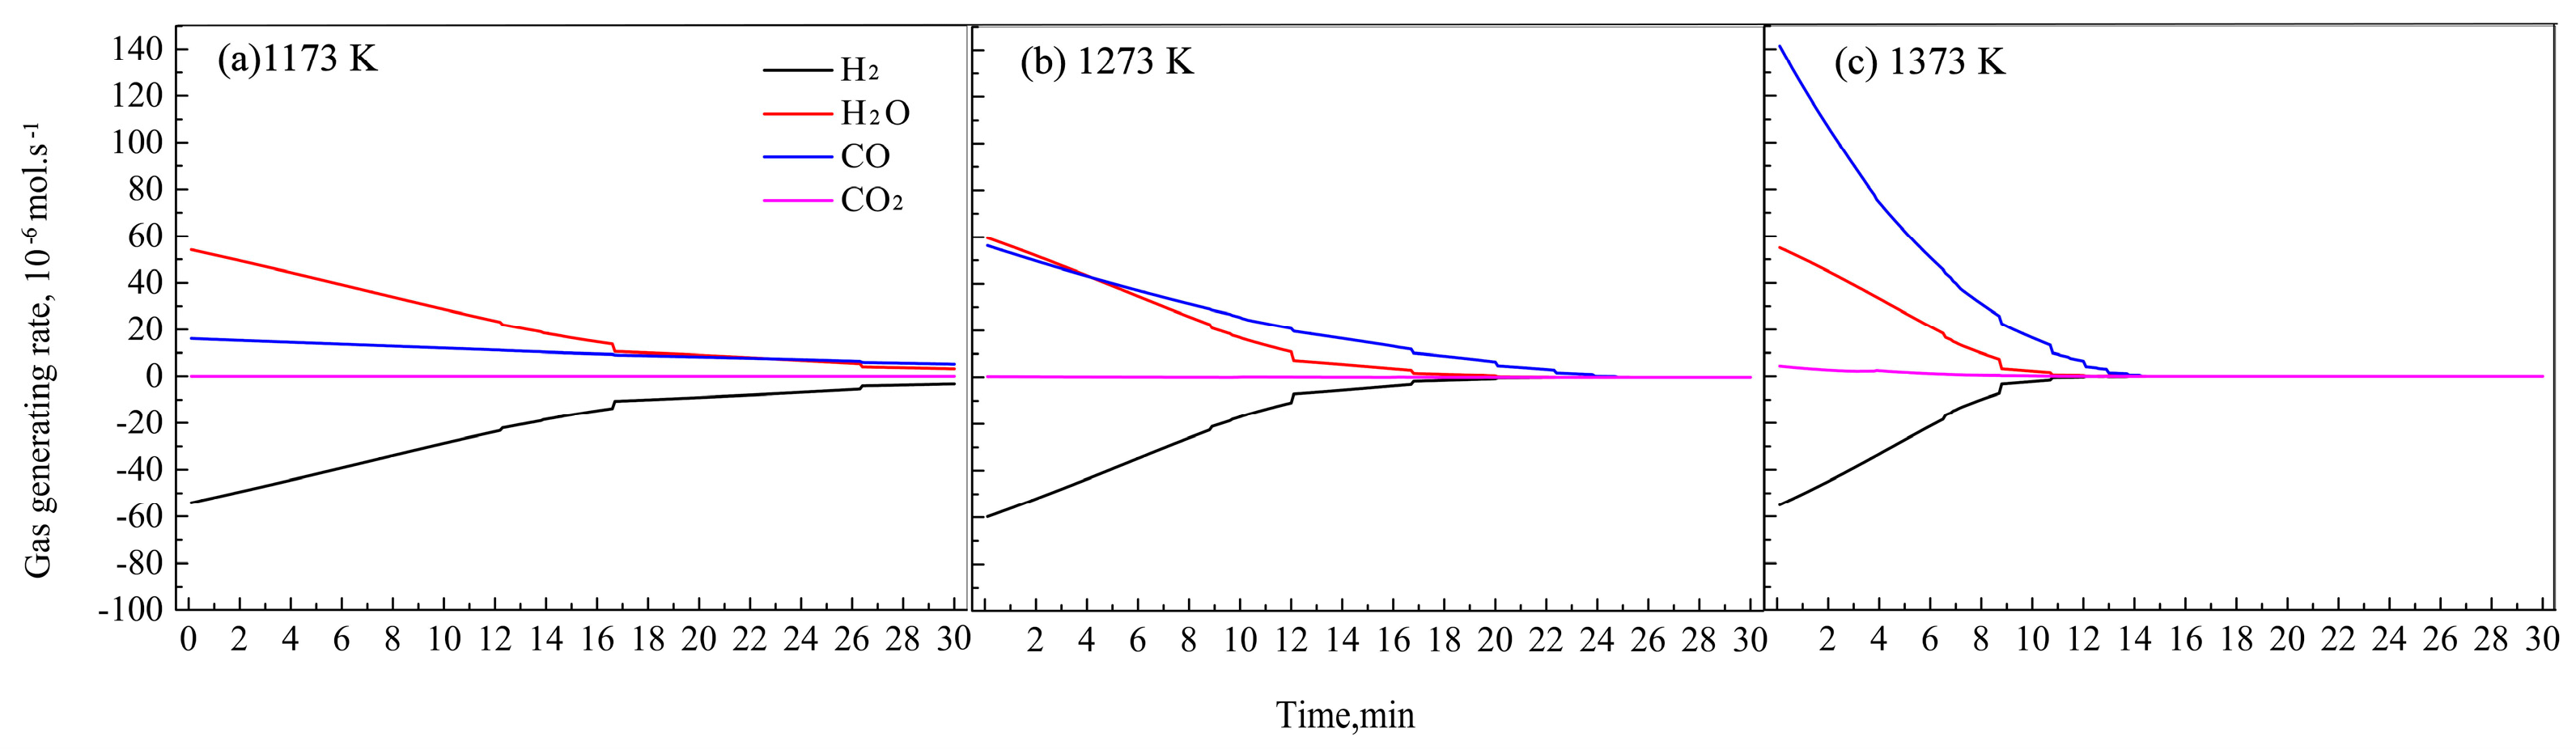
Figure 8.
Influences of H2 content in the atmosphere on iron oxide reduction (a) and biochar gasification (b) in the BCB reaction.

Figure 9.
Changes of gas generation rates of H2, CO, CO2, and H2O with time under different atmospheres.
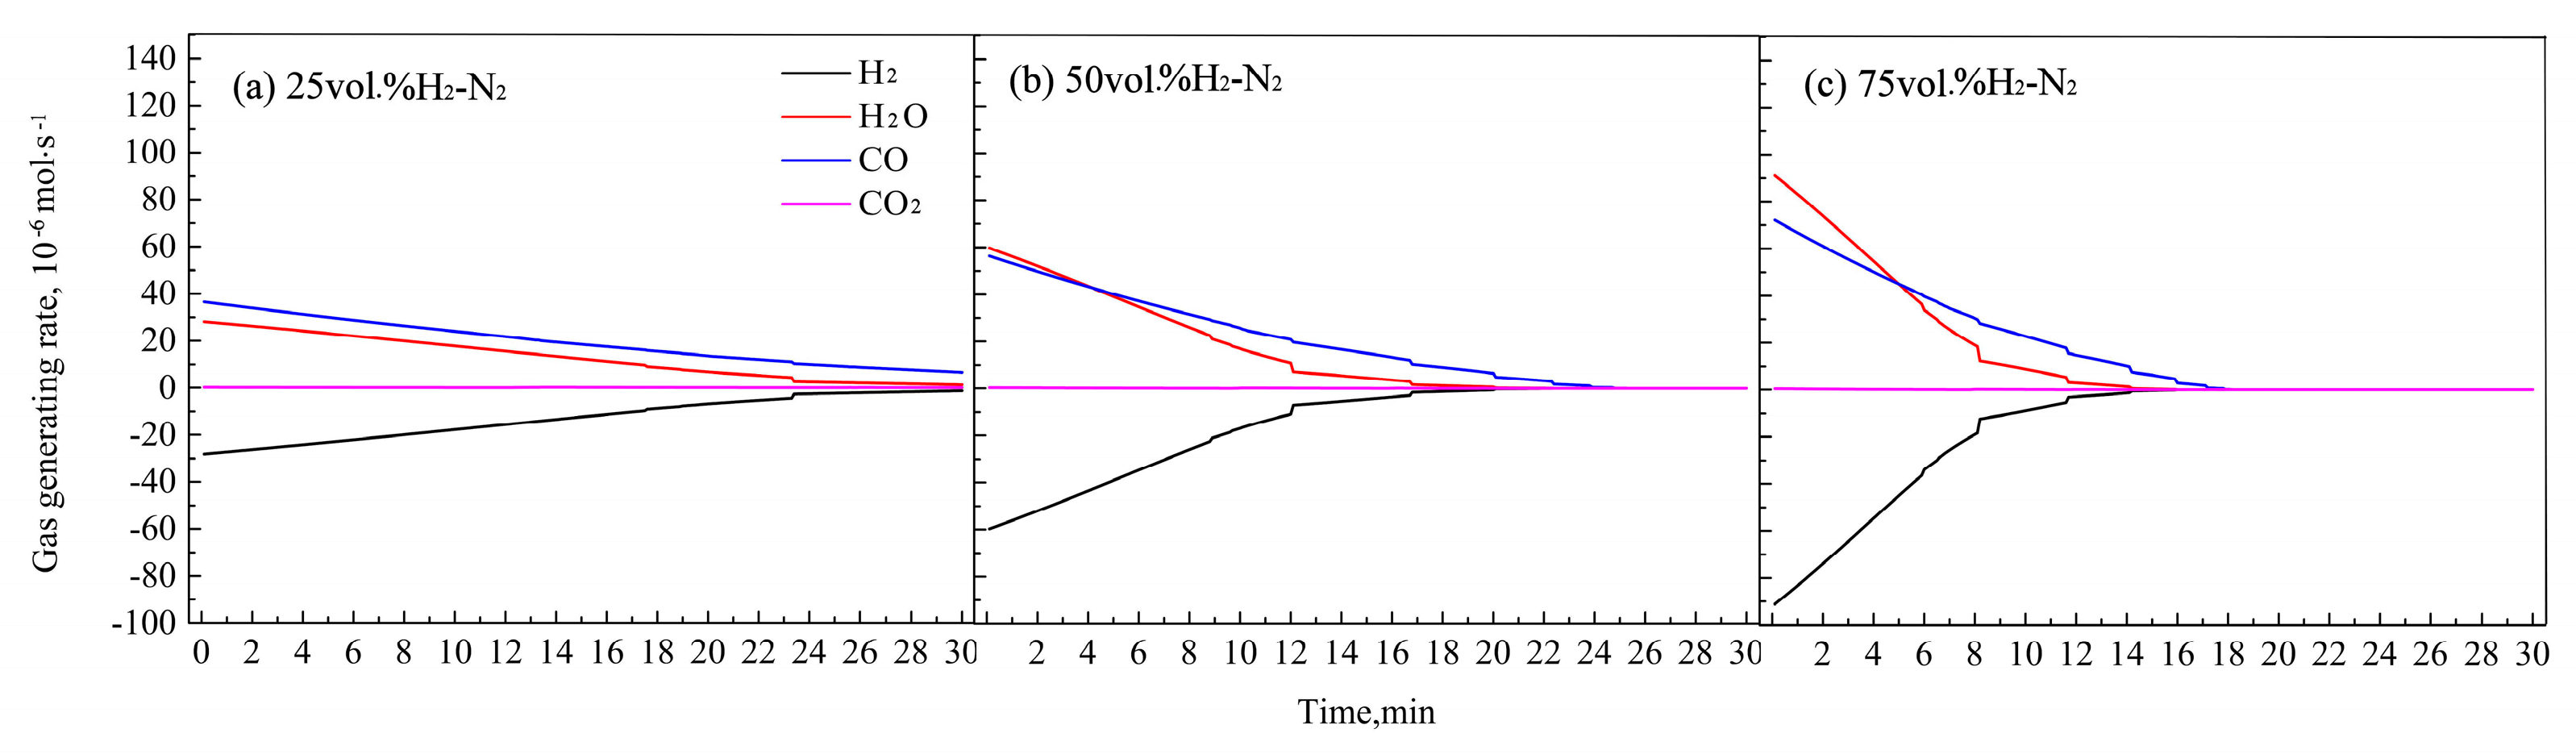
Figure 10.
Changes of radial distribution of local reduction fraction (a) and local gasification fraction (b) with time under scenario II.
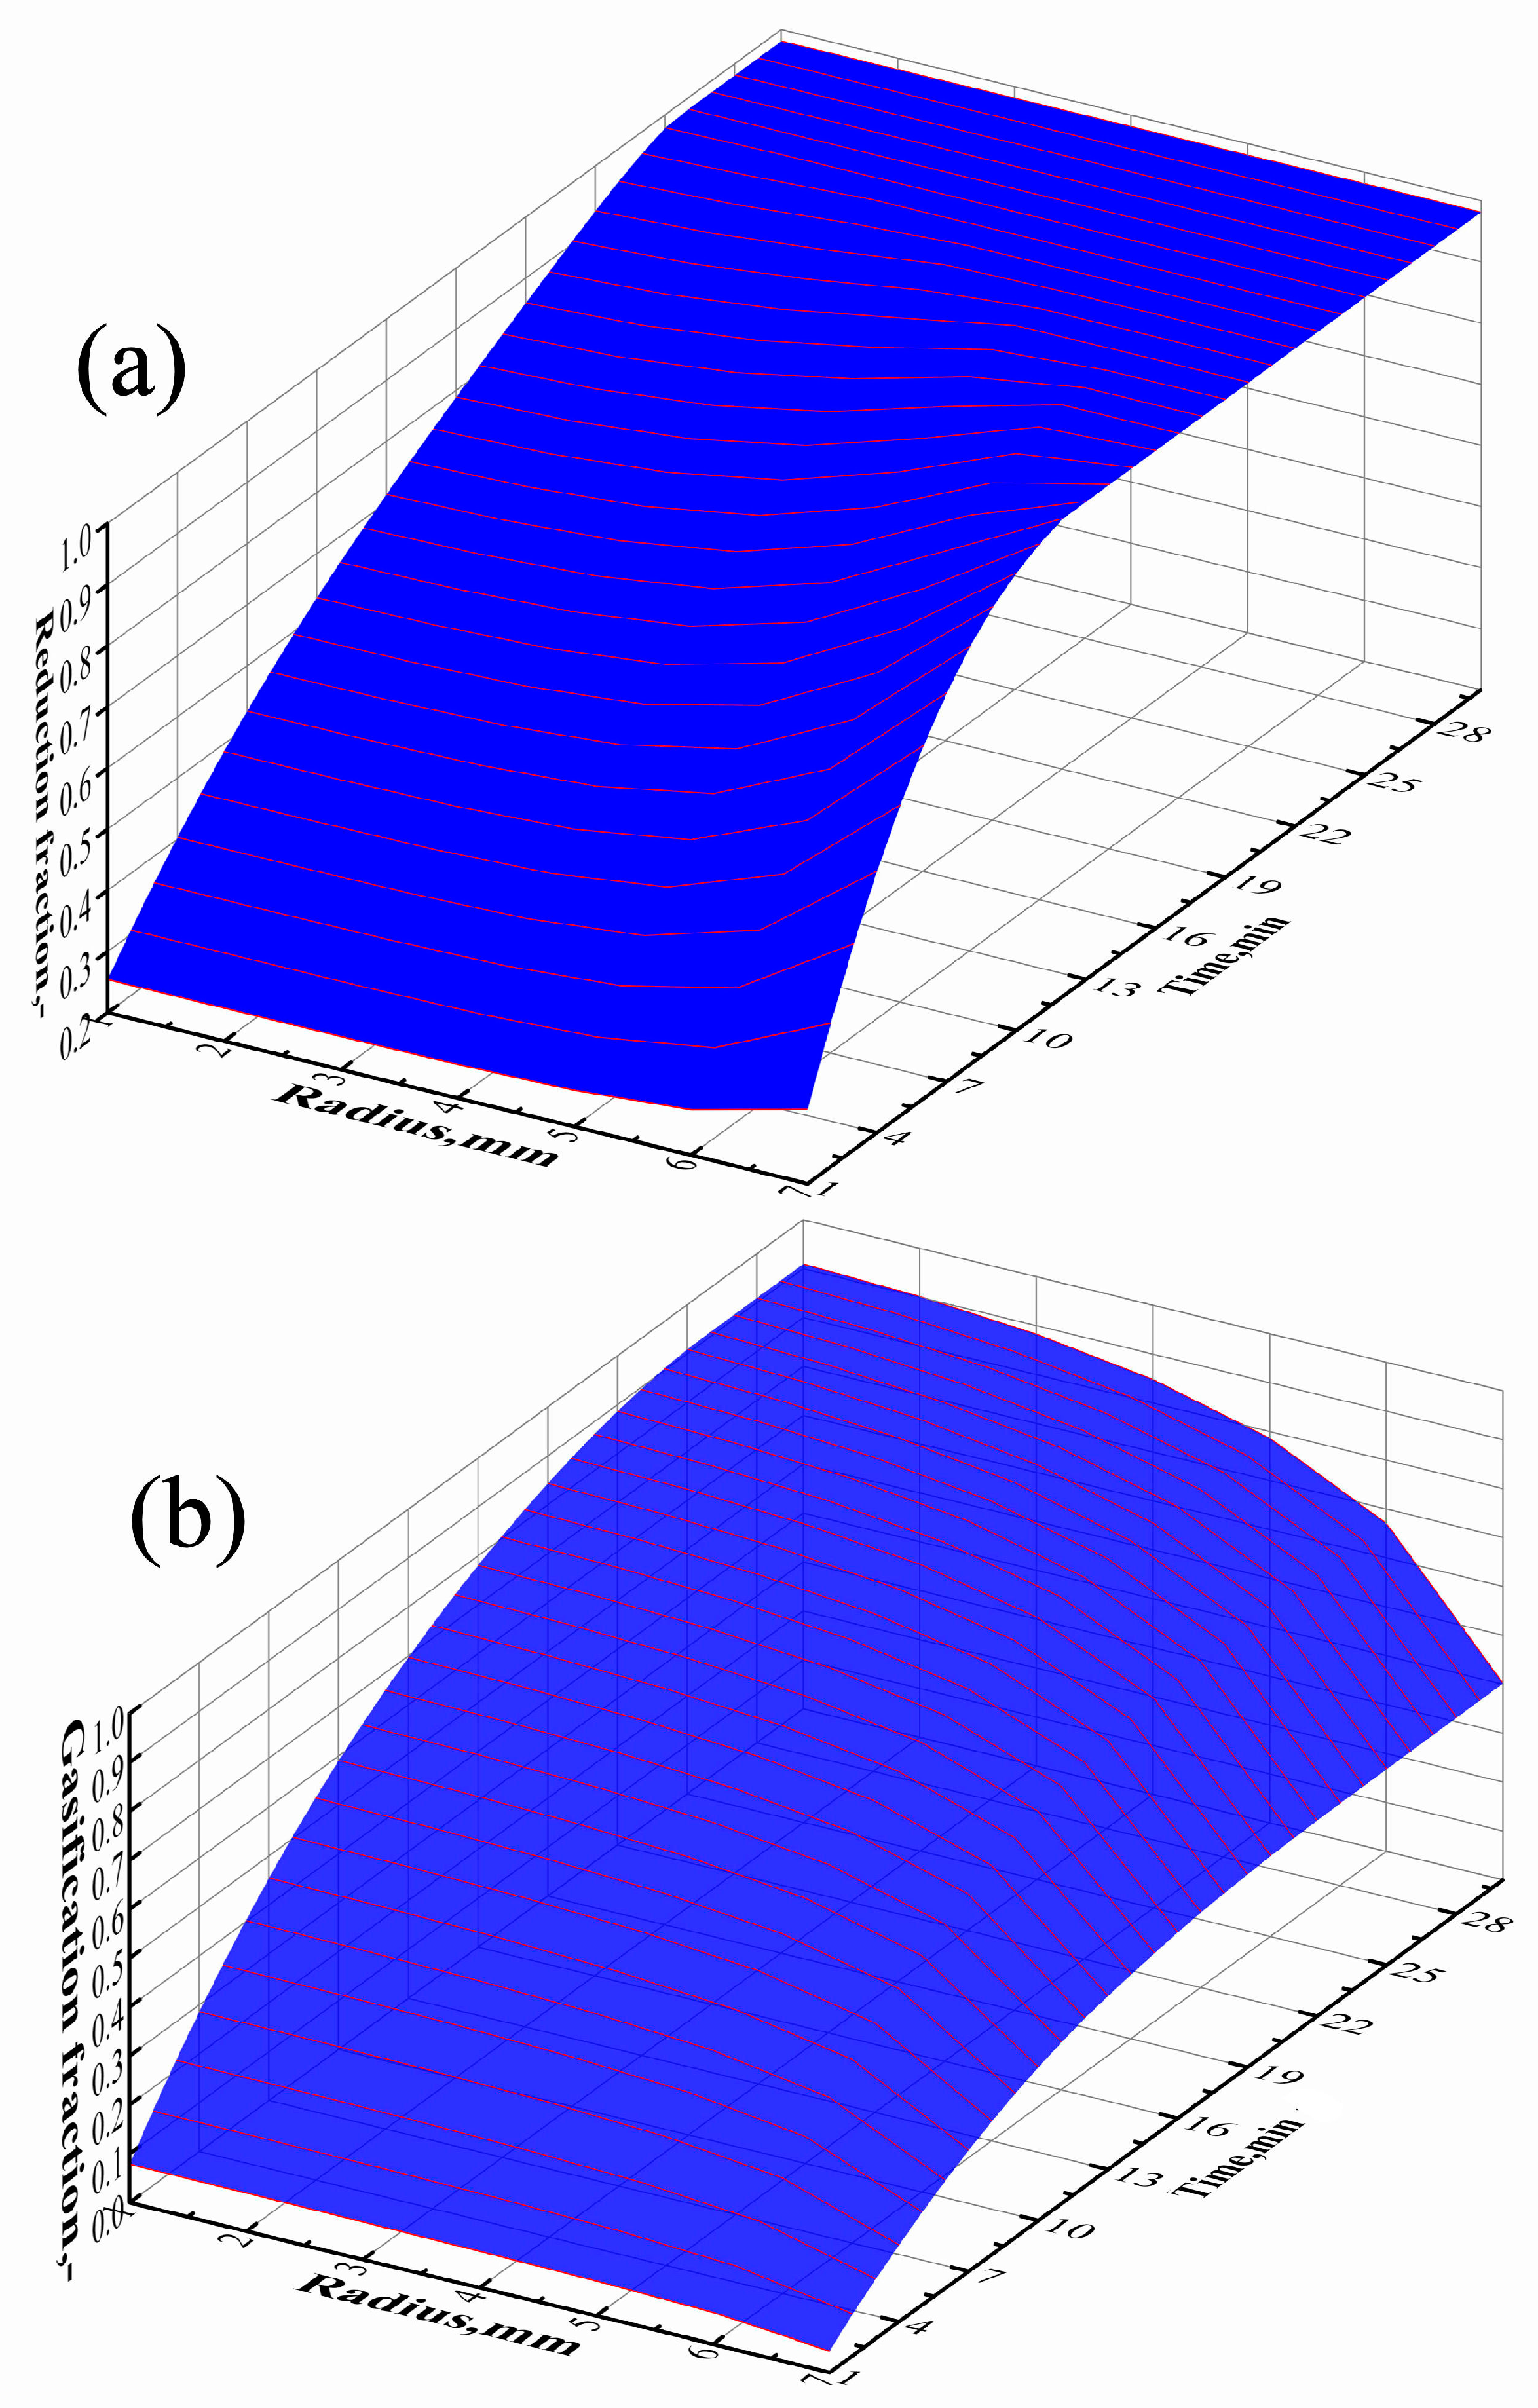
Figure 11.
XRD patterns at different times under scenario II: (a) 0 min, (b) 10 min, (c) 20 min, and (d) 30 min.
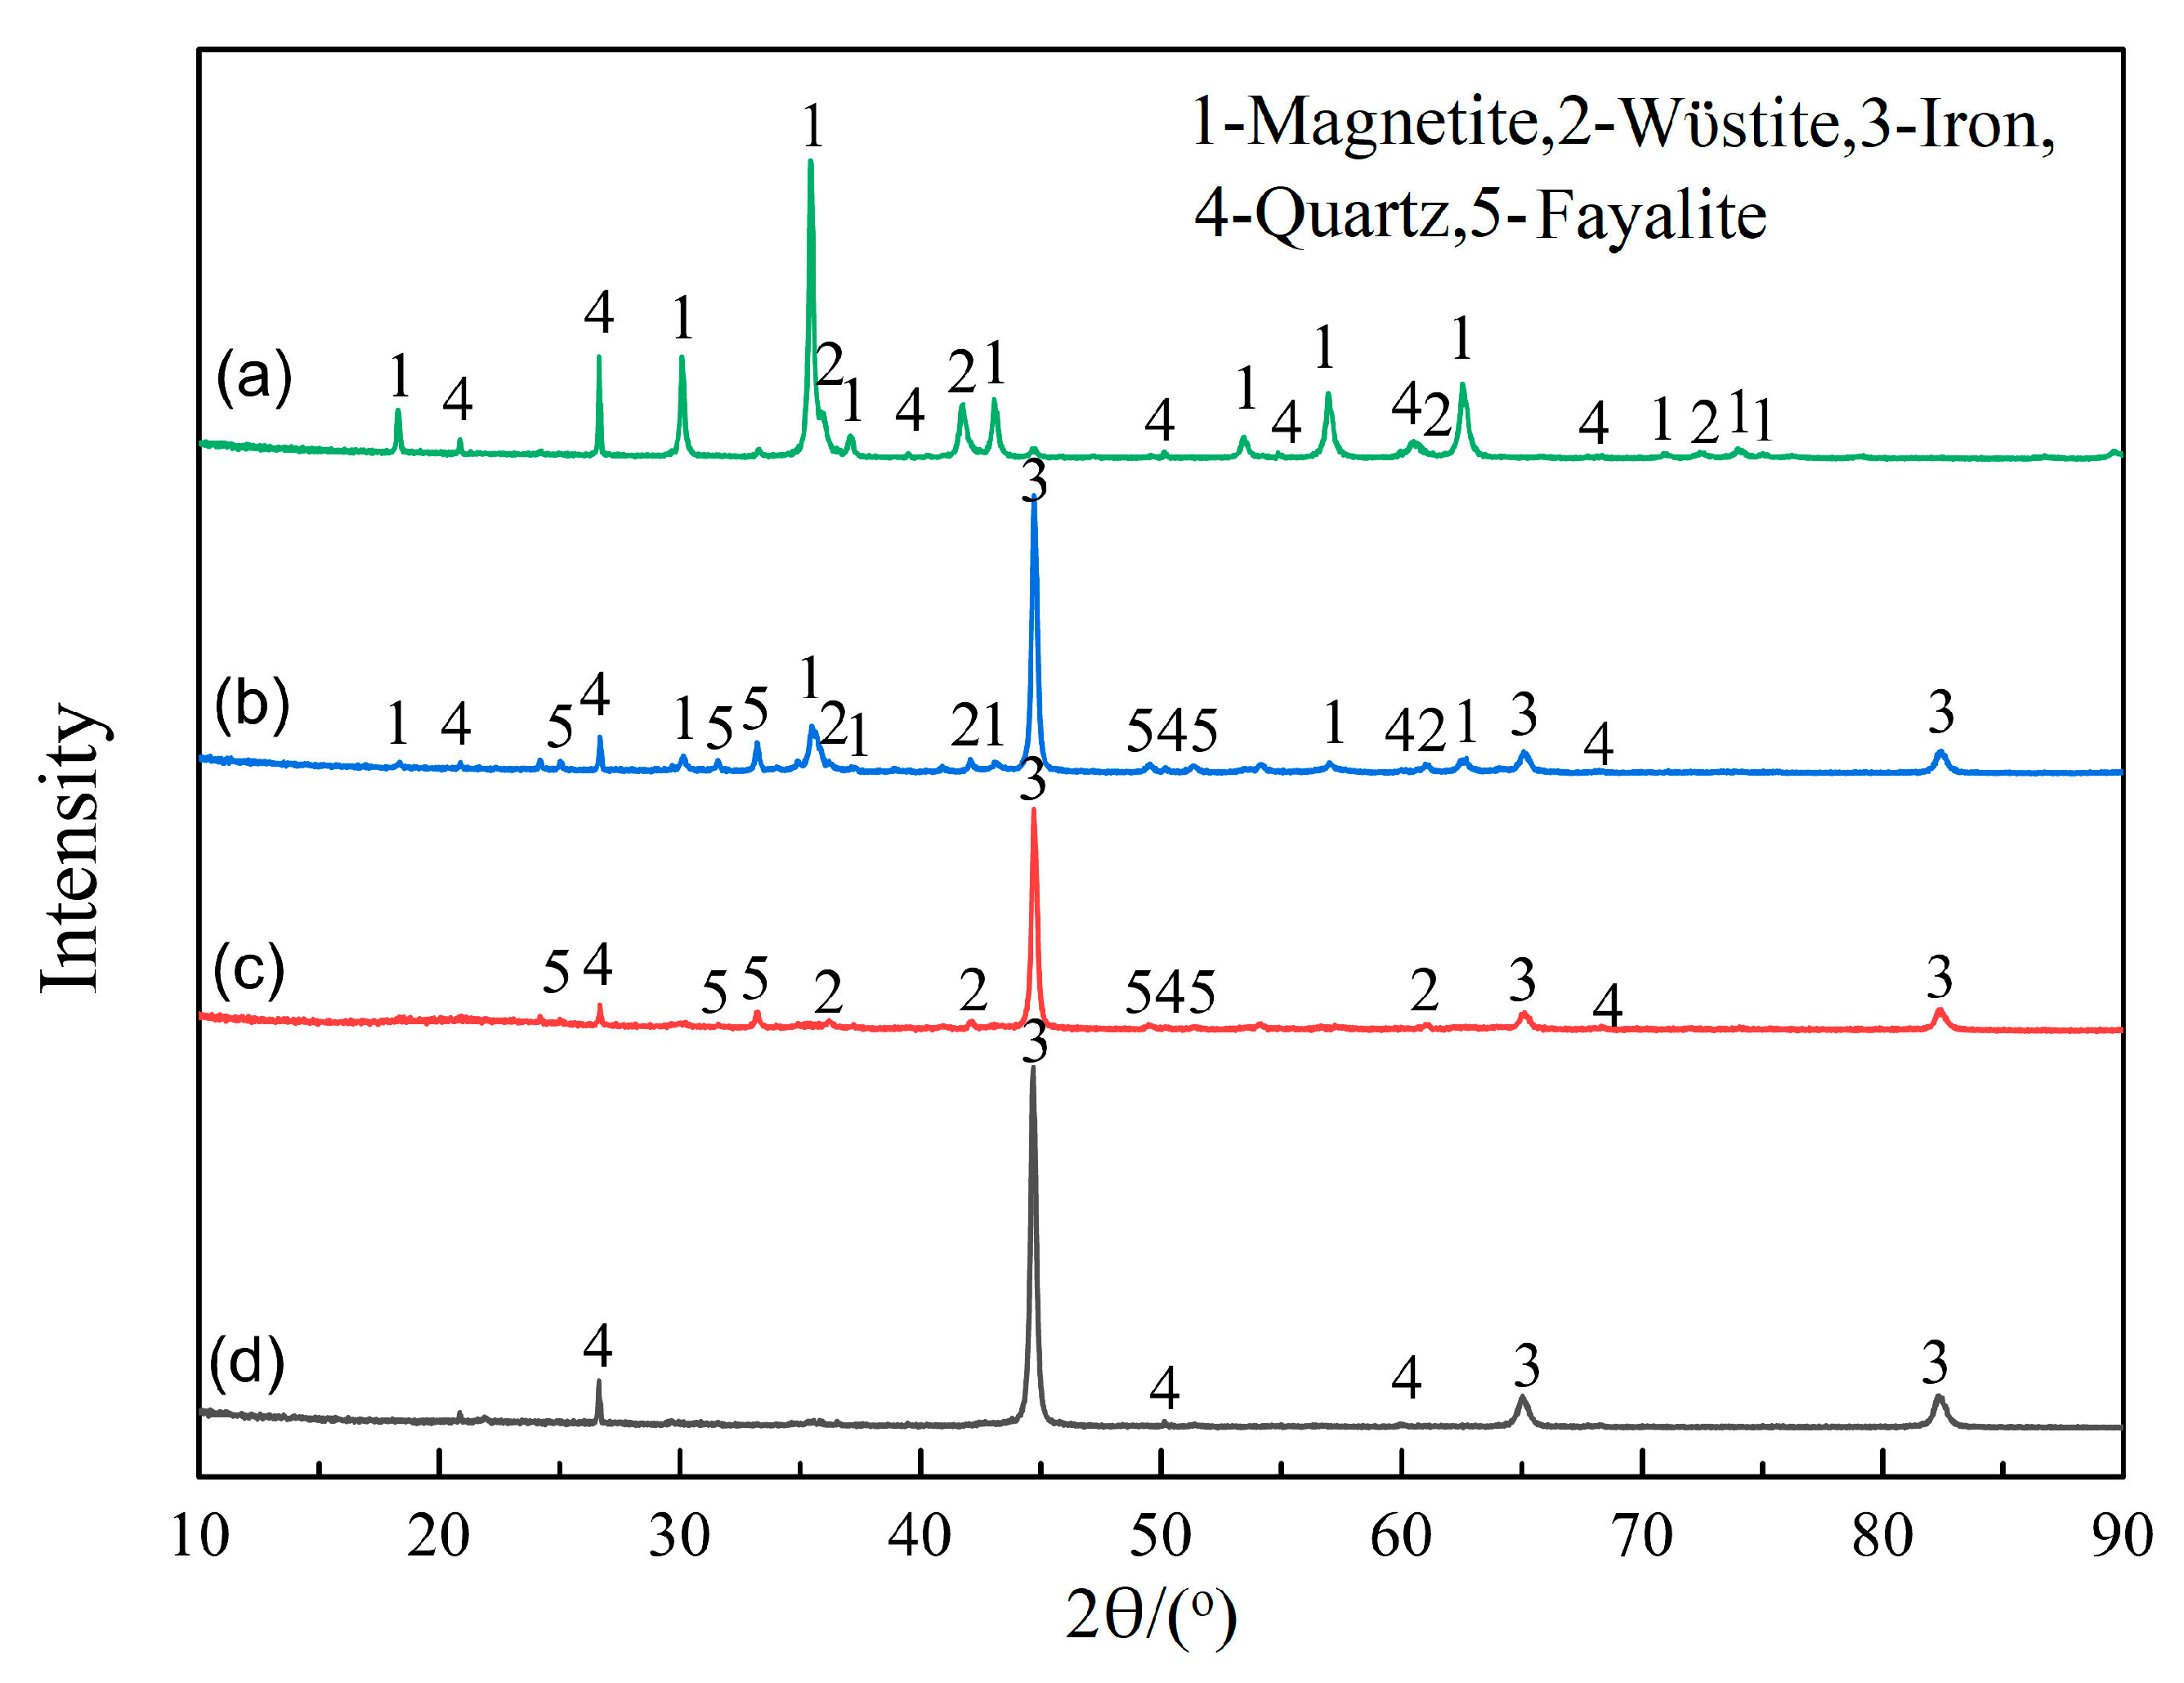
Figure 12.
SEM images near the BCB center at different reaction times under scenario II: (a) 0 min, (b) 10 min, (c) 20 min, and (d) 30 min.
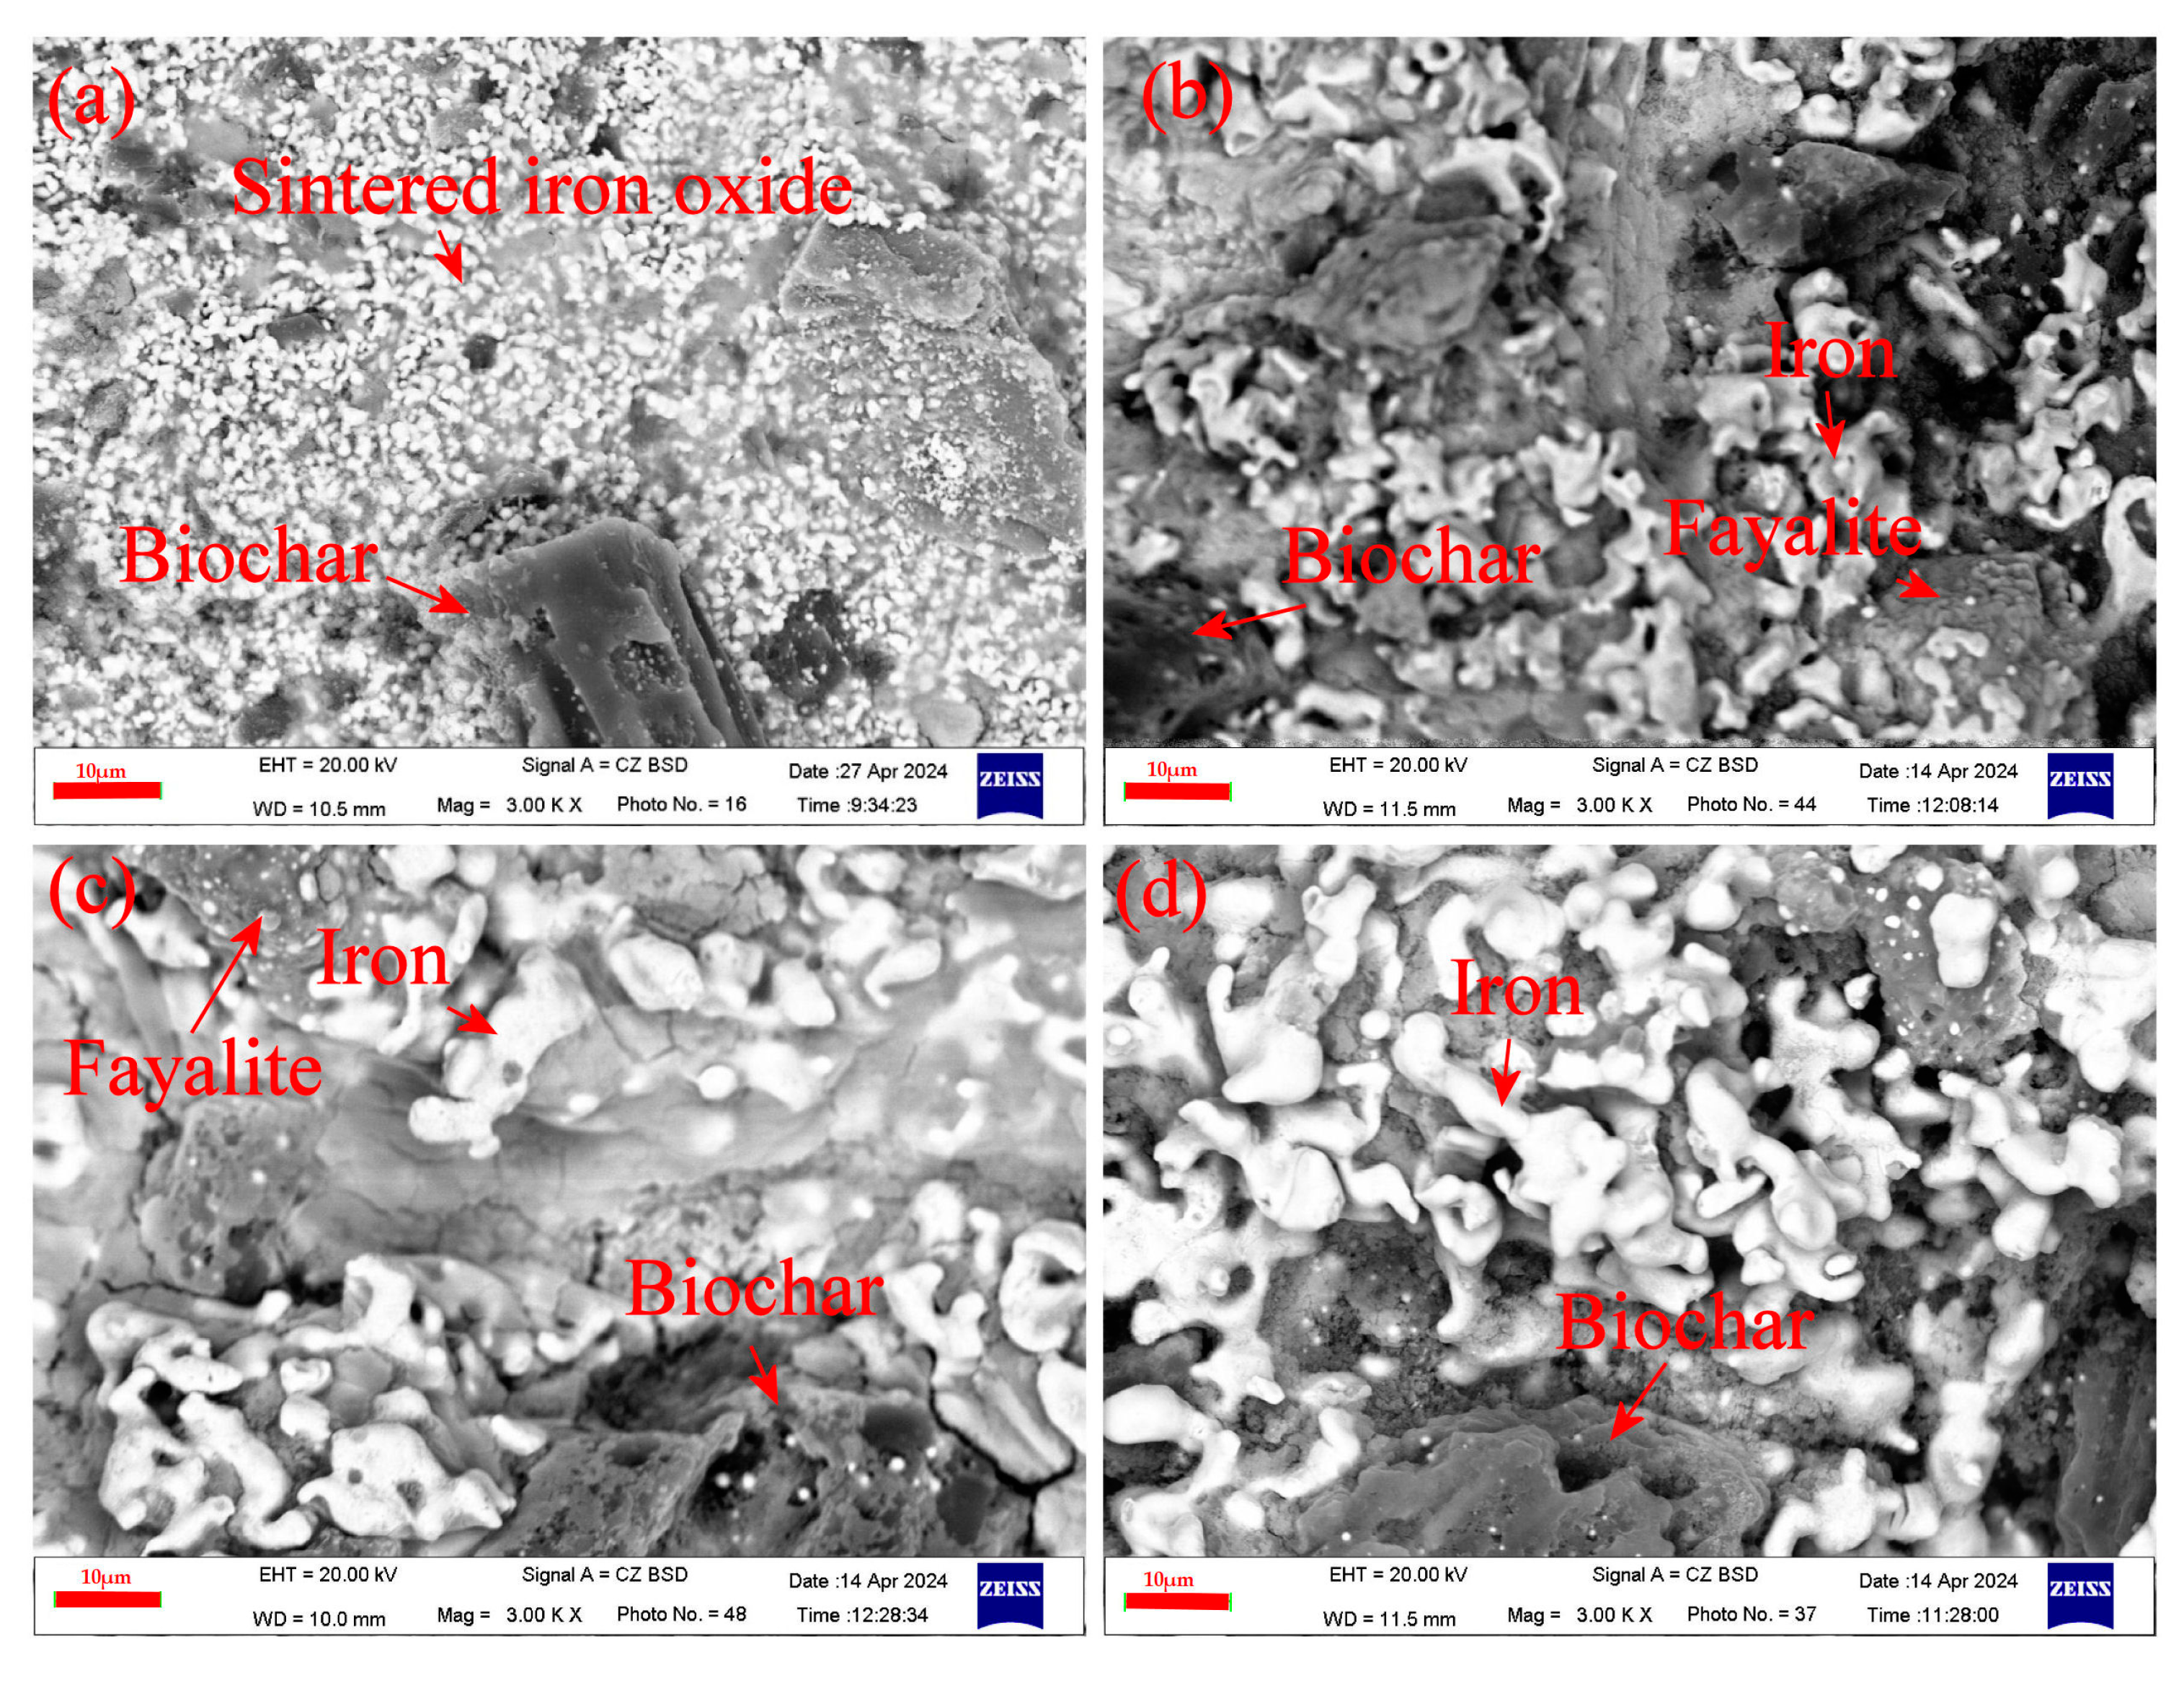
Table 1.
Properties of prepared biochar fines (wt.%).
| Proximate Analysis (ar) | Elemental Analysis (daf) | |||||||
|---|---|---|---|---|---|---|---|---|
| M | A | V | FC | C | H | O | N | S |
| 2.42 | 4.63 | 3.60 | 89.35 | 89.82 | 0.93 | 8.67 | 0.58 | 0.03 |
Table 2.
BCB phase composition (wt.%).
| Fe3O4 | FeO | Fe | C | Gangue |
|---|---|---|---|---|
| 52.57 | 24.54 | 0.98 | 13.16 | 8.75 |
Table 3.
Experimental scenarios.
| No. | Temperature/K | Atmosphere (H2:N2 (Vol.)) |
|---|---|---|
| I | 1173 | 50:50 |
| II | 1273 | 50:50 |
| III | 1373 | 50:50 |
| IV | 1273 | 25:75 |
| V | 1273 | 75:25 |
Table 4.
Reactions involved in the model.
| No | Reaction | Reaction Rate | Refs. |
|---|---|---|---|
| (R1) | [19] | ||
| (R2) | |||
| (R3) | |||
| (R4) | [19] | ||
| (R5) | |||
| (R6) | |||
| (R7) | [20] | ||
| (R8) | [20] |
Table 5.
Terms in Equation (2).
Table 6.
Terms in Equation (8).
Table 7.
RSM values under different ags.
| ags/(m2·m−3) | 5 | 10 | 15 | 20 | 25 |
|---|---|---|---|---|---|
| RMS/- | 0.13544 | 0.05898 | 0.04340 | 0.07914 | 0.08714 |
Table 8.
Distribution of iron-oxide oxygen removal across different pathways under different temperatures.
| Item | 1173 K | 1273 K | 1373 K |
|---|---|---|---|
| Iron-oxide oxygen removed by H2 (%) | 62 | 42 | 26 |
| Iron-oxide oxygen removed by biochar (%) | 29 | 56 | 72 |
| Residual iron-oxide oxygen in BCB (%) | 9 | 2 | 2 |
Table 9.
Ratios of iron-oxide oxygen in different pathways under different atmospheres.
| Item | 25 Vol.% H2-N2 | 50 Vol.% H2-N2 | 75 Vol.% H2-N2 |
|---|---|---|---|
| Iron-oxide oxygen removed by H2 (%) | 37 | 42 | 45 |
| Iron-oxide oxygen removed by biochar (%) | 57 | 56 | 53 |
| Residual iron-oxide oxygen in BCB (%) | 6 | 2 | 2 |
Source link
Ting Zhang www.mdpi.com