1. Introduction
Tea has emerged as one of the most significant and widely consumed nonalcoholic beverages globally because of its distinctive flavor profile and inherent nutritional value [
1,
2]. Tea is roughly divided into six categories based on the processing process, namely white tea, green tea, black tea, yellow tea, dark tea, and oolong tea, and the unique tastes and aromas of these teas are attributed to the differing levels of amino acids, flavonoids, caffeine, and other active compounds present in them [
3,
4]. Flavonoids are primarily concentrated in buds and young leaves and constitute between 12% and 24% of the dry weight of tea [
5]. The principal flavonoid categories include isoflavones, flavanones, flavanols, flavonols, flavones, and anthocyanins [
6]. Extensive research has demonstrated that flavonoids possess free radical scavenging and antioxidant properties [
5,
6,
7,
8], exerting a profound influence on plant defense mechanisms, growth, and development [
9]. Specifically, they influence color formation to attract pollinators, provide UV protection, confer pathogen resistance, mediate plant–microbial signaling interactions, impact pollen fertility, and regulate plant growth [
10,
11]. Within the human body, the intestinal microflora hydrolyzes glycosylated flavonoids into their respective aglycones, resulting in anti-inflammatory, immunomodulatory, and potent anticancer activities and assisting in the management of cardiovascular diseases [
12,
13,
14].
Furthermore, flavonols and catechins are pivotal flavor constituents in tea liquor, exhibiting dual sensory attributes of bitterness and astringency [
15]. Under the catalysis of polyphenol oxidase (PPO), catechins undergo oxidation to form theaflavins, thearubigins, and tea brown pigments, which not only significantly influence the color of tea liquor but also exhibit much lower astringency thresholds compared to catechins [
16]. Anthocyanins, a notable subclass of flavonoids, have gained increasing attention due to their roles in cancer treatment and health care [
17]. Eight types of anthocyanins have been isolated from purple-leaf tea plant varieties for investigation [
18]. These compounds undergo intramolecular coloration via glycosylation and exhibit diverse hues, such as the red appearance of cyanidin-3-O-glucose and cyanidin-3-O-rutin and the dark blue of delphinidin 3,5,3′-O-triglucoside in gentian [
19,
20]. High concentrations of delphinidin 3-O-(6-O-p-coumaroyl) galactoside and cyanidin 3-O-(6-O-p-coumaroyl) galactoside were detected in ‘Zijuan’ purple-leaf tea in contrast to the minimal levels found in ‘Yunkang 10’ green-leaf tea [
21].
Flavonoids accumulate in plant organs like flowers, fruits, and leaves as glycosides, consisting of an aglycone linked to sugar units (e.g., glucose, galactose, and rhamnose). In tea, flavonol glycosides are abundant, accounting for 3–4% of the dry weight, with over 20 aglycones identified [
22,
23]. These can be categorized as quercetin glycosides, myricetin glycosides, and kaempferol glycosides [
23]. Purple-leaf plants are rich in anthocyanins, primarily pelargonidin, cyanidin, delphinidin, peonidin, petunidin, and malvidin [
24]. Tea contains anthocyanin glycosides, such as delphinidin and cyanidin derivatives, with β-D-galactoside and β-D-(6-(E)-p-coumaroyl)-galactopyranoside moieties [
25,
26,
27]. All flavonoids originate from the phenylpropanoid pathway, synthesized from L-phenylalanine under the catalysis of a series of enzymes, such as phenylalanine am-monia-lyase (PAL), chalcone synthase (CHS), chalcone isomerase (CHI), flavonoid 3-hydroxylase (F3H), flavonoid 3′-hydroxylase (F3′H), and flavonoid 3′,5′-hydroxylase (F3′5′H), which regulate the early biosynthetic steps of the flavonoid pathway [
28,
29,
30]. Glycosylation is crucial in plants, involving flavonoid UDP-glycosyltransferase (UGT) that transfers sugar moieties to phenolic compounds [
22,
31,
32]. Currently, a series of UGTs have been found to play crucial roles in the glycosylation process of flavonoids in tea plants. For instance, CsUGT73A17 catalyzes the glycosylation of 17 flavonoids specifically at the 7-O position [
33], while CsUGT72AM1 is responsible for promoting the glucosylation of kaempferol, quercetin, myricetin, and naringenin, among others, at the 3-O position [
18,
34]. Additionally, CsUGT73A20 can catalyze the production of various flavonoid glycosides, including flavonoid 3-O-glucosides, flavonoid 7-O-glycosides, flavonoid 3-O-rhamnosides, and flavonoid 3,7-di-O-rhamnosides [
22,
35]. These studies suggest that UGTs exhibit a complex catalytic role in the glycosylation of flavonoids in tea plants, possessing a diverse range of flavonoid substrates that contribute to the abundant glycosylated flavonoids found in these plants.
In addition to the aforementioned structural genes, transcription factors (TFs) exert crucial regulatory functions in the synthesis of flavonoids. A considerable amount of evidence supports the involvement of MYB TFs in modulating flavonoid synthesis in tea plants. Specifically, CsMYB196 and CsMYB184 exhibit substantial activation of
CsANR and
CsANS expression, thereby orchestrating the biosynthesis of catechins, anthocyanins, and flavonols [
36]. Similarly, CsMYB34 has been reported to participate in the biosynthesis of galloylated catechins [
37]. Notably, CsMYB1 interacts with CsGL3 and CsWD40 to form the MYB-bHLH-WD40 (MBW) transcriptional complex, which subsequently activates the expression of
CsANR and
CsSCPL1A, genes involved in galloylated cis-catechin biosynthesis [
38]. Furthermore, other TF types, including CsbZIP1 [
39], CsWRKY12 [
40], CsWRKY48 [
41], MYC2 [
42], and CsMADSL1 [
43], regulate flavonoid synthesis by modulating the transcription of specific flavonoid biosynthetic genes. Interestingly, Dof TFs have demonstrated their capacity to regulate flavonoid synthesis in other plants [
44,
45]. In tea plants, Dof members are implicated in the regulation of N remobilization [
46], chlorophyll metabolism [
47], and responses to abiotic stress [
48]. However, the role of Dof TFs in regulating flavonoid synthesis within tea plants remains unknown and warrants further elucidation.
A series of tea germplasm resources exhibiting unique leaf colors, distinct from the conventional green color, were observed. These resources are characterized by varying accumulation levels of flavonoids, leading to diversity in tea quality. Recently, numerous studies have focused on the variation in flavonoid metabolism among tea plants with different leaf colors. However, the underlying regulatory mechanisms remain elusive. To address this, our study integrated transcriptome and metabolome analyses to elucidate the potential regulatory network governing specific flavonoid accumulation in tea plants with diverse leaf colors. Special emphasis was placed on the regulatory roles of MYB and DOF transcription factors in flavonoid accumulation in tea plants of different colors. These findings provide crucial foundations for the resource utilization and molecular breeding of tea plants.
3. Discussion
An abundant array of tea germplasm resources, characterized by substantial diversity in the accumulation of biochemical metabolites, particularly flavonoids such as catechins (flavan-3-ols), anthocyanidins, and flavonol glycosides, exert a definitive influence on both tea processing procedures and the ultimate quality of the tea product. These flavonoids have attracted significant attention because of their health benefits and pivotal roles in imparting bitterness and astringency to tea. Additionally, anthocyanidins are crucial factors influencing the coloration of tea plant leaves. Consequently, uncovering the underlying molecular mechanisms responsible for the variations in the accumulation of these compounds among tea cultivars exhibiting distinct color phenotypes represents a promising avenue for the utilization of tea plant resources. To achieve this goal, the flavonoid levels in tea cultivars with these color characteristics were investigated, and a transcriptional regulatory network with flavonoid synthesis structural genes as its core was constructed.
Catechin, anthocyanidin, and flavonol glycoside compounds exhibit distinct variational patterns of accumulation among tea cultivars with different color phenotypes, which are attributed to alterations in the expression of related synthetase genes, including
F3′H,
DFR,
ANS,
ANR,
LAR,
FLS, and
UGT [
18,
21,
49,
50]. For example, the green-leaf tea cultivar ‘Longjing 43′ presented lower expression levels of
F3′H,
FLS,
DFR, and
UGT than the purple-leaf mutant ‘Mooma 1’, resulting in decreased levels of anthocyanidin compounds, several glycosylated flavonols, and two catechin compounds [
18], underscoring the complexity of the accumulation of these flavonoids in tea plants, which is orchestrated by a network of related biosynthetic genes.
In addition to the direct involvement of
ANR and
LAR in the biosynthesis of monomeric catechins,
DFR and
ANS also play synergistic roles [
51,
52,
53]. For example, compared with green shoots, yellow mutant shoots of ‘Danzicha’ have decreased expression of
DFR and
ANS members, accompanied by lower catechin levels [
54]. In our study, the levels of C and EC in ZJ were greater than those in CO and LF, which may be related to
DFRb1. Moreover, other
DFR,
ANS,
ANR, and
LAR members presented relatively high expression levels in LF or CO, and these genes are primarily involved in the formation of other flavonoids not focused on in this study. UGTs play an important role in the diversity of metabolites by catalyzing the transfer of an activated sugar donor to acceptor molecules. In tea plants, several UGTs, such as CsUGT14, CsUGT15, CsUGT73A20, and CsUGT72AM1, were found to be responsible for the biosynthesis of flavonol 3-O-glucosides and anthocyanidin 3-O-glucosides [
18,
22,
54,
55]. Furthermore, BZ1 is a UGT that was suggested to catalyze the formation of anthocyanidin 3-glucoside in plants. In the present study,
CsBZ1-1,
CsBZ1-2,
CsUGT78A15-1, and
CsUGT72AM1 were found to be associated with cyanidin 3-O-glucoside. Moreover,
CsUGT72AM1 was also associated with pelargonidin 3-O-glucoside and quercetin 3-O-glucoside, suggesting their synergistic role in the abundance of these compounds in ZJ. Several studies have indicated that cyanidin levels are notably greater in purple-leaf tea cultivars [
21,
50], whereas other reports indicate that cyanidin levels are not significantly different among yellow-leaf, green-leaf, and purple-leaf tea cultivars [
56]. Interestingly, we found that the cyanidin levels in LF were greater than those in CO and ZJ because of the high expression of
CsANS,
CsANSa, and
CsDFRb3 in LF, which encode enzymes directly responsible for its production and upstream reactions.
Transcription factors (TFs) in plants function as critical regulators involved in the flux of flavonoids. In tea plants, several MYB members function as critical regulators of the biosynthesis of catechins and anthocyanins, affecting the expression of
DFR,
ANS,
ANR, and
LAR either directly or indirectly [
38,
39]. Other TFs, such as bHLH, WRKY, and HSF, also have the ability to regulate the synthesis of specific flavonoids [
40,
49,
57]. These findings indicate a complex network of flavonoid synthesis involving multiple structural genes and transcription factors in tea plants. Our study revealed that the promoters of all of the genes responsible for the biosynthesis of specific catechins, anthocyanidins, and flavonol 3-O-glycosides contain MYB-binding
cis-elements. Furthermore, multiple
MYB genes were highly correlated with the expression of some of these genes, supporting the critical role of
MYB genes in regulating flavonoid biosynthesis. Notably, despite the lack of evidence of the involvement of
Dof genes in flavonoid synthesis in tea plants, the present study revealed that Dof-binding
cis-elements also exist in all investigated gene promoters and that the expression of five
Dof genes was highly correlated with the expression of some of these genes. These findings suggest the potential involvement of
Dof genes in regulating specific flavonoids, which is worthy of further study. In addition, although the function of UGT in tea plants has been well verified, the upstream regulatory factors of
UGT are less well studied. Our study revealed that multiple
MYB and
Dof genes may synergistically regulate their expression, thereby leading to variations in anthocyanidin 3-glucoside and flavonol glycoside accumulation in different tea cultivars.
4. Materials and Methods
4.1. Plant Materials
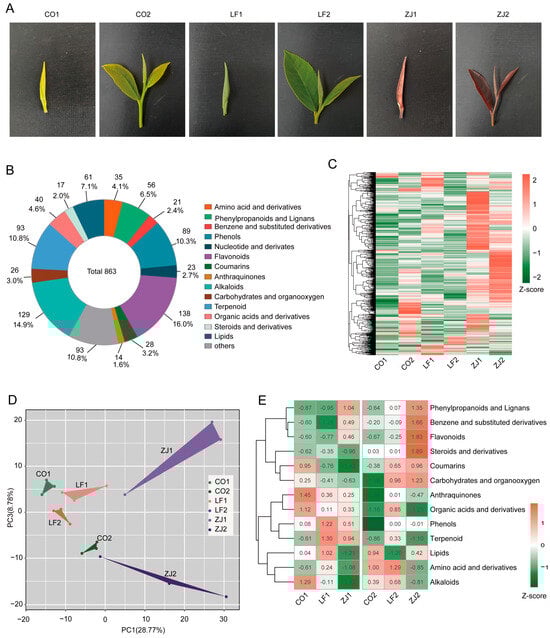
Three tea plant cultivars, ‘Mingguan’ (CO), ‘Lvyafoshou’ (LF), and ‘Zijuan’ (ZJ), which were grown in the tea garden of the Tea Research Institute, Fujian Academy of Agricultural Sciences in Fu’an, China (119° 350′ E, 27° 100′ N), were used in this study. Samples of the buds and one bud with two leaves of each cultivar were collected from at least 60 individual healthy plants and were randomly divided into 3 groups representing three biological replicates. All of the samples were immediately frozen with liquid nitrogen after being removed from the plants and stored at −80 °C for further use.
4.2. Metabolite Extraction and UHPLC-MS Analysis
The freeze-dried samples were crushed with a mixer mill for 30 s at 60 Hz. A 100 mg aliquot of each individual sample was precisely weighed and extracted overnight at 4 °C with 500 μL of extraction solution (methanol/water = 3:1, containing an internal standard: 0.3 mg/mL 2-Chloro-L-phenylalanine) on a shaker. The supernatant was filtered through a 0.22 μm microporous membrane, and the resulting supernatants were subsequently diluted 10 times with extraction solution and vortexed for 30 s before UHPLC-MS analysis.
UHPLC-MS analysis was carried out using a 6500+ Triple Quad LC-MS/MS System equipped with an EXIONLC UHPLC unit (AB Sciex, Framingham, MA, USA). An ACQUITY UPLC HSS T3 column (1.8 μm, 2.1 mm × 100 mm) was used for the separation of metabolite compounds. The mobile phase consisted of water containing 1% formic acid (A) and 100% acetonitrile (B), with a flow rate of 0.4 mL/min. The typical ion source parameters were set as follows: ion spray voltage, +5500 and −4500 V; curtain gas, 35 psi; temperature, 400 °C; ion source gas, 1, 60 psi; ion source gas, 2, 60 psi; and DP, ±100 V.
4.3. Metabolite Data Preprocessing and Analysis
SCIEX Analyst Work Station Software (version 1.6.3) was employed for multiple reaction monitoring (MRM) data acquisition and processing. The qualitative analyses of the compounds were performed by comparing the obtained mass spectra information with a self-constructed database (Metware database: MWDB). During the analysis, isotope signals, as well as repeated signals containing K+, Na+, and NH4+ ions, and signals from fragments of other substances with larger molecular weights, were excluded. Metabolites were quantified by calculating the area of each individual peak. A principal component analysis (PCA) of the identified metabolites was performed using the R package gmodels (version 2.19.1). On the basis of variable importance in the projection (VIP) values of the orthogonal projection to latent structures discriminant analysis (OPLS-DA) model, metabolites with VIP ≥ 1.0, a p value < 0.05, and|Log2 (fold change)| > 1 were defined as significantly differentially accumulated metabolites (DAMs). The R package ‘pheatmap’ (version 1.0.12) was used to generate a heatmap for visualization of DAMs.
4.4. RNA Sequencing and Data Analysis
Total RNA was extracted using the TRIzol reagent (Invitrogen, Carlsbad, CA, USA). The quality and integrity of the RNA from each sample were assessed by a NanoDrop spectrophotometer (Thermo Scientific, Waltham, MA, USA). The RNA library construction and sequencing were performed by Allwegene Company (Beijing, China). The paired-end 150 bp reads of each library were generated using the Illumina NovaSeq 6000 platform.
The raw sequences were transformed into clean reads by removing reads containing adapters, reads containing poly-N sequences, and low-quality reads. The clean reads were subsequently mapped to the ‘Shuchazao’ reference genome [
58] by STAR. HTSeq (version 2.0) was used to count the number of reads mapped to each gene. Gene expression levels were estimated as fragments per kilobase of transcript per million fragments (FPKM). Genes with |Log2 (fold change)| >2 and an adjusted
p value < 0.05 were considered to be differentially expressed genes (DEGs). Kyoto Encyclopedia of Genes and Genomes (KEGG) enrichment analyses were performed via TBtools software (version 2.112). The R package ‘ClusterGVis’ was employed to integrate the expression clusters and KEGG enrichment results of the DEGs.
4.5. Real-Time Quantitative PCR (qRT-PCR) Analysis
Nine genes were randomly selected for qRT-PCR analysis to verify the accuracy of the transcriptome results. GAPDH and PTB were used as reference genes to normalize gene expression using the 2
−ΔΔCt method. The specific primers used are listed in
Table S1. The first-strand cDNA of each sample was prepared using the HiScript III 1st-Strand cDNA Synthesis Kit (Vazyme, Nanjing, China). qRT-PCR was performed using the ChamQ universal SYBR qPCR Master Mix (Vazyme, China) on a LightCycler 480 II platform (Roche, Mannheim, Germany).
4.6. Correlation Analysis and Transcriptional Regulatory Network Construction
The correlation coefficients between the selected DAM levels and the corresponding synthetic gene expressions were calculated and visualized via the R package Hmisc (version 5.1.3) and the qcorrplot function in the R package Hy4m/linkET, respectively. The expression of the Pearson correlation coefficient (PCC) between transcription factor genes and selected structural genes was calculated via the R package Hmisc (version 5.1.3). Promoters of selected genes, 2000 bp sequences upstream of the start codon, were subjected to PlantRegMap [
59] to scan the TF binding sites. The transcriptional regulatory networks were constructed by correlating the PCC > 0.9 between each TF gene and selected structural gene pairs with the corresponding TF binding sites in the promoters of the selected structural genes.