1. Introduction
We have used human primary monocytes in vitro as a reliable model for assessing human innate immunity. We have evaluated the capacity of zein NPs to induce a primary innate/inflammatory response (measured as the balance between the induction of inflammatory and anti-inflammatory cytokines) and also their innate memory-inducing capacity. In addition, we have generated macrophages from blood monocytes, using an established in vitro differentiation system, and assessed the capacity of zein NPs to modulate the M1 and M2 macrophage polarization.
3. Materials and Methods
3.1. Preparation of Zein NPs
Yellow zein (CAS number 9010-66-62, MW 22–24 KDa) and sodium deoxycholate monohydrate (SD) were purchased from Merck Sigma-Aldrich® (Darmstadt, Germany).
3.2. Physical–Chemical Characterization of Zein NPs
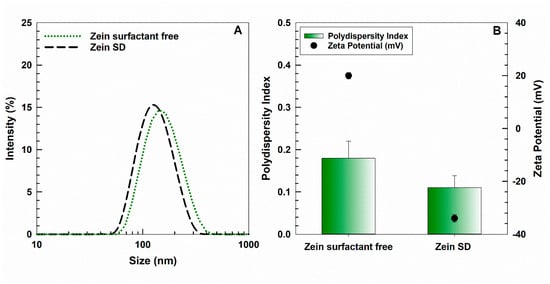
The physical–chemical parameters of NPs such as the mean diameter, size distribution, and zeta potential were investigated via photon correlation spectroscopy (Zetasizer NanoZS, Malvern Panalytical Ltd., Spectris plc, Great Marvern, UK) with an applied third order cumulant fitting correlation function. The results are expressed as a function of the intensity parameter and are the means of three different measurements carried out in triplicate (10 determinations for each replicate) on three different samples ± standard deviation.
3.3. Biocorona Formation on Zein NPs
Before addition to cell culture, zein NPs were pre-incubated in 50% heat-inactivated human AB serum (Sigma-Aldrich) at 37 °C for 1 h under stirring in order to obtain the formation of a serum biocorona on the surface, thereby ensuring particle stability in culture. The serum–NPs mixture was then added directly to culture wells, adjusting NP and serum concentration to the desired values for each treatment.
3.4. Human Monocyte Isolation
Buffy coats collected in bags with sodium citrate as anticoagulant were obtained from six healthy donors, upon informed consent. The procedure was in agreement with the Declaration of Helsinki, and the protocol was approved by the Regional Ethics Committee for Clinical Experimentation of the Tuscany Region (Ethics Committee Register n. 14,914 of 16 May 2019).
Monocytes were isolated by CD14 positive selection with magnetic microbeads (Miltenyi Biotec, Bergisch Gladbach, Germany) from peripheral blood mononuclear cells (PBMC), obtained via Ficoll-Paque gradient density separation (GE Healthcare, Bio-Sciences AB, Uppsala, Sweden). Monocyte preparations used in the experiments were > 95% viable and >95% pure (assessed by trypan blue exclusion and cytosmears).
Monocytes (5 × 10⁵ cells/well) were cultured in RPMI-1640 medium + Glutamax™ (GIBCO™, ThermoFisher Scientific, Waltham, MA, USA) supplemented with 50 μg/mL gentamicin sulfate (GIBCO), 5% heat-inactivated human AB serum (Merck Sigma-Aldrich®), and 10 ng/mL CSF-1 (Merck Sigma-Aldrich®) in a final volume of 1.0 mL in wells of 24-well flat bottom plates (Corning Costar, Corning Inc. Life Sciences, Oneonta, NY, USA). The cells are maintained at 37 °C in a 5% CO2 atmosphere. Monocyte stimulation was performed after overnight resting.
3.5. Human Monocyte Activation and Induction of Innate Memory
For assessing the primary innate/inflammatory response, monocytes were exposed for 24 h to culture medium alone (medium/negative control) or containing 1 ng/mL LPS (positive control; from E. coli O55:B5; Merck Sigma-Aldrich®), serum pre-coated zein NPs, and the mixture LPS + zein NPs.
For the memory experiments, after the first exposure to stimuli for 24 h and supernatant collection, cells were washed and cultured for 7 additional days, the medium refreshed every 3 days. During this period (resting phase), the activation induced by previous stimulation subsided, and cells returned to their baseline status. This was previously determined by the lack of production/release of inflammation-related cytokines (mRNA and proteins) in time course experiments. After the resting phase, the supernatant was replaced with fresh medium alone or containing 5 ng/mL LPS, and incubation was carried out for 24 h (challenge).
All supernatants (after the first stimulation, after the resting phase, and after challenge) were frozen at −80 °C for subsequent cytokine analysis.
Cell viability was monitored during the entire course of culture by visual inspection (viable cell counting in phase contrast optical microscopy). No visible changes in the cell number and viability were identified in response to the different treatments. Duplicate samples were prepared for each experimental condition.
3.6. Human Monocyte-Derived Macrophages Activation and Polarization
Monocytes were cultured in complete culture in the presence of 10 ng/mL CSF-1 (Merck Sigma-Aldrich®) in a final volume of 1.0 mL in wells of 24-well flat bottom plates (Corning Costar). The cells were maintained at 37 °C in a 5% CO2 atmosphere for 7 days to allow spontaneous monocyte differentiation into resting naïve macrophages. The culture medium was refreshed every three days. On day 8, the supernatant was removed, and naïve macrophages were polarized toward M1 or M2 in the absence or presence of 100 ng/mL of zein NPs. M1 polarization was obtained by incubation for 24 h with LPS (10 ng/mL) and human recombinant IFN-γ (20 ng/mL; R&D Systems, Minneapolis, MN, USA). M2 polarization was obtained by adding human recombinant IL-10 (20 ng/mL; R&D Systems) for 24 h. Control naïve macrophages were incubated for 24 h in culture medium alone. Supernatants were collected and frozen at −80 °C for subsequent cytokine analysis.
Cell viability was monitored during the entire course of culture by visual inspection. No visible changes in the cell number and viability were identified in response to the different treatments. Duplicate samples were prepared for each experimental condition.
3.7. Analysis of Surface Markers on Monocyte-Derived Macrophages
Surface markers of naïve, M1, and M2 macrophages were assessed using an immunofluorescent antibody-labeling technique. At the end of the differentiation and polarization period, monocyte-derived macrophages were washed twice in PBS and processed as follows. For the immunofluorescent analysis of CD80 (a costimulatory protein expressed on professional antigen-presenting cells including macrophages), the samples were fixed with 4% paraformaldehyde for 15 min, permeabilized with 0.25% Triton X100/PBS, blocked with 2% BSA/PBS (30 min at RT), incubated with an anti-CD80 (B7-1) rabbit polyclonal antibody (cat. PA5-85913, Invitrogen, Waltham, MA, USA) diluted 1:100 (o/n at 4 °C), and then with a goat anti-rabbit IgG labeled with Alexa Fluor 568 (red) (30 min at RT). For the analysis of CD206 (a protein expressed on human macrophages and generally used as a marker for detecting M2 macrophages), the samples were fixed with 4% paraformaldehyde for 15 min, permeabilized with 0.1% Triton X-100/PBS, blocked with 10% serum/PBS (45 min at RT), incubated with an anti-CD206 rabbit polyclonal antibody (cat. PA5-101657, Invitrogen) diluted 1:200 (o/n at 4 °C), and then with a goat anti-rabbit IgG labeled with Alexa Fluor 568 (red) (30 min at RT). For the analysis of the Mature Macrophage Marker 25F9 (a protein present on mature macrophages both on the cell surface and in intracellular vesicular structures), the samples were fixed with acetone for 15 min at RT, blocked with 2% BSA/PBS (30 min at RT), incubated with an anti-Mature Macrophage Marker mouse monoclonal IgG antibody (eBio25F9 (25F9), cat. 14-0115-82 eBioscience, Invitrogen) diluted 1:100 (o/n at 4 °C), and then with a goat anti-mouse IgG labeled with Alexa Fluor 568 (red) (30 min at RT). For all the samples, nuclei were stained with Hoechst 33258 (blue). Eventually, cells were washed three times in PBS and once in sterile water to remove salts. Coverslips were then mounted on glass microscope slides with Mowiol. Immunolocalization of 25F9, CD80, and CD206 was visualized and images were obtained using a Zeiss LSM700 laser-scanning confocal microscope with a 63× oil-immersion objective (Zeiss, Jena, Germany).
3.8. Evaluation of Zein Uptake
Monocyte-derived macrophages, plated on glass coverslips at the density of 2 × 10⁵ cells/slide, were treated with rhodamine labeled-zein NPs (25 ng/mL) for different time periods (30′, 2 h, 6 h, 24 h). At the end of each experimental time, cells were washed twice in PBS, fixed with 4% paraformaldehyde for 10 min, incubated with Hoechst 33258 to label the nuclei, and washed three times in PBS and once in sterile water to remove salts. Coverslips were then mounted on glass microscope slides with Mowiol. Localization of zein NPs was visualized, and images were obtained using a Zeiss LSM700 laser-scanning confocal microscope with a 63× oil-immersion objective (Zeiss, Jena, Germany).
3.9. Evaluation of Cytokine Production
Production of cytokines was measured in the culture supernatants via ELISA (R&D Systems, Inc., Minneapolis, MN, USA) using a MultiScan FC reader (ThermoScientific, Waltham, MA, USA) according to the manufacturer’s instructions. Two ELISA replicates were run for each sample.
3.10. Statistical Analysis
Cytokine levels are presented as ng per million input monocytes. Graphical presentations and statistical analysis were performed using GraphPad Prism 9 (GraphPad Inc., La Jolla, CA, USA).
Data are shown as averages of biological duplicates or as averages of technical replicates of biological duplicates, and results are reported as mean + standard deviation (sd) of values. Statistical analysis was carried out using a one-way ANOVA unpaired with the Dunnett test for multiple comparisons. For polarization experiments, a one-way ANOVA unpaired with the Bonferroni test was used.
Source link
Annunziata Corteggio www.mdpi.com


