2.1. Iron Oxide Powder Characterization
The reaction condition usually drives the product’s morphology. Hydrothermal treatment of the K3[Fe(CN)6] solution at various OH− concentrations should affect its dissociation and further material crystallization. Herein, two series of iron oxide-based materials were synthesized: (i) series S, without pH modification, where used compounds affected the solution (pH = 8.5), and (ii) series P with an increased pH of up to 12. For both series, materials were synthesized at 24, 48, and 72 h.
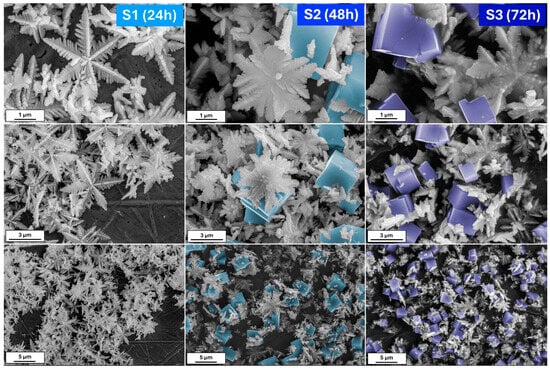
Figure 1 shows the scanning electron microscopy (SEM) images of iron oxide-based architectures obtained by hydrothermal treatment of a K
3[Fe(CN)
6] solution at pH 8.5. After 24 h of reaction, the powder consists of hexagonal snowflake particles. The increase in the synthesis time to 48 h results in the formation of 3D stars; however, cubic forms are also visible. The presence of the damaged particles allows us to conclude that due to the Oswald ripening process, some of the particles dissolve and recrystallize [
29]. On the other hand, the elongated reaction affects the mass transfer. Therefore, it can be assumed that plane hexagonal snowflake iron oxides transform into 3D structures, first as stars and then as cubes. When the synthesis reaches 72 h, the cubic form dominates.
A small change in the process of obtaining the material, such as an increase in the reaction’s pH, allows the observation of something completely different.
Figure 2 shows the morphologies of the powder obtained after 24, 48, and 72 h from the K
3[Fe(CN)
6] solution of pH = 12. In contrast to the previous series, herein, after the 24 h process, the nanoplates of iron oxides are visible. With a prolonged reaction time, thick hexagonal snowflakes appear. Their size is smaller than in the series S. The large amount of nanoplates remains. However, the snowflakes are damaged when the reaction is extended (72 h). Except for the nanoplates, the single branches may be distinguished.
An X-ray diffraction analysis (XRD) can provide more information about the materials’ behavior and synthesis (
Figure 3a,b).
The 24 h process in series S affects the formation of the pure hematite structure (PDF# 01-085-0987). No other additional peaks due to the possible impurity phases were noticed. Highly stable in room temperature, ions [Fe(CN)
6]
3− at a higher temperature treatment for a long time undergo dissociation processes into Fe
3+ ions, which can, upon further hydrolysis, get converted into hydroxy oxides and then hematite [
30,
31]. However, the presence of the tetrairon(III) hexacyanoferrate(II) 9.3-hydrate 4.7-(dideuriohydrate) and tetrairon(III) tris(hexacyanoferrate(II)) tetradecahydrate (PDF #98-002-3103, PDF #98-000-1272) suggest that the number of the OH
− is insufficient to complete the microstructure transformation from hematite snowflakes to hematite cubic particles for elongated synthesis (48 and 72 h).
The addition of the OH
− to the K
3[Fe(CN)
6] solution (pH = 12) increases the dissociation rate of [Fe(CN)
6]
3− and facilitates crystallization in α-Fe
2O
3 (
Figure 3b):
The intermediate phase of hydroxyoxides may be confirmed by using more sensitive techniques, such as Raman spectroscopy, especially when the amount is under the XRD’s detection limit. Additionally, because tetrairon (III) hexacyanoferrate(II) 9.3-hydrate 4.7-(dideuriohydrate) and tetrairon (III) tris(hexacyanoferrate(II)) tetra decahydrate are ionic compounds, their presence in the structure will be neglected.
Figure 4 and
Figure 5 show the Raman spectra of the obtained iron oxide architectures.
Figure 4 shows data obtained for the series S. For all spectra, vibration bands characteristic of hematite (α-Fe
2O
3), at around 224, 290, 409, 505, and 610 cm
−1, are visible [
32,
33]. Additional bands at 244 and 296 cm
−1 may be assigned to the goethite form (α-FeOOH) [
32,
34,
35]. The relation between the modes at 224 and 244 cm
−1 while the elongated reaction time is worth noting. After 24 h of synthesis, the ratio of 1.5:1 suggests the dominance of hematite. The particle transformation from snowflakes to cubes requires a mass transfer, thus resulting in a three times higher signal from FeOOH in the Raman spectra. The 72 h process allows recrystallization, and the amount of α-Fe
2O
3 increases. All data are summarized in
Table 1.
An almost pure α-Fe
2O
3 composition is presented for the series P (
Figure 5). The modes related to the goethite show a too low signal or overlap with the characteristic vibrational bands of hematite. However, the reaction time effect is also visible. With a prolonged synthesis, the band’s intensity at about 218 cm
−1 decreases, which may be related to the structure/particle decomposition/deformation (
Table 1).
Comparing the above results, it may be concluded as follows: (i) The molar ratio of K
3[Fe(CN)
6] and OH
− affects the crystallization of the iron oxide architectures and phase composition. In contrast, the molar ratio K
3[Fe(CN)
6]:OH
− 1:7 affects the formation of the snowflake shapes (24 h)—the ratio of 1:12 results in the production of nanoplates. The hydroxyl ions affect the material’s growth mechanism, according to Zhang et al. [
36], the OH
− is also responsible for surface modification. Higher concentrations of OH
− prevent the O
2− surfaces from further reaction. Therefore, flat and smooth crystal facets are obtained (nanoplates). The growth mechanism is related to the dissociation rate of [Fe(CN)
6]
3− and further reaction with hydroxyl groups. (ii) The reaction time controls and tunes the morphologies of the iron oxide-based particles.
2.2. Electrochemical Characterization of Obtained Materials
Powders from both series were obtained and deposited on the screen-printed electrodes (SPEs) using the drop-casting technique. They were then analyzed for electrochemical activity in the redox couple 0.1 M KCl + 3 mM [Fe(CN)
6]
3−/4− solution. The results are summarized in
Figure 6,
Figure 7 and
Figure 8. Ferricyanide/ferrocyanide undergoes oxidation and reduction repeatedly without significant changes in the system’s behavior or the electrochemical reaction mechanism. When an electric potential is applied to this solution, [Fe(CN)
6]
3− is reduced to [Fe(CN)
6]
4−, and similarly, [Fe(CN)
6]
4− is oxidized back to [Fe(CN)
6]
3−.
The current–voltage dependence for the S series-modified electrodes is presented in
Figure 6. For all samples, characteristic peaks at the anodic (Ia) and cathodic (Ic) curves related to the [Fe(CN)
6]
3−/4− redox reaction are visible; however, the highest signal was recorded for S2. Moreover, additional broad peaks were visible for the samples received for the elongated reaction time (48 and 72 h). They originated from a very thin receptor layer at the screen-printed electrodes and its imperfect covering of the SPE substrate. The comparison of the recorded signal for pure SPE and the modified electrodes allows for the assignment of each peak for the right processes. Further analysis of the received current at the maximum (ratio Ia/Ic) may suggest that all observed behavior is reversible or quasi-reversible. The calculated ratios were 1.19, 0.86, and 1.06 for S1, S2, and S3, respectively. Moreover, under these conditions, the reversibility of the reaction is this ideal separation value of about 50 mV. For all recorded data, the separation was from 5 to 35 mV.
Surprisingly, for the series P, the oxidation–reduction peak of the [Fe(CN)6]3−/4− can be observed only for P1. As in the case of the previously modified screen-printed electrodes, the peak from the target is also visible here. The recorded data for P2 and P3 are similar to each other. The receptor layer seemed thin, so no additional peaks from SPE could be distinguished. On the other hand, according to the received banana shape, it could be the effect of the high capacitive (background current), which could have covered the voltametric signal.
The analysis of the peak current ratio for P1 shows that Ia/Ic is approximately 0.95. However, the plots of the anodic peak current as a function of the square root rate ν
0.5 (
Figure 8a) reveal the complexity of the as-prepared electrodes’ behaviors.
The Randles–Ševčik equation was used to determine the electrochemically active surface area (EASA):
where D is the diffusion coefficient of the [Fe(CN)6]3−/4− redox species (7.2 × 10⁻⁶ cm2s−1), n is the number of the electrons involved in the reaction, herein 1, C0 refers to 3 mM of the concentration of the redox species, and ν represents the scan rate (Vs.−1). The obtained data are summarized in Figure 8b. Implementing the obtained powders at the surface of the carbon substrate results in a decrease in EASA. The SPE electrochemical active surface area is about 0.071 cm2, while for S1, S2, S3, and P1, its size equals 0.012, 0.022, 0.009, and 0.006 cm2, respectively. The results are unsatisfactory despite the shape complexity and various exposed crystal facets. On the one hand, it proves that the receptor modified the SPE surface. Conversely, the mesoporous structure formed from connected snowflake particles seems inactive or presents a repulsive interaction between the redox couple and material.
While the [Fe(CN)6]3−/4− environment is considered a benchmark redox system for electrochemical characterization (e.g., EASA, diffusion coefficient) as a redox probe and neutral pH condition, phosphate-buffered saline (PBS) is close to the biological conditions required. Therefore, the sensing properties were evaluated in a 0.1 M PBS solution with dopamine (DA) molecules.
Figure 9 shows the cyclic voltammograms recorded after subsequent DA additions in the 0–10 mM concentration range. As observed for all samples, the dopamine detection process is reversible. However, an additional strong peak at higher potential values is visible. Its presence can be explained by an inhomogeneous distribution of the receptor layer using the drop-casting technique. The location of the peak and its intensity suggest that it comes directly from the SPE itself, which is also sensitive to dopamine molecules. Moreover, the process of DA detection of SPEs is irreversible, which can be confirmed by the absence of the related peak and the cathodic curve. These data are related to observed electrochemical behavior in the [Fe(CN)
6]
3−/4− environment.
Basic parameters characterizing the sensor activity, such as the limit of detection (LOD), and quantification (LOQ) were calculated by using the following relations:
where SD is a standard deviation obtained from the slope measured current vs. dopamine concentration (Figure 10a), and a is the slope of the linear regression plot.
Figure 10b summarizes the parameters characterizing the electrochemical performance. The snowflake particles’ lower LOD and LOQ values were determined (S1). According to this research’s aim, the results confirm that the specificity of this architecture affects the presence of a large number of active sites, which play crucial roles in molecule detection.
While for series S, it was possible to define the LOD and LOQ for the essential characterization of sensing properties, several problems were encountered for the series P (
Figure 11). First, in sample P1, during the measurements, the receptor layer was partially dissolved; therefore, the recorded curves are full of interferences. Even though during the analysis of the EASA, no redox reaction was observed for the P2 and P3, the modified screen-printed electrodes showed activity towards dopamine. Still, the received Ia and Ic suggested the irreversibility mechanism. Moreover, in the case of P2, the shape of the obtained curve indicated that the detection process is based on electron transfer, followed by a chemical reaction [
37,
38]. A similar effect may be observed for P3. The recorded signal summarizes overlapping two or more peaks [
39]. The complexity of the mechanism detection at this stage is not easy to define. This problem needs to be further investigated.
The lack of stability of the receptor layer completely rules out the usefulness of the P series as dopamine sensors. Nevertheless, a careful analysis of the electrochemical behavior may make it possible to explain the reason for this phenomenon.
The situation is different for the S series. Consideration should be given to (i) the geometry of the powder itself, and (ii) the influence of impurities in the form of the tetrairon (III) hexacyanoferrate(II) 9.3-hydrate 4.7-(dideuriohydrate) and tetrairon (III) tris(hexacyanoferrate(II)) tetra decahydrate, which are ionic compounds. First, ideal snowflake materials, although they pose poor EASA, the complexity of the structures and exposure to various facts affect their activity towards dopamine. Moreover, the hematite structure may affect the interaction between receptor surfaces through hydrogen bonding and coordination interactions with dopamine molecules. The elongated synthesis without the additional presence of OH− groups results in unreacted materials, which, as can be assumed, block this repulsive bonding, and the activity of the sensors drops. Due to this fact, the shape effect cannot be analyzed as trustworthy.
However, comparing the obtained data with the literature (
Table 2) indicates that the snowflakes’ complex structure has the potential to be a dopamine sensor. The LOD and LOQ values compared to widely used electrodes based on carbon materials are similar. Moreover, their electrochemical behavior is better than that of other metal oxides.