1. Introduction
BiFeO
3 (BFO) is a multiferroic material that exhibits room-temperature phase coexistence of ferroelectric and antiferromagnetic orders, making it a promising candidate for various applications [
1]. These include spintronic [
2] and photovoltaic [
3] applications, as well as photocatalysis [
4] and energy storage [
5]. In its bulk form, BFO adopts an R3c rhombohedral structure with a pseudo-cubic lattice parameter a
pc = 3.96 Å (perovskite structure ABO
3). It is characterized by high spontaneous polarization that exceeds 100 µC/cm
2. In recent years, BFO-based solid solutions have been extensively studied, and the main objective was to improve their ferroelectric and magnetic properties [
6]. For instance, rare-earth substitution (Bi
1−xRE
xFeO
3 with RE: La, Dy, Gd, and Sm) has demonstrated enhanced physical properties related to a Morphotropic Phase Boundary (MBP) between the rhombohedral R3c and orthorhombic Pnma phase [
7].
Epitaxial strain, originating from the lattice mismatch between thin films and single-crystal substrates, is also widely used to tune material structures and properties in oxide thin films [
8,
9]. For instance, previous reports have shown that epitaxial deformation can induce ferroelectricity at room temperature in (001)-oriented SrTiO
3 thin films on DyScO
3 substrates [
10]. Strain engineering is also a key tool for controlling domain structures and it can enhance the functionalities of perovskite oxide films, which have a wide range of applications in electronic devices [
11]. Investigations on epitaxial strain effects have been conducted on many perovskite oxide ferroelectrics, including Ba
xSr
1−xTi
xO
3, PbTiO
3, BiFeO
3, and others [
12,
13,
14,
15,
16]. Epitaxial strain from interlayer elastic coupling and the substrate can also affect the properties of superlattices (SLs) [
17,
18]. The most important parameters in determining the epitaxial strain behaviour of SLs are the period thickness (or bilayer thickness for bicolour SLs) and total thickness of the stacking (number of bilayers for bicolour SLs). Such epitaxial relaxation in SLs has previously been investigated in multilayers made of PbTiO
3/PbZrO
3 [
19], BiFeO
3/SrRuO
3 [
20], BiFeO
3/SrTiO
3 [
21], and BiFeO
3/LaFeO
3 [
22].
In this report, we investigate the epitaxial strain relaxation observed in multiferroic (BiFeO
3)/(LaFeO
3) superlattices (BFO/LFO SLs) grown on SrTiO
3 (001) substrate using pulsed laser deposition. This type of superlattice has been investigated in the past, and an antiferroelectric-like state has been discovered by several groups (see [
22,
23] and the references therein). The emergence of such an antiferroelectric state in superlattices made of systems that are ferroelectric and paraelectric in bulk is intriguing and shows the possibility of engineering radically new ferroic states in complex multilayers. Remarkable functional properties are expected with antiferroelectricity, such as energy storage. Prior to use in applications, it is of fundamental importance to understand the mechanism responsible for ferroelectric to antiferroelectric transition in BFO layers confined in BFO/LFO superlattices. In such superlattices, epitaxial strain from the substrate and strain imposed by adjacent layers are naturally expected to play a significant role, but other type of mechanisms might be important. Electrostatic confinement, for instance, may be at the heart of such anti polar ordering. Indeed, ferroelectric layers confined between dielectric layers experience strong depolarizing fields that can either modify the domain structure or the ferroic state. The thinner the ferroelectric layers, the stronger the depolarizing field. In orthoferrites such as BFO and LFO, symmetry mismatch due to competing oxygen octahedral tilt systems is also expected to modify the phase stability. BFO adopts an a
−a
−a
− tilt system, while LFO shows an a
−a
−c
+ tilt system, and it is natural to wonder which tilt systems are set in BFO/LFO nanometric multilayers. We have previously demonstrated, in a certain range of BFO thicknesses, a BFO tilt system similar to LFO in such superlattices ([
22,
23]), which demonstrates the strong versatility of BFO to adopt different structural ordering under specific constraint. This enabled us to propose a phase diagram for a limited range of BFO thicknesses within the antiferroelectric state stability, and we did not explore the transition from the antiferroelectric-like state to the BFO bulk state. We focus here on exploring the effect of the period (Λ or bilayer thickness) while keeping constant the total thickness and the ratio of BFO and LFO (50/50). Our main objective is to complete the previous work by Carcan et al. by extending the investigation into BFO/LFO SLs with very thick periodicity Λ [
22,
23] and complete the phase diagram published in previous reports. We reveal a room-temperature phase transition from the antiferroelectric to the ferroelectric state within the SLs via X-ray diffraction and Raman spectroscopy analysis.
Furthermore, our investigations into the electrical properties show a strong influence of epitaxial strain on the dielectric response of the SLs. These findings highlight a close relationship between epitaxial strain, structure, and electrical behaviour in SLs, underlining the need to understand the complex interactions within these systems to develop novel applications in functional electronics and spintronics.
3. Results
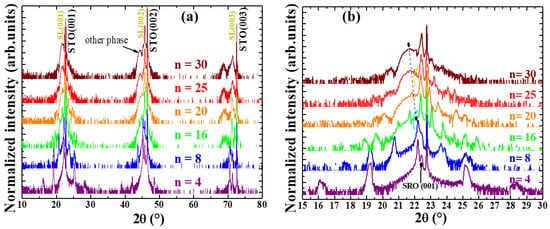
The room-temperature X-ray diffraction (XRD) results for nBFO/nLFO SLs (n being the number of unit cells of each constituent in the bilayer/period) are presented
Figure 1. It should be noted that the total number of BFO and LFO layers has been adjusted to keep the total thickness of the stack around 200 nm. In contrast to our previous investigations, we significantly increase the bilayer thickness up to about 240 Å (considering a pseudo-cubic bulk-like unit cell of 3.96 Å for BFO and 3.92 Å for LFO). This allows us to complete the previously proposed phase diagram with a very large BFO thickness and explore the total transition from the antiferroelectric-like state (confined and thin BFO layers) to the bulk-like and relaxed ferroelectric state.
The diffractograms in the θ-2θ geometry presented in
Figure 1a show only (
00l) Bragg peaks, and no parasitic phases are detected; therefore, epitaxial growth is demonstrated. Zooming in on the first order of diffraction (see
Figure 1b) shows the presence of regularly spaced satellite peaks, illustrating the obtention of a chemical modulation along the growth direction. The presence of finite-size oscillations around the main satellite peak is evidence of a good crystalline quality. From n = 16 unit cells (u.c), a new broad peak appears at lower 2θ values. This peak can be explained by the formation of different domains for SLs for n > 8. Moreover, the sharp and intense satellite peak simultaneously shifts to high 2θ values, indicating strain changes with increases in the number of unit cells (n). This is quantified through the calculation of average out-of-plane (OP) lattice parameters (see
Figure 2) using the Bragg law:
where d, n,
= 1.5406 Å, and
are, respectively, the OP lattice parameter, the diffraction order, the wavelength of the X-ray, and the angular position of the most intense satellite peak.
For ultrathin periodicities where n ≤ 8, the OP lattice parameter is close to 4.05 Å. Between 8 u.c and 16 u.c, the OP parameter shows a drastic jump from 4.04 Å to 3.97 Å, and another decrease is shown between 20 u.c and 25 u.c. The same evolution of the average OP parameter has been observed previously in thinner BFO/LFO SLs grown on MgO substrate [
22]. To further characterize the structural quality, a high-angle annular dark-field Scanning Transmission Electron Microscopy image (HAADF-STEM) is presented in
Figure 3. This preliminary investigation clearly demonstrates the chemical modulation along the growth direction for SLs with 4/4 unit cells in the BFO/LFO bilayers. A detailed STEM structural analysis of the whole set of samples is under progress and will be the subject of another article.
To better understand the SLs’ strain relaxation, reciprocal space mappings (RSMs) were collected around the (103) STO reflection (
Figure 4). For ultrathin bilayers (n = 4), good structural coherence between the substrate (STO) and SL is observed. The substrate and SL reflections indeed show similar q
x values (see black arrow). The SL with 8 u.c also presents a coherent growth, since there is a perfect alignment in q
x between the reflections of the SL and the several reflections of the STO substrate due to mosaicity. From 16 BFO u.c, all SLs are partly relaxed. Two in-plane lattice parameters can be calculated from n = 16 and above. We indeed observe a set of SL reflections that do not have the same q
x as the substrate, and a few reflections (including the SRO) still aligned in q
x with the substrate. The arrows in black and red indicate these two sets of reflections, and intensity versus q
z curves for fixed q
x are also shown. For 4 u.c, sharp peaks for the SL and SRO are observed, along with von Laue oscillations from the bottom-layer SRO (located between the SL and STO nodes). With 8 u.c, two structural domains coherent with substrate domains are shown in the q
z out-of-plane direction. The interpretation of the intensity profile is made difficult by the presence of multiple STO reflections, but regularly spaced satellites along q
z are clearly visible on the map. For 16 u.c and 25 u.c, two curves correspond to the black arrow (strained part) and the red arrow (relaxed part). In
Figure 4c,d, the relaxed part (red arrow) exhibits a principal satellite peak with secondary satellite peaks. For 16 u.c (25 u.c), a broad peak emerges for q
z at about 7.43 nm
−1 (7.35 nm
−1), which probably corresponds to a small part of the BFO/LFO stack still coherent with the substrate and directly in contact with the strained SRO bottom electrode (the SLs’ q
z value being thickness-dependent). We recall that the stack starts with BFO and such q
z values correspond to 4.04–4.08 Å out-of-plane lattice parameter close to the values obtained for the so-called BFO R’ phase (strained rhombohedral BFO; see Sando et al. [
24]). Only an electron microscopy investigation would confirm such a hypothesis, and this investigation is under progress. The lattice parameters extracted from
Figure 1 and
Figure 4 are shown in
Figure 5. Only the strongest contributions to the (103) maps (relaxed part for n > 8 u.c) are taken into account here.
When the SL is strained with STO (a = 3.905 Å), the OP parameter is at its maximum value, indicating an in-plane compressive strain. We recall that BFO and LFO pseudo-cubic lattice parameters are, respectively, 3.96 Å and 3.93 Å. Consequently, in-plane compressive strains are therefore expected with STO substrates, which is in perfect agreement with
Figure 4. The epitaxial strain relaxation of the BFO/LFO stack is evidenced by the increase in the IP lattice parameter to 3.95 Å for n = 16 u.c.
These results demonstrate the change in the SL structure by varying the bilayer thickness and interlayer elastic coupling (by keeping the total thickness constant, we expect a similar substrate impact for all SLs). It is difficult at this point to infer a symmetry change from the XRD results only. In order to gain additional information concerning a possible modification of the symmetry, we performed a Raman spectroscopy investigation.
The Raman spectra obtained in parallel geometry to the
measurements are shown
Figure 6, in comparison with the Raman spectra of the STO (001)-oriented crystal (bare substrate).
The uncoated substrate spectrum is displayed in order to facilitate a direct comparison with all SL spectra because of the strong STO contribution. It is known that BiFeO
3 with a rhombohedral R3c structure is distinguished by two Raman modes between 100 cm
−1 and 200 cm
−1. This portion of the BiFeO
3 single-layer spectrum is characterized by two phonons at 138 cm
−1 and 170 cm
−1, with the first one having greater intensity [
22].
This is exactly what is shown for the thick period (with 25 < n < 30), but these two modes are observed at 143 cm
−1 and 182 cm
−1 in our case [
22]. This shift can be attributed to strain. Gruneisein parameters are only known from hydrostatic pressure and cannot be used to estimate the strain in our SLs, since only biaxial strain is expected. When the number of unit cells is below 25, the intensity ratio of these two modes (I (of 143 cm
−1)/I (of 180 cm
−1)) is changed. The phonon at 182 cm
−1 is more intense than the phonon at 142 cm
−1. This change was observed by Carcan et al. on antiferroelectric-like BFO/LFO superlattices [
22] and by Bielecki et al. in bulk Bi
(1−x)La
xFeO
3 solid solution [
25]. Bielecki et al. evidenced a PbZrO
3 antiferroelectric-like symmetry when the 180 cm
−1 phonon is more intense compared to the phonon at 143 cm
−1. Thus, the Raman spectra observations strongly suggest a ferroelectric-like state for thick bilayers (25 < n < 30) and an antiferroelectric-like state for n below 25. A mixture of state cannot, however, be ruled out. We note that Mundy et al. demonstrated an antiferroelectric stable phase for n = 15 in similar superlattices (La
0.4Bi
0.6FeO
3)
15/(BiFeO
3)
15) and in agreement with our Raman observations [
26]. At very low unit cell numbers and bilayer thicknesses, the Raman signal is unfortunately too weak and no spectral information can be gained.
Dielectric properties of all SLs were also investigated since electrical responses are powerful signatures to distinguish between different (anti)ferroic states. The Nyquist plots of BFO/LFO superlattices shown in
Figure 7 were obtained across a frequency range of 100 Hz to 1 MHz at room temperature.
To interpret the impedance spectra response, we consider the stack as an effective medium and determine the complex dielectric function ε.
The relationship between the complex Z and ε functions is given by the following Equations (1) and (2):
where Z(ω) and C(ω) are, respectively, the complex impedance and capacitance functions, and j is the imaginary number. C(ω) is then related to ε(ω) by
where ε0 is the vacuum dielectric constant, ε(ω) is the complex dielectric function, and d is the thickness of the SLs.
The real and imaginary parts of the dielectric function of the SLs are shown in
Figure 8.
The real part of the dielectric function (
Figure 8a) remains constant over a wide frequency range, but it exhibits larger values for low frequencies. This low-frequency increase is more pronounced in the imaginary part (
Figure 8b) and might be due to extrinsic contributions, such as leakage currents. The dielectric response shown on the plateau (
Figure 8c) is however attributable to intrinsic contributions, since it does not scale with the number of interfaces (as expected from a Maxwell–Wagner mechanism). The dielectric constant for fixed frequency (
Figure 8c) is indeed grouped by pairs, in perfect correlation with the structural features deduced by the XRD and Raman spectra. We therefore interpret these dielectric responses as emerging from the (anti)ferroic states and domain structures. The two SLs with lower periodicities (n = 4 and 8) and showing coherent growth possess the highest dielectric constant, and were considered to be antiferroelectric according to the XRD and Raman spectra and by a comparison with previous reports in the literature. The dielectric constant then decreases when the period of the SLs increases (
Figure 8c). The dielectric losses (extrinsic effects) are almost constant for the whole set of samples and in the 0.05–0.1 range (
Figure 8c), and therefore cannot explain the trend we observe on going from ultrathin bilayers to thick bilayers. The perfect correlation between the dielectric response and the strain/domain state is demonstrated in
Figure 9. Such a decrease in dielectric constant is due to a combined effect of symmetry/domain changes and strain relaxation within the SLs.
The difference in the samples’ ferroic state and structure (coherent versus relaxed) is therefore suggested as the origin for the dielectric behaviour [
27,
28,
29,
30,
31].
To interpret impedance spectroscopy and dielectric response data, an approach based on an equivalent circuit is often used in the literature. Each layer of the superlattice was modelled using a combination of resistance and capacitance by Hadjimichael et al. for PbTiO
3/SrRuO
3 SLs, for instance [
32], and also for ferroelectric/dielectric SLs [
33]. Such an approach allows the interpretation of the possible microstructural origins of the observed dielectric relaxations [
33,
34,
35]. For instance, interfaces, grain boundaries, and bulk contributions can be inferred from such analysis. To succeed in such an approach, however, it is often combined with temperature-dependent investigation to distinguish between the different processes (thermally activated or not). The temperature dependence of the dielectric response of the SLs is under investigation, and we hope that such temperature-dependent investigation will reveal the physical origin of the observed dielectric response. Our room-temperature data nevertheless confirm the possibility of tuning (anti)ferroic states with different periods and the transition from an antiferroelectric-like state to a mixed state, and then to a ferroelectric-like state.